DailyPlay – Adjusting Trade (GS) & Closing Trade (FSLR, CRWD) – August 08, 2025
Closing Trade GS Bullish Trade Adjustment Signal...
Read MoreStrategy: Short Put Vertical Spread
Direction: Bullish
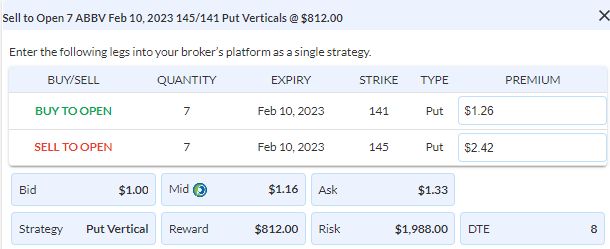
Details: Sell to Open 7 Contracts Feb 10th $145/$141 Put Vertical Spreads @ $1.16 Credit per contract.
Total Risk: This trade has a max risk of $1,988 (7 Contracts x $284).
Counter Trend Signal: This is a Bullish trade on a stock that is experiencing a bearish trend.
1M/6M Trends: Bearish/Bearish
Technical Score: 3/10
OptionsPlay Score: 88
Use the following details to enter the trade on your trading platform. Please note that whenever there is a multi-leg option strategy, it should be entered as a single trade.

Please note that these prices are based on yesterday’s closing prices. Should the underlying move significantly during the pre-market hours, we will likely adjust the strikes and prices to reflect a more accurate trade entry.
Investment Rationale
The Fed spoke, and it wasn’t that they particularly said bullish comments to make the market turnaround from a 1% loss to over a 1% gain. But it was the lack of any semblance of remarks similar to what Powell said in August at the Jackson Hole meeting that gave bears reason to cover shorts and bulls to put some money to work. (I still hear from trading desks that the bulk of buying is coming from shorts covering than it is from real new money coming in. They say that mutual fund PMs are still net sellers into this strength.) That should give you some reason not to be overzealous.
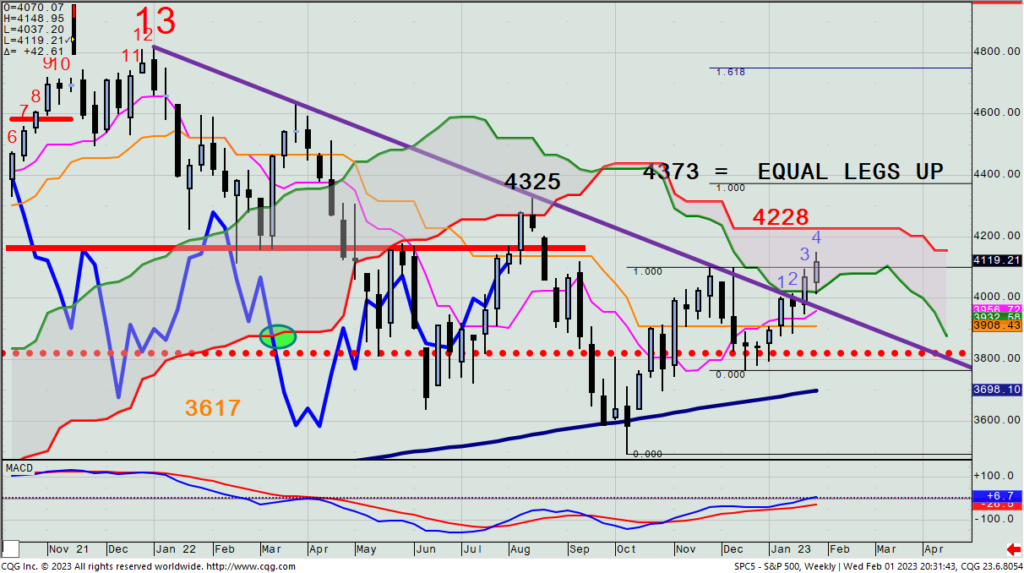
I can make the case that there’s still more upside to go, and we possibly see the SPX test the weekly cloud high at 4228, or even the August high near 4325. If it gets above the latter, I will likely start selling stocks again, as that move would almost assuredly drag out all previous shorts (i.e., actually increasing the odds that the upmove won’t have much more to go).
SPX – Weekly

Here’s an idea for a new trade that is very tactical in nature, and is playing that between now and earnings on the morning of Feb. 9th (giving us a max. of 6 days to hold the position (unless it surprisingly materially rallies between now and then, which would then potentially give us a reason to hold through the earnings report).
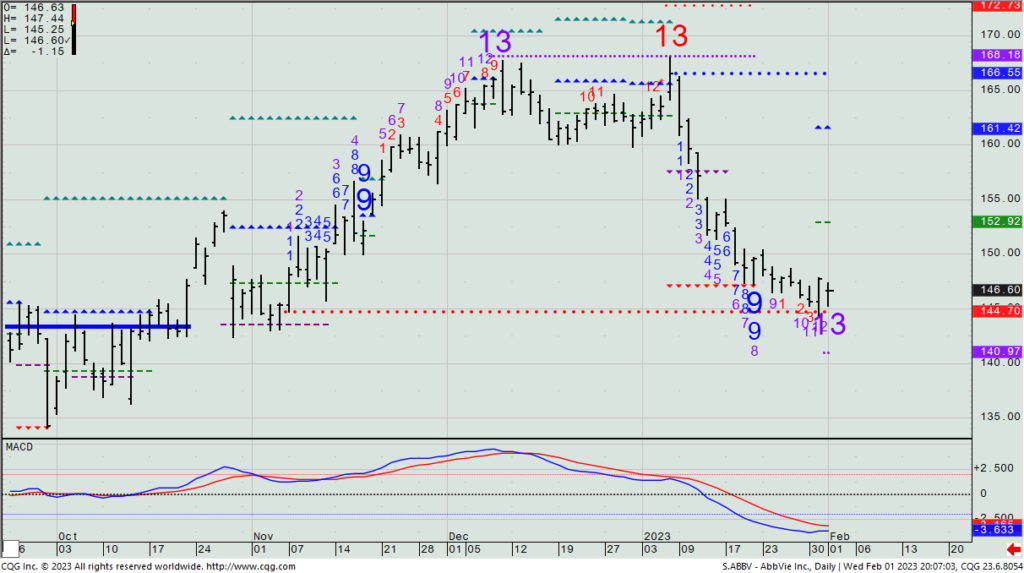
Let’s look at the daily chart of ABBV, a stock that we recently made very good money on when we were long a $160/$145 put spread. With it continually holding right around that $145 support level and then yesterday marking an Aggressive Combo -13 signal, I’d think that this will not materially decline before that 2/9 report, giving us the chance to make some money by collecting downside premium.
ABBV – Daily

As such, let’s look to sell a Feb. 10th $145/$141 put spread. It’s slightly out of the money, and only collects 29% of the spread differential ($1.165 as of yesterday’s closing mid price). Though this is not what I’d normally be willing to accept on a credit put spread, buying calls could easily see time pass to not accomplish the goal of us making money. (BTW- the $146/$152.50 call spread cost 39+ percent, so they’re definitely no bargain, either.)

Closing Trade GS Bullish Trade Adjustment Signal...
Read More
XYZ Bullish Opening Trade Signal Investment Rationale...
Read More
CRWD Bearish Opening Trade Signal Investment Rationale...
Read More
Closing Trade PINS Bullish Opening Trade Signal Investment...
Read More
Share this on