DailyPlay – Closing Trade (FDX) & Portfolio Review – October 13, 2025
Closing Trade DailyPlay Portfolio Review Our Trades C...
Read MoreInvestment Thesis
Citigroup (C) offers an attractive bullish setup as it continues to improve its profitability and strengthen its balance sheet. The stock remains modestly undervalued compared to peers, yet it is demonstrating relative strength against the broader financial sector and the S&P 500. With management focused on efficiency gains and earnings growth, the current momentum in both the share price and fundamentals positions the stock for a sustained move higher. We see upside potential toward $135 as C closes its valuation gap while capitalizing on favorable macro tailwinds in the banking sector.
Technical Analysis
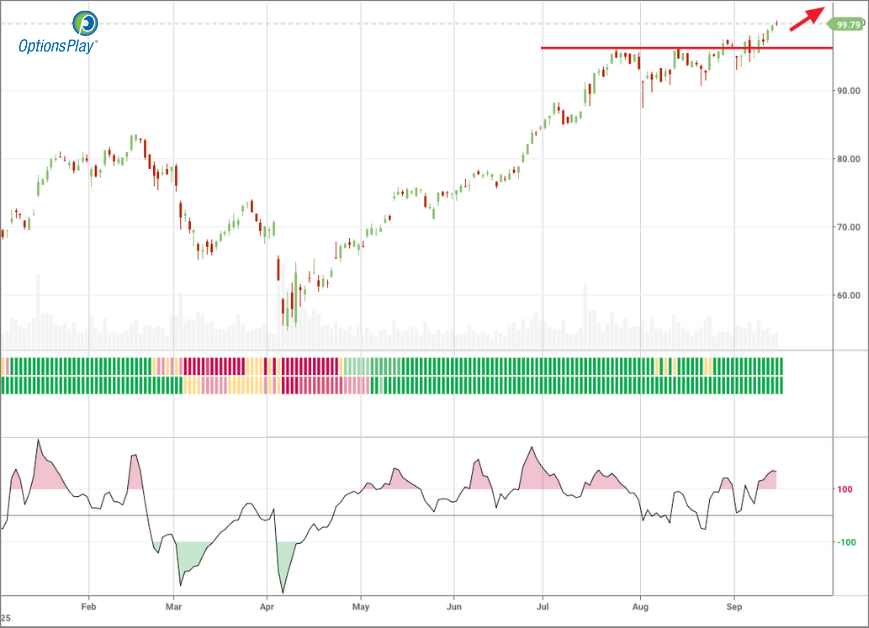
The stock has decisively cleared the $97 resistance level, which is now acting as firm support, while maintaining strength above the 20-day, 50-day, and 200-day moving averages, an alignment that confirms the prevailing uptrend. Momentum indicators are also supportive, with the RSI holding in the mid-60s, signaling steady buying interest without reaching overbought territory. This combination of technical strength and healthy momentum reinforces the bullish setup and points to further upside potential.
Fundamental Analysis
Citigroup continues to trade at a discount to peers, offering investors a value-driven growth story. While revenue growth lags the industry, its superior earnings trajectory reflects the company’s focus on restructuring, operational efficiency, and improved capital returns. Net margins remain below the sector median, but improving profitability should support multiple expansion.
Options Trade
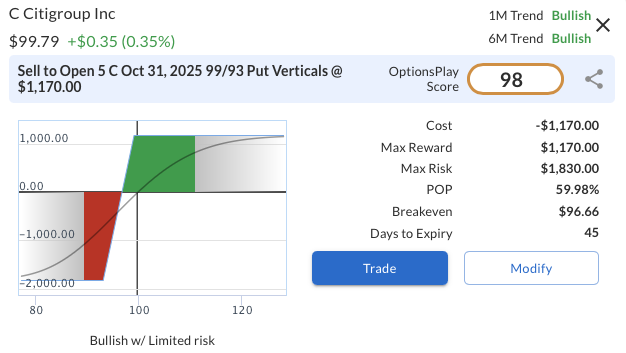
To express a bullish view on Citigroup (C), we recommend selling the Oct 31, 2025 $99/$93 put vertical spread for a net credit of $2.34. This involves selling the $99 put and buying the $93 put, resulting in a maximum potential profit of $234 per spread if C remains above $99 at expiration. The maximum risk is capped at $366 per spread, creating a favorable risk/reward setup where the trade yields a return of roughly 64% on risk if C holds above the short strike.
Strategy: Short Put Vertical Spread
Direction: Bullish Credit Spread
Details: Sell to Open 5 C Oct 31 $99/$93 Put Vertical Spreads @ $2.34 Credit per Contract.
Total Risk: This trade has a max risk of $1,830 (5 Contracts x $366) based on a hypothetical $100k portfolio risking 2%. We suggest risking only 2% of the value of your portfolio and divide it by $366 to select the # contracts for your portfolio.
Trend Continuation Signal: This is a bullish trade on a stock that is expected to continue higher over the duration of this trade.
1M/6M Trends: Bullish/Bullish
Relative Strength: 9/10
OptionsPlay Score: 98
Stop Loss: @ $4.68 (100% loss to value of premium)
Use the following details to enter the trade on your trading platform. Please note that whenever there is a multi-leg option strategy, it should be entered as a single trade.
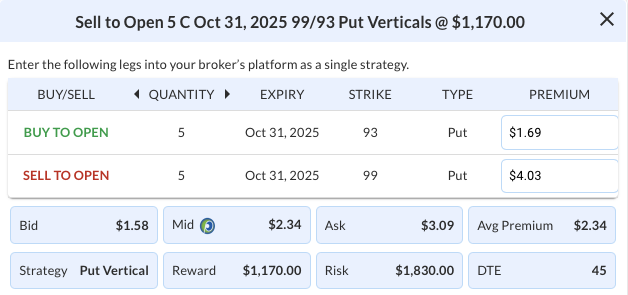
PLEASE NOTE that these prices are based on Monday’s closing prices. Should the underlying move significantly during the pre-market hours, we will likely adjust the strikes and prices to reflect a more accurate trade entry.
Closing Trade DailyPlay Portfolio Review Our Trades C...
Read MoreC Bullish Opening Trade Signal Investment Rationale...
Read MoreFDX Bullish Opening Trade Signal Investment Rationale...
Read More


Share this on