DailyPlay – Portfolio Review – August 11, 2025
DailyPlay Portfolio Review Our Trades GOOGL – 25 DTE...
Read MoreStrategy: Short Put Vertical Spread
Direction: Bullish
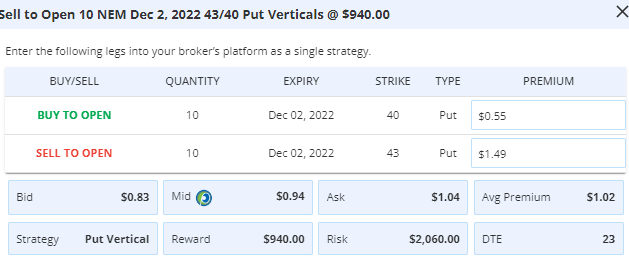
Details: Sell to Open 10 Contracts Dec. 2nd $43/$40 Put Vertical Spreads @ $0.94 Credit.
Total Risk: This trade has a max risk of $2.060 (10 Contracts x $206).
Trend Continuation Signal: This is a Bullish trade on a stock that is experiencing a neutral to bullish trend.
1M/6M Trends: Bullish/Neutral
Technical Score: 2/10
OptionsPlay Score: 90
Use the following details to enter the trade on your trading platform. Please note that if there is a multi-leg option strategy, it should be entered as a single trade.

Please note that this is a CONDITIONAL trade. We will only enter the trade when the condition is met, which is IF we see a decline to $43–$42.75 anytime this week. Also note that the cost basis, premium paid, as well as the number of contracts when we open this trade will therefore be different from what we post today. This condition is only valid for this week.
Stocks edged higher into Election Day, as many think that Republicans taking at least of 1 of 2 houses (if not both) will lead to a halt to any early-discussed upcoming legislation that could put a damper on the tech and/or energy sectors. Historically, this is a favorable time for the equity market in the mid-term presidential cycle, and of course, you already know that the November to May period is a far stronger one than the May to October time frame.
I write this early enough on Tuesday night to not have any sense of how elections will pan out, or for how investors will take the results going forward. As I’ve previously said, I believe the House will be won by the Republicans, and I’m not sure about the Senate, but if I had to pick side, I’d say they also end up netting one new Senator in order to take that chamber, too. And what that basically means, is that President Biden won’t likely be able to get any new legislation passed in his final two years of his presidency.
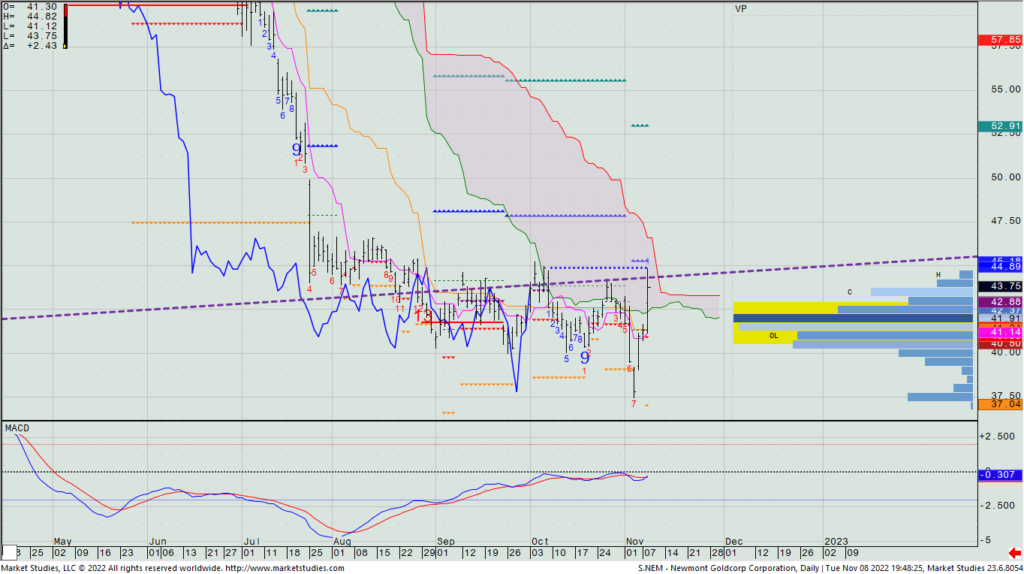
Marketwise, yesterday we saw the popular gold miner Newmont Goldcorp (NEM) continue higher to its best daily close in a month. Given the spike bottom reversal we saw in it, I think we get a move that reaches up to the Propulsion Exhaustion levels (i.e., the blue upward pointed triangle lines) at $47.73 and $48.00. I suspect we’ll have a chance this week to buy NEM on a pullback, especially with yesterday reaching the most recent TDST resistance line (the horizontal dotted blue line) at Tuesday’s high. So, if we see a decline to $43–$42.75 anytime this week, let’s look to sell a Dec. 2nd $43/$40 put spread for what the then current bid/offer mid-price is trading for.
NEM – Daily


DailyPlay Portfolio Review Our Trades GOOGL – 25 DTE...
Read More
Closing Trade GS Bullish Trade Adjustment Signal...
Read More
XYZ Bullish Opening Trade Signal Investment Rationale...
Read More
CRWD Bearish Opening Trade Signal Investment Rationale...
Read More
Share this on