DailyPlay – Portfolio Review – August 11, 2025
DailyPlay Portfolio Review Our Trades GOOGL – 25 DTE...
Read MoreStrategy: Short Call Vertical Spread
Direction: Bearish
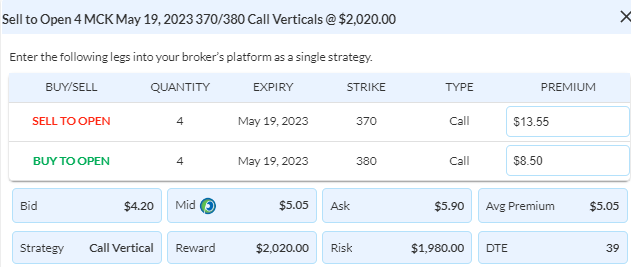
Details: Sell to Open 4 Contracts May 19th $370/$380 Call Vertical Spreads @ $5.05 Credit per contract.
Total Risk: This trade has a max risk of $1,980 (4 Contracts x $495) based on a hypothetical $100,000 portfolio risking 2%. We suggest using 2% of your portfolio value and divide it by $495 to select the # contracts for your portfolio.
Counter Trend Signal: This stock has rallied to a level of resistance and is expected to pull back lower.
1M/6M Trends: Bullish/Bullish
Technical Score: 8/10
OptionsPlay Score: 115
Use the following details to enter the trade on your trading platform. Please note that whenever there is a multi-leg option strategy, it should be entered as a single trade.

Please note that these prices are based on Friday’s closing prices. Should the underlying move significantly during the pre-market hours, we will likely adjust the strikes and prices to reflect a more accurate trade entry.
Investment Rationale
The weekly “doji” candles (i.e., weekly open and close virtually the same) last week in the SPY and QQQ both came up against resistance, and could be foretelling if this week opens near its high and closes near its low (on a decent down week), as that would create an “evening star” pattern that is not only usually bearish, but could easily become the last high of the 6-month rally and start a downmove to test last year’s lows. On the flip side, a close this week above SPX 4155 would be bullish, if we see follow-through next week. Put these two opposite scenarios together, and I think we are shortly to see a decent directional move that changes the landscape we’ve seen so far in 2023.
If I am right, one way to play this idea is by buying volatility in the SPY or QQQ. Both are relatively inexpensive relative to what we’ve seen this year. Potential plays can be going long straddles, strangles, or even iron condors.
When it comes to looking at the option board on the VIX itself, look at the massive skew that ATM calls have relative to ATM puts (going out 37 days). The price differential is significant.

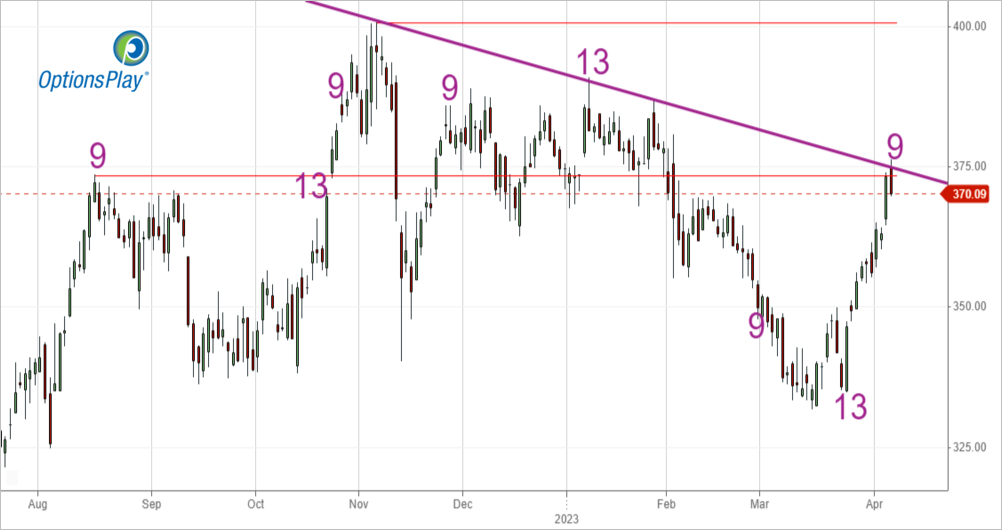
Let’s look at the stock chart of McKesson Corp. (MCK). Price has surged recently from a daily -13 bottom to now having reached a Setup +9 potential near-term top.
MCK – Daily

With calls priced quite high, let’s look to sell a May 19th $370/$380 call spread. It closed at $5.05 mid on Friday, representing almost 51% of the $10 strike differential. Earnings come out on May 8th, so we will be out by then. But frankly, collecting 50% into resistance from both the early-Feb. breakdown area and the downtrend from all-time highs seems like a bet worth taking.

DailyPlay Portfolio Review Our Trades GOOGL – 25 DTE...
Read More
Closing Trade GS Bullish Trade Adjustment Signal...
Read More
XYZ Bullish Opening Trade Signal Investment Rationale...
Read More
CRWD Bearish Opening Trade Signal Investment Rationale...
Read More
Share this on