
$DE

DailyPlay – Opening Trade (DE) Partial Closing Trade (BIIB) – July 12, 2022
Partial Closing Trade
- BIIB: 15.15% Loss: Sell to Close 3 Contracts July 15, 2022 $215/$225 Call Verticals @ $2.80 Credit. DailyPlay Portfolio: By closing 3 of the 6 Contracts, we will be receiving $1,680.
Bearish Opening Trade Signal
Strategy Details
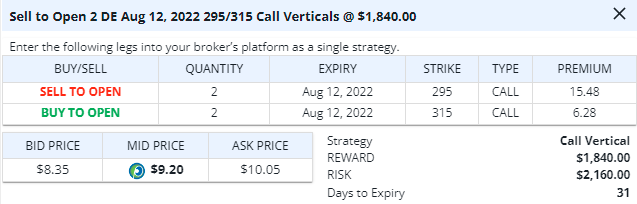
Strategy: Short Call Vertical Spread
Direction: Bearish
Details: Sell to Open 2 Contracts Aug 12, 2022 $295/$315 Call Verticals @ $9.20 Credit..
Total Risk: This trade has a max risk of $2,160 (2 Contracts x $1,080 per contract).
Trend Continuation Signal: This is a Bearish trade on a stock that is experiencing a bearish trend.
1M/6M Trends: Bearish/Bearish
Technical Score: 4/10
OptionsPlay Score: 111
Entering the Trade
Use the following details to enter the trade on your trading platform. Please note that if there is a multi-leg option strategy, it should be entered as a single trade.
Please note these prices are based on the previous day’s closing prices. Should the underlying move significantly during the pre-market hours, we will likely adjust the strikes and prices to reflect a more accurate trade entry. This will be reflected in the Portfolio tab within the OptionsPlay platform.
Investment Rationale
Stocks took it on the chin on Monday, after all, major US stock indexes again failed at their weekly Conversion Lines. It’s too soon to know that the rally has completely halted, but at least we know that the recent rallies all stalled at first level weekly resistance.
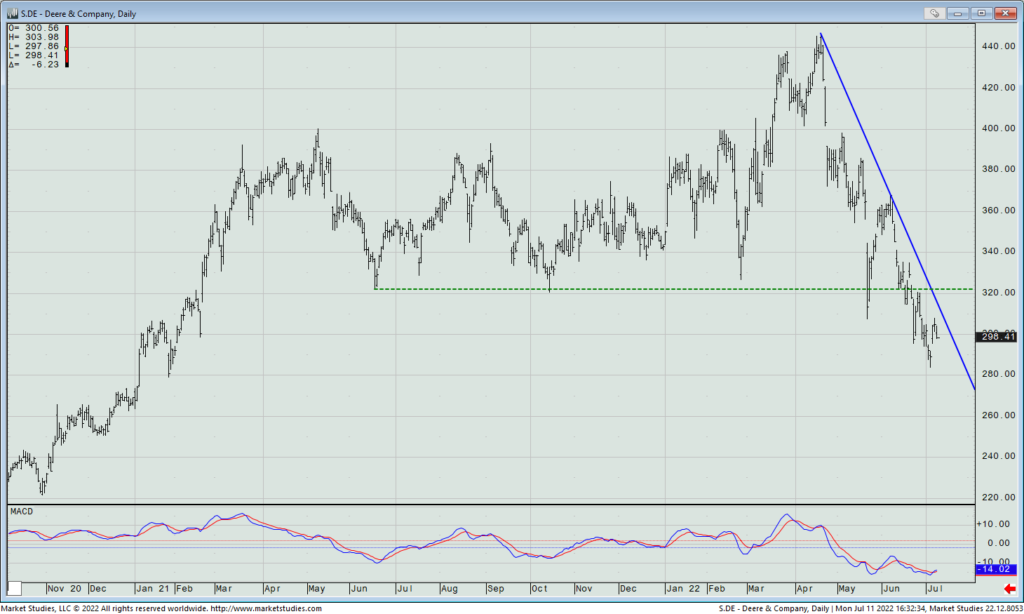
Looking at a name that has seemingly broken down (and should have a strong wall of resistance above it) is Deere & Company (DE). In the last few weeks, it has broken beneath a significant support line near $322.
With the stock reporting earnings on August 19, let’s look to short an August 12th $295/$315 call spread for what closed on Monday at $9.20 mid. This represents collecting 46% of the spread differential.
DE – Daily
Elsewhere, we hold a long BIIB July 15 $215/$225 call spread that expires on Friday with the stock trading right at $215. Let’s sell half today as we’re running out of time for this to hold its recent rally.
$DAL, $AAPL

DailyPlay – Opening Trade (DAL) Closing Trade (AAPL) – July 11, 2022
Closing Trade
- AAPL: 83.08% Gain: Buy to Close 3 Contracts July 29, 2022 $130/$120 Put Verticals @ $0.55 Debit. DailyPlay Portfolio: By closing 3 Contracts, we will be paying $165.
Bullish Opening Trade Signal
Strategy Details
Strategy: Long Call Vertical Spread
Direction: Bullish
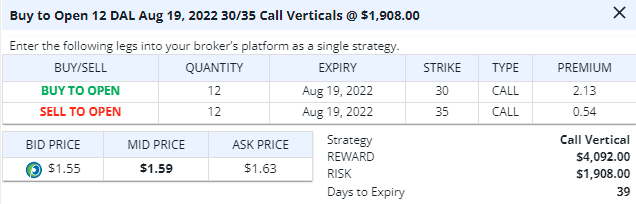
Details: Buy to Open 12 Contracts Aug 19, 2022 $30/$35 Call Verticals @ $1.59 Debit.
Total Risk: This trade has a max risk of $1,908 (12 Contracts x $159 per contract).
Counter Trend Signal: This is a Bullish trade on a stock that is experiencing a bearish trend.
1M/6M Trends: Bearish/Bearish
Technical Score: 3/10
OptionsPlay Score: 103
Entering the Trade
Use the following details to enter the trade on your trading platform. Please note that if there is a multi-leg option strategy, it should be entered as a single trade.
Please note these prices are based on the previous day’s closing prices. Should the underlying move significantly during the pre-market hours, we will likely adjust the strikes and prices to reflect a more accurate trade entry. This will be reflected in the Portfolio tab within the OptionsPlay platform.
Investment Rationale
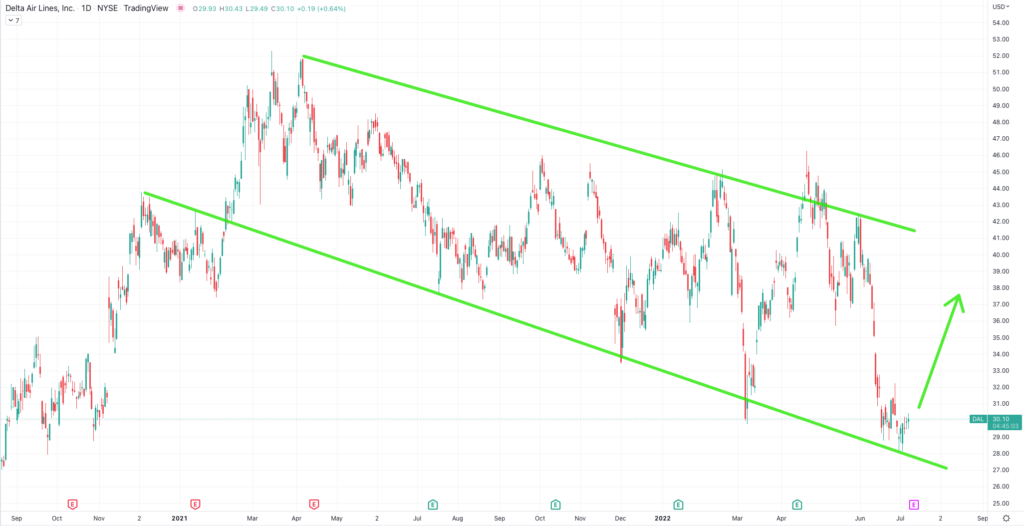
Delta has continued to guide revenue numbers higher each month going into the summer, and we see an opportunity to take a bullish exposure going into earnings. The stock has not performed well, but relative to the JETS airlines ETF, Delta has continued to perform on par with the airline industry. While trading with a multiple under 5 times next year’s earnings, Delta airlines looks extremely inexpensive. Especially if we consider that Delta will generate the same amount of revenue in 2022 as it did in 2019, a massive turnaround, coupled with 100% EPS growth that is expected in 2023.
With the elevated implied volatility and risk of taking exposure going into earnings, we reduce our exposure by using an OTM Debit spread. Buying the Aug 19 $30/35 Call Vertical @ $1.59 Debit.
DAL Daily
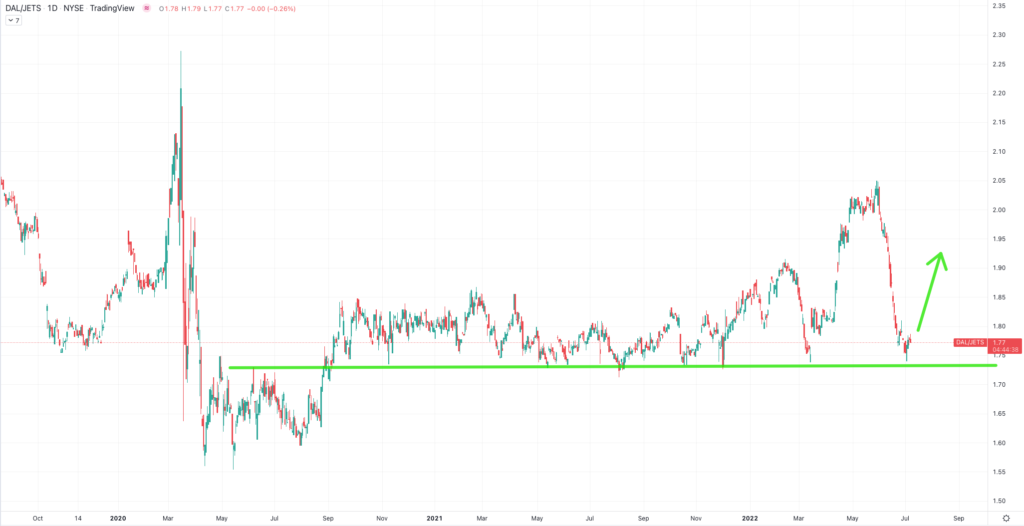
DAL Trading Range
$ACN
ACN Bullish Opening Trade Signal
Strategy Details
Strategy: Short Put Vertical Spread – Bullish
Details: Sell to Open 3 Contracts July 29, 2022 $280/$270 Put Verticals @ $3.80 Credit.
Total Risk: This trade has a max risk of $1,860 (3 Contracts x $620 per contract).
Counter Trend Signal: This is a Bullish trade on a stock that is experiencing a bearish trend.
1M/6M Trends: Bearish/Bearish
Technical Score: 3/10
OptionsPlay Score: 108
Entering the Trade
Use the following details to enter the trade on your trading platform. Please note that if there is a multi-leg option strategy, it should be entered as a single trade.

Investment Rationale
With a possible triple-bottom trading low in place in Accenture (ACN) near $270, we’re going to look to enter a short July 29th $280/$270 put spread today for no less than the $3.80 that it closed at yesterday (based on 4 pm ET mid-prices). That’s 38% of the spread differential.
Its quarterly earnings come out on the 28th, so we will be out of it before that release. New 2022 lows would have me sell no less than half right then and there, too.
ACN – Daily


DailyPlay Updates – July 7, 2022
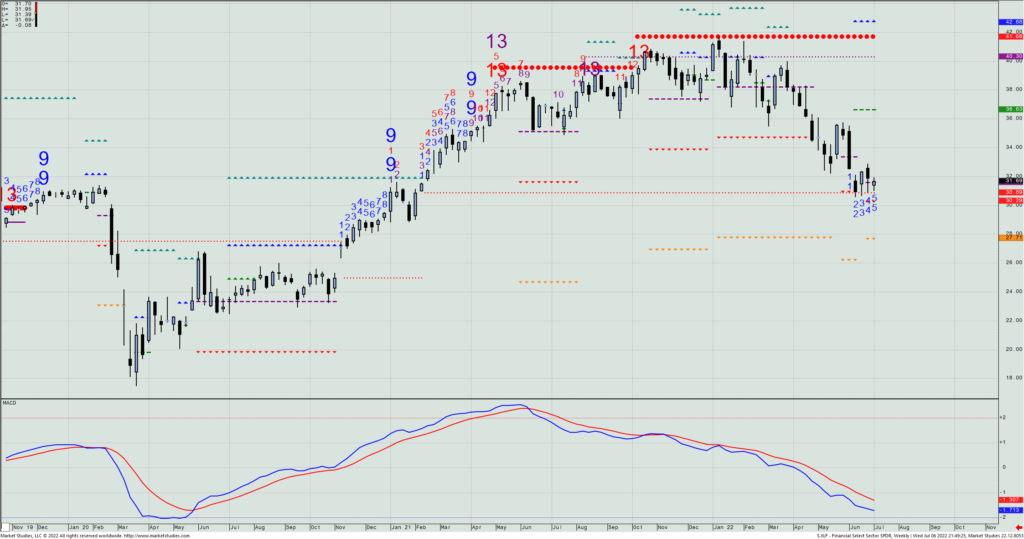
Financials have not only stalled in relative terms to the SPX, but they’ve simply stalled in in absolute terms for the last month – four weeks in a row bottoming at the weekly TDST level of $30.89.
Given that layout – and knowing if they have a Friday close under $30 that I wouldn’t then still want to be long – let’s look to sell a July 29 $31.5/$30 put vertical spread for last night’s mid-closing price of $0.46.
I’ll recommend doing this in a half-sized trade (i.e., using a theoretical $50K size account). We’re collecting just over 30% of the strike differential.
XLF – Weekly
Lastly, as I am shortly ending my weekly webinar affiliation with Stockcharts, and I have already started my own In the Know Trader YouTube channel, where I will regularly continue to record my weekly educational seminars along with doing a select sector and stock-by-stock component analysis should enough people follow and watch the channel. Here’s the link to follow it: https://bit.ly/3zUjzT0
I regularly get about 1000 views per week, so if I can get to nearly 500 followers by Labor Day, I will continue doing these shows for those of you who want to keep learning the ways that professional money managers and traders approach markets.
– Rick Bensignor
Chief Market Strategist
$XOP
DailyPlay Update – Opening Trade (XOP) – Partial Closing Trade (GLD) Closing Trade (COPX) – July 6, 2022
Partial Closing Trade
- GLD – 87.57% Loss: Sell to Close 5 Contracts July 15, 2022 $171/$176Call Verticals @ $0.23 Credit. DailyPlay Portfolio: By Closing 5 of the 10 Contracts, we will be receiving $115.
Closing Trade
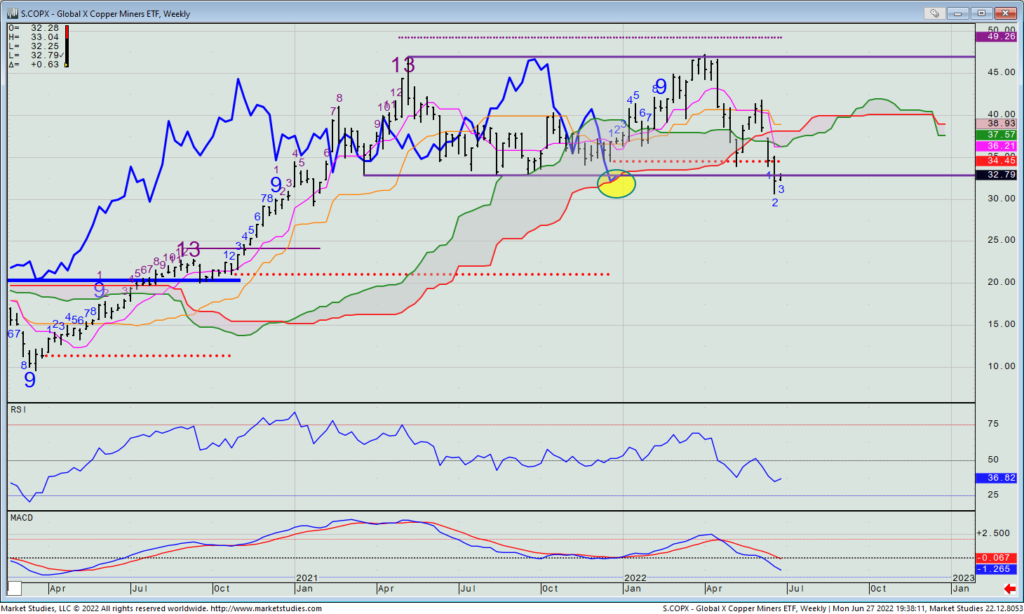
- COPX – 83.87% Gain: Buy to Close 3 Contracts July 15, 2022 $31/$35 Call Verticals @ $0.15 Debit. DailyPlay Portfolio: By Closing the remaining 3 of the Contracts, we will be paying $45. We took partial profits for this trade on June 28 at a $1.75 Debit. Therefore, the average gain on this trade was -4.3% and the average cost basis to exit this trade is $0.95 Debit.
Bearish Opening Trade Signal
Strategy Details
Strategy: Short Call Vertical Spread
Direction: Bearish
Details: Sell to Open 2 Contracts July 29, 2022 $125/$135 Call Verticals @ $1.89 Credit.
Total Risk: This trade has a max risk of $1,622 (2 Contracts x $811 per contract).
Trend Continuation Signal: This is a Bearish trade on an ETF that is experiencing a bearish trend.
1M/6M Trends: Bearish/Bearish
Technical Score: 9/10
OptionsPlay Score: 111
Entering the Trade
Use the following details to enter the trade on your trading platform. Please note that if there is a multi-leg option strategy, it should be entered as a single trade.
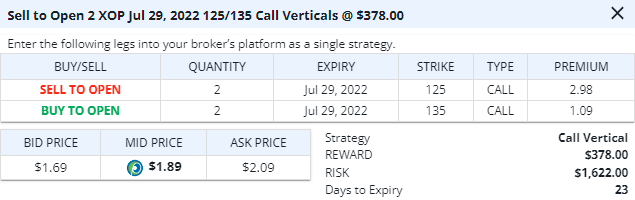
Note that this is a conditional trade and that you will be notified by email when we are entering this trade. The condition for entering this trade is a short rally from the current price of the underlying stock. We suggest that you place a limit order of around $3.50 for now for this trade. Also, keep in mind that the risk for this trade will be reduced when we enter this trade.
Investment Rationale
What a whacky day yesterday, with early significant weakness ultimately leading to gains in the SPX and Nasdaq while the Dow closed lower. Energy got dismantled by losing 4% as oil got crushed, but Tech and Communication Services closed in the black as falling rates are now benefitting the very sectors that higher rates recently hurt.
GLD – Weekly
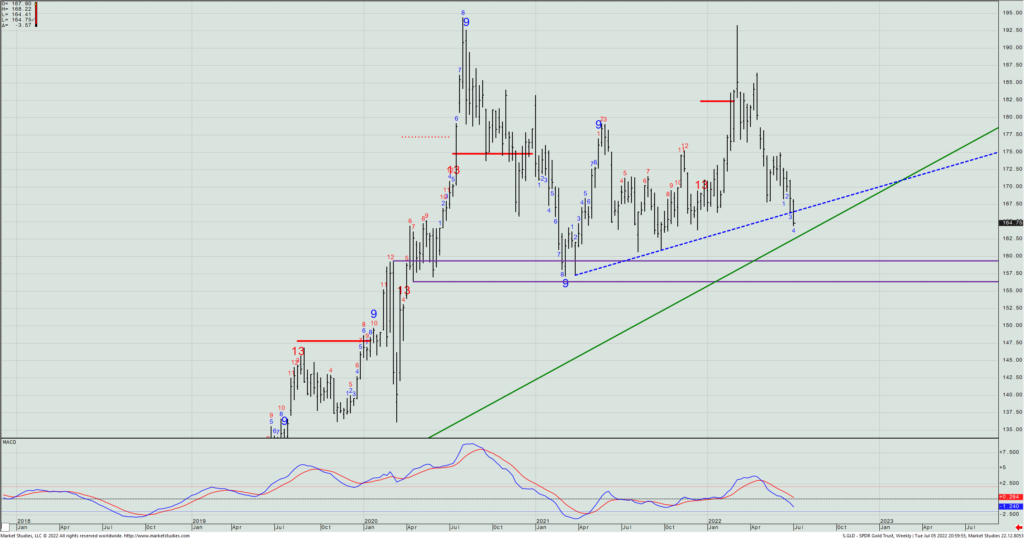
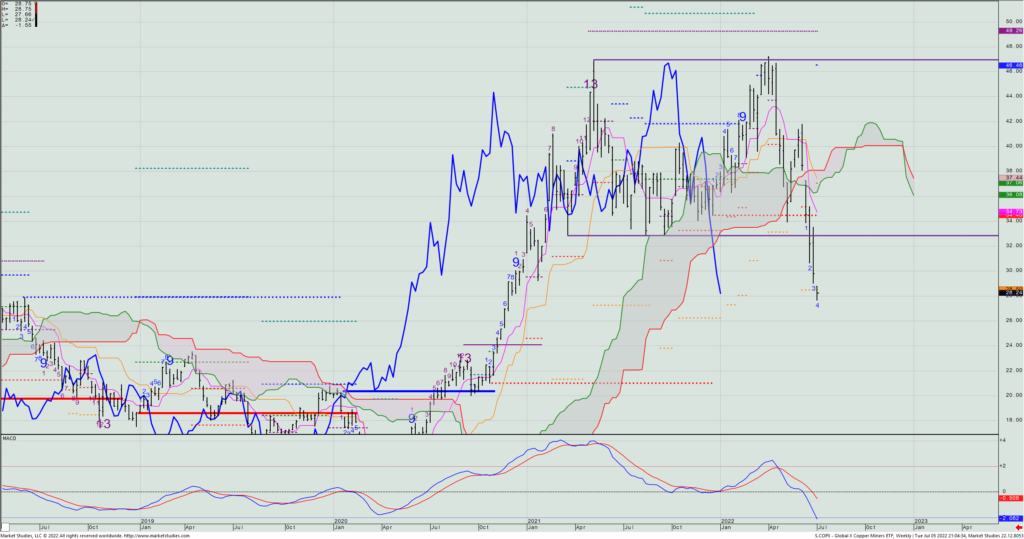
Our short copper trade – via having sold a July 15th COPX $31/$35 call spread – yesterday reached its weekly Propulsion Full Exhaustion level. As such, we will cover the balance of our short position today (and look to again sell this on an upcoming rally).
COPX – Weekly
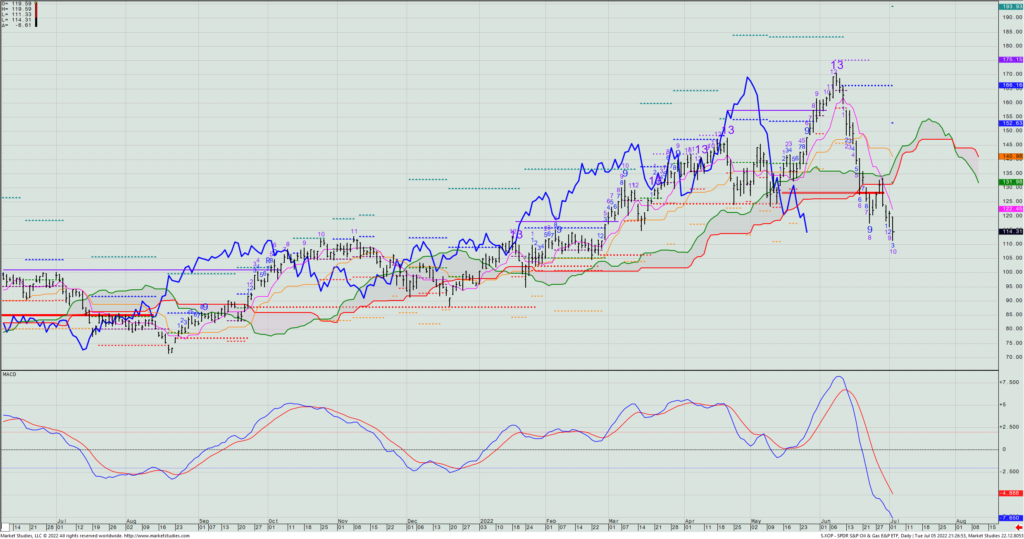
And here’s a new idea, but a conditional one based upon my wanting to see a rally before I’d want to get short. Let’s look at the XOP, which clearly broke its cloud bullish structure over the past few days. With it now deeply oversold, I don’t want to first short it now, but if any day over the balance of the week we see a move back up to $125 to $126, I’d then look to short the July 29th $125/$135 put spread for whatever its mid prices are at the time.
XOP – Daily
$TAN
DailyPlay – Opening Trade (TAN) – July 5, 2022
Bullish Opening Trade Signal
Strategy Details
Strategy: Short Put Vertical Spread
Direction: Bullish
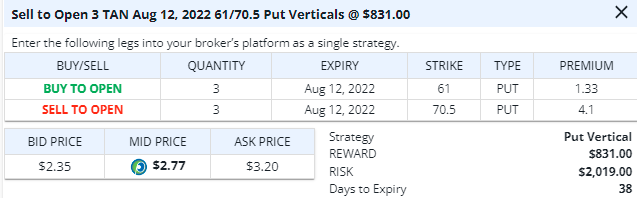
Details: Sell to Open 3 Contracts Aug 5, 2022 $70.50/$61 Put Verticals @ $2.77 Credit.
Total Risk: This trade has a max risk of $2,019 (3 Contracts x $673 per contract).
Trend Continuation Signal: This is a Bullish trade on an ETF that is experiencing a sideways to a bullish trend.
1M/6M Trends: Neutral/Mildly Bullish
Technical Score: 8/10
OptionsPlay Score: 85
Entering the Trade
Use the following details to enter the trade on your trading platform. Please note that if there is a multi-leg option strategy, it should be entered as a single trade.
Please note these prices are based on the previous day’s closing prices. Should the underlying move significantly during the pre-market hours, we will likely adjust the strikes and prices to reflect a more accurate trade entry. This will be reflected in the Portfolio tab within the OptionsPlay platform.
Investment Rationale
We witnessed a double-bottom formation on TAN around the $57 area, which is 55% of its peak its previous highs. What this could indicate is that the decline in energy stocks is coming to an end and that an opportunity is arising. As TAN has shown some break-outs to the upside from this level, we could expect a continuation of this pattern and continued bullish momentum. With Implied Volatility being relatively high, we will be taking advantage of this EFT by placing a bullish credit spread trade.
DailyPlay Update – July 1, 2022
As we head into the 3-day holiday weekend, we’re continually getting the sense that this year’s prior message (i.e., sell rallies) has not really changed. The SPX has given back over half of what its gain had been from the 2022 low, and I’m still in the camp that Friday closes beneath 3617 (the more of them the worse) likely leads to another 10%+ decline in the market.
I don’t want to completely write off that the 3673/3617 zone has thus held – and that the latter was my published downside target for this move a few months ago. But barring a sudden change of events – either by the Fed (doubtful), interest rates moving substantially lower (very doubtful; or a peace agreement in the Russia/Ukraine war (very, very doubtful) – I’m just not convinced that the market has yet priced in all of the bad news that can still come.
A while ago, I wrote that downward earnings revisions were not yet priced into the market, and that we’d likely still see overall selling pressure. That selling is still evident, except, now everyone else is talking about the downward earnings revisions. That’s no longer the story I want to go with, as I like being ahead of the curve and not being with the masses.
I’ve looked back over the entire 100+ year history I have for the SPX, and it has never closed out a year on the low of the year (the way we’ve often seen the highs of the year come the last week of the year). Maybe this year is the first on record? Certainly, no one is talking about that, as most are looking for a Q3 or Q4 rally. Heck: I don’t’ know. But maybe this whole year just keeps drifting lower and never gets a lasting recovery that actually holds. I’m just saying….
With the holiday weekend upon us, I am not going to put a new position on today. I expect trading to be thin, and also with it being both the first of the month (big employment report out) plus funds rebalancing for new quarter and half, I am very content to be in “Summer Friday mode” and just let things play out.
– Rick Bensignor
Chief Market Strategist
$CLX
DailyPlay – Opening Trade (XLC) – June 30, 2022
Bearish Opening Trade Signal
Strategy Details
Strategy: Short Call Vertical Spread
Direction: Bearish
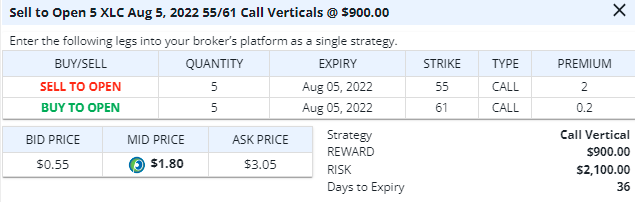
Details: Sell to Open 5 Contracts Aug 5, 2022 $55/$61 Call Verticals @ $1.80 Credit.
Total Risk: This trade has a max risk of $2,100 (5 Contracts x $420 per contract).
Trend Continuation Signal: This is a Bearish trade on an ETF that is experiencing a bearish trend.
1M/6M Trends: Bearish/Bearish
Technical Score: 3/10
OptionsPlay Score: 98
Entering the Trade
Use the following details to enter the trade on your trading platform. Please note that if there is a multi-leg option strategy, it should be entered as a single trade.
Please note these prices are based on the previous day’s closing prices. Should the underlying move significantly during the pre-market hours, we will likely adjust the strikes and prices to reflect a more accurate trade entry. This will be reflected in the Portfolio tab within the OptionsPlay platform.
Investment Rationale
One thing I notice that is very much contributing to some of the large and seemingly unexplained intraday moves in the equity markets is that liquidity has dramatically dropped from when stocks were in bull mode (like they were for all of 2021). It’s easiest to see this in the S&P futures, where what were “standard” size bids and offers were often multiple hundreds of contracts at every single tick. Nowadays, we’re seeing dozens (or even smaller amounts) as the norm, and it accounts for why we constantly see 5-minute 20-point moves. There’s just nothing there to absorb any real size order.
I’m fairly sure that the bulk of the trading done is now even more so by computer vs. computer, and that much of the public and institutional community has greatly diminished their daily participation – more so managing overall portfolio construction and far less so trading for short-term moves. And virtually everyone I talk to is telling me the same thing: “You can’t beat this game right now, so I’m not even gonna try”. I hear something like that a few times a day.
Which leads me to today’s Daily Play – an idea that’s more so about playing the overall downward trend of this security, and less so about trying to guess the day-to-day movement. Let’s look at the chart of the Communication Services SPDR ETF (XLC). Its biggest components are META and GOOG/GOOGL, and combined they comprise 40% of this ETF. We see that on its entire move down from all-time highs some 14 months ago, it has yet to even make a weekly Setup -9 count, let alone a more terminal -13 count. I’m apt to think it won’t make its true bottom without at least doing the former, and with it already trading under its 62% Fibonacci retracement, it might finally do one over the next five weeks.
XLC – Weekly
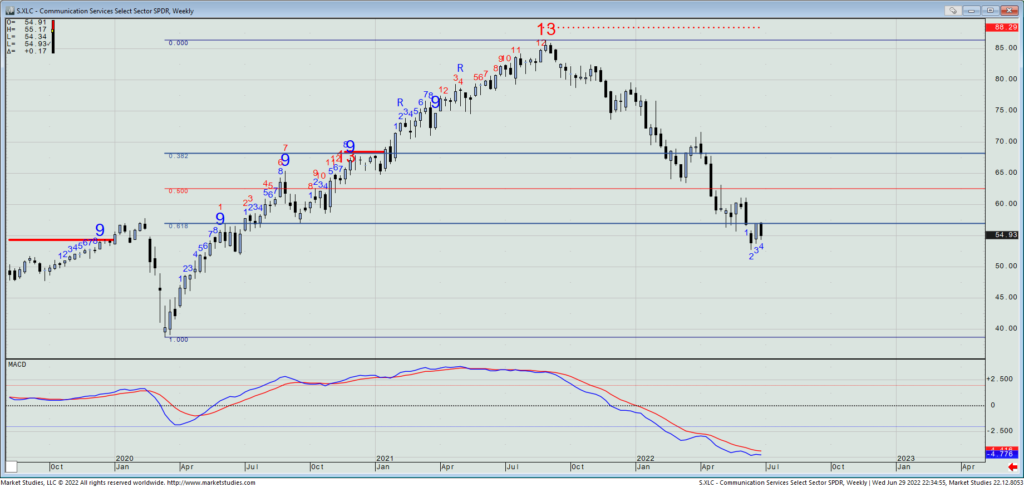
As such, let’s look to sell an August 5th $55/$61 call spread, which closed yesterday at $1.825 mid. (I’m using the $61 strike because that is the high of Setup bar -1, which in theory would be where the TDST Line resistance would be at if this completes the current downward count in early August.) We’d be collecting about 30% of the spread differential, and the spread expires in 37 days, in line with the potential for another 5 weeks of mostly negative price action to reach the Setup -9.
DailyPlay Update – June 29, 2022
Yesterday was the cold, slap-in-the-face day that we know can come anytime. And it stung. The early strength seen in the lessening of Chinese Covid restrictions quickly disappeared into the ongoing story of rising oil prices, recession, and inflationary pressures – yada yada yada. The SPX got whacked for 2% on the day, closing 124 points off its intraday high. That doubly hurt, for not only did yesterday’s new BIIB bullish call spread collapse after we put in on, but copper also came off after an opening gap higher to then close down on the day (after we covered half early in the session).
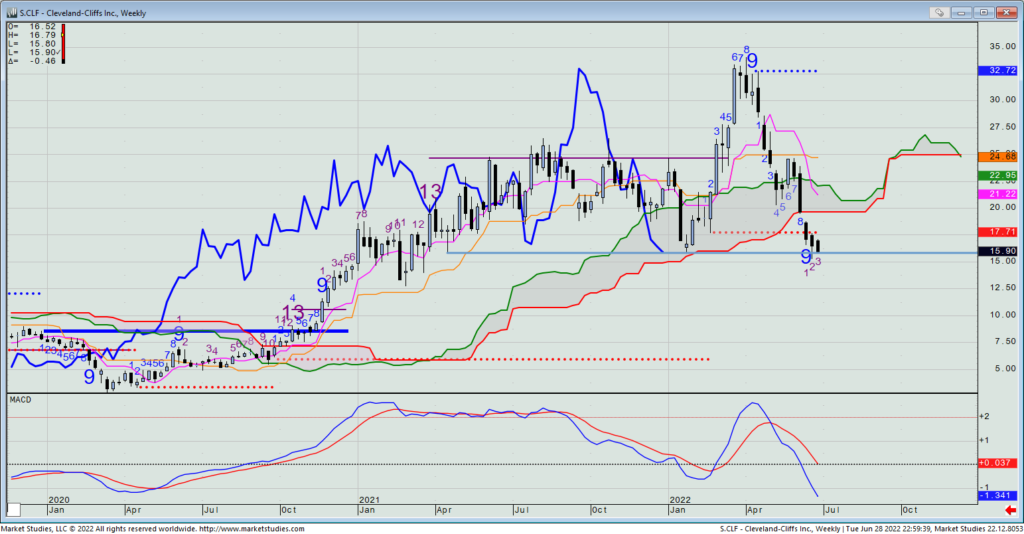
For today, let’s look at the July 1 CLF $18/$21 call spread we put on two weeks back. We never got positive traction on this trade, and with it expiring on Friday I have the choice to simply exit it; roll it down to lower strikes, or let it expire worthless. Frankly, I’m apt for the latter, simply because it’s unclear to me if this is going to hold against support that it’s on right now; trade lower to where its weekly Lagging Line (in bold blue) hits its cloud bottom ($14.85 to $14.96 over the next few weeks) and then see if that holds; or just even heads lower than that. (We’re down 99% on the trade so selling it out now doesn’t pay.)
CLF – Weekly
Trading will likely thin out as the week goes on and we head into the 3-day holiday weekend. It’s not too late to still cull your investment holdings of non-performing names to raise cash for better buying opportunities likely to come later this summer and fall.
$BIIB
DailyPlay – Opening Trade (BIIB) – Partial Closing Trade (COPX) – June 28, 2022
Bullish Opening Trade Signal
Strategy Details
Strategy: Long Call Vertical Spread
Direction: Bullish
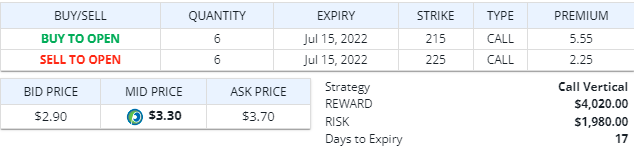
Details: Buy to Open 6 Contracts July 15, 2022 $215/$225 Call Verticals @ $3.30 Debit.
Total Risk: This trade has a max risk of $1,980 (6 Contracts x $330 per contract).
Trend Continuation Signal: This is a Bullish trade on a stock that is experiencing a bullish trend.
1M/6M Trends: Bullish/Neutral
Technical Score: 8/10
OptionsPlay Score: 109
Entering the Trade
Use the following details to enter the trade on your trading platform. Please note that if there is a multi-leg option strategy, it should be entered as a single trade.
Please note these prices are based on the previous day’s closing prices. Should the underlying move significantly during the pre-market hours, we will likely adjust the strikes and prices to reflect a more accurate trade entry. This will be reflected in the Portfolio tab within the OptionsPlay platform.
Investment Rationale
Health Care has been one of my pure Over Weights this year in my In The Know Trader’s monthly 7:11 report. In fact, I put it in the portfolio on Dec. 1st last year after having not been in the sector since its inception in August 2020. This year, it is already outpacing the SPY by 10.3%.
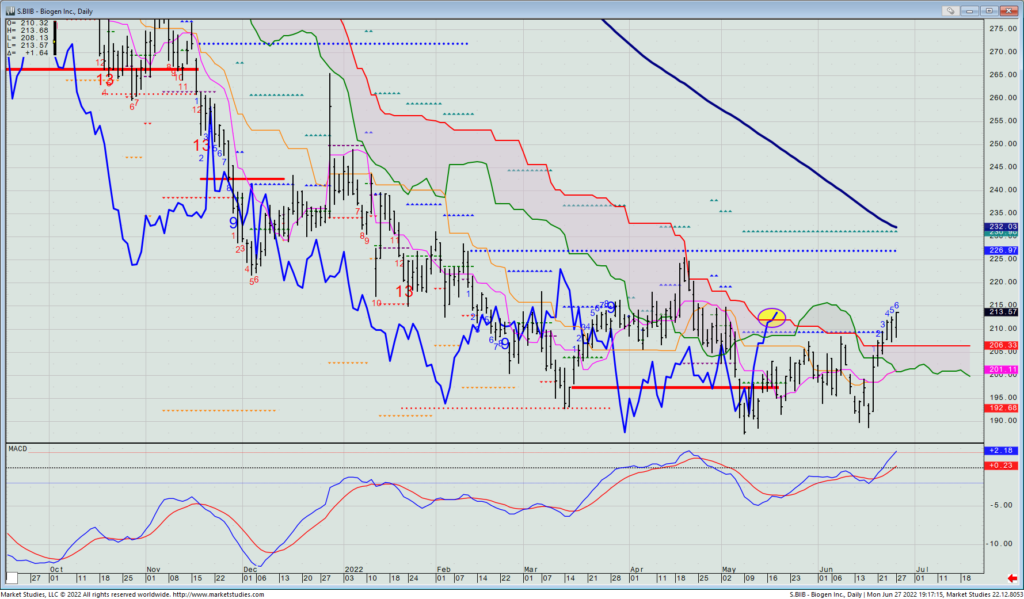
Within the Health Care sector is biotechnology, and one of that group’s best-known names is Biogen (BIIB). And BIIB did something yesterday it has not done even once since the June 2021 peak in price: its daily cloud’s Lagging Line broke above the top of its cloud. That is deemed a bullish breakout in cloud chart terms, and as such, we will look to buy a short-dated July 15th $215/$225 call spread. It closed yesterday at $3.25 mid, meaning that we’ll be laying out about 33% of the spread differential.
BIIB – Daily
Secondly, to best manage risk, I want to revisit a very recent Daily Play short recommendation in COPX. We are short a July 15th $31/$35 call spread from last week when copper broke down to new 17-month lows while also having its Lagging Line break its cloud. However, by last Friday’s close, copper rallied enough to just keep the Lagging Line in its cloud, and thus, this chart really didn’t break down. As such, I’d rather cover half now than run the risk that it doesn’t break at all. If it does, we still have half on. But if not, we’ve reduced the chances for a full loss.
COPX – Weekly
Partial Closing Trade
- COPX – 88.17% Loss: Buy to Close 3 Contracts July 15, 2022 $31/$35 Call Verticals @ $1.75 Debit. DailyPlay Portfolio: By Closing 3 of the 6 Contracts, we will be paying $525.