
RMBS, ORCL, GM

OptionsPlay DailyPlay Ideas Menu – May 5th, 2026
💰 The Income Generators (High Probability, Cash Flow)
- RMBS: Bullish Put Spread capitalizing on a post-earnings pullback in a structurally critical AI memory and silicon IP leader.
🚀 The Growth Seekers (Higher Risk, Max Reward)
- ORCL: Bullish Call Spread targeting upside expansion as cloud infrastructure demand and aggressive AI backlogs drive the stock to new highs.
🛡️ The Portfolio Protectors (Hedges & Bearish Bets)
- GM: Bearish Call Spread fading auto industry relative weakness, driven by consumer headwinds and margin compression.
1. RMBS ($111.50) – Buying the Silicon Dip

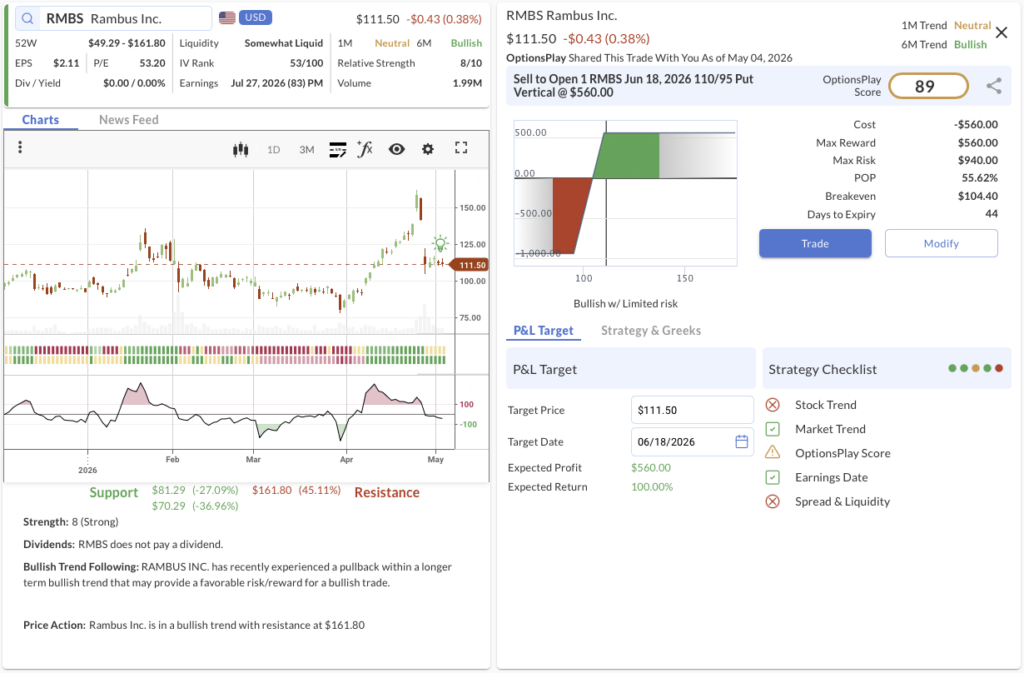
- We’re betting on: If Rambus finds its footing after a post-earnings shakeout, the secular tailwinds of DDR5 and AI memory architecture will drive the stock higher and keep it above our $110 strike through mid-June.
- The Trade: Sell to Open the RMBS Jun 18, 2026 110/95 Put Vertical @ $5.60 Credit.
- 🟢 BUY TO OPEN Jun 18, 2026 95 Put @ $3.85
- 🔴 SELL TO OPEN Jun 18, 2026 110 Put @ $9.45
- Trade Metrics: POP: 55.63% | Collect $560.00 per contract vs. a Max Risk of $940.00 (1.7:1).
- The Setup: Rambus recently pulled back substantially on earnings, presenting a rare and compelling buy-the-dip opportunity in the semiconductor space. Despite near-term volatility, RMBS’s core growth drivers—specifically DDR5 memory interface chips and CXL (Compute Express Link) technology—are critical bottlenecks for next-generation AI data centers. As AI workloads demand exponentially higher memory bandwidth, Rambus’s silicon IP is indispensable. This technical pullback to the $111 support zone provides a highly favorable risk/reward entry to sell premium against a structurally critical semiconductor name.
- Management:
- Stop Loss: Buy back the spread at $11.20 (100% of credit received).
- Take Profit: Buy back the spread at $2.80 (50% of max gain).
2. ORCL ($180.29) – The Hyperscaler Catch-Up

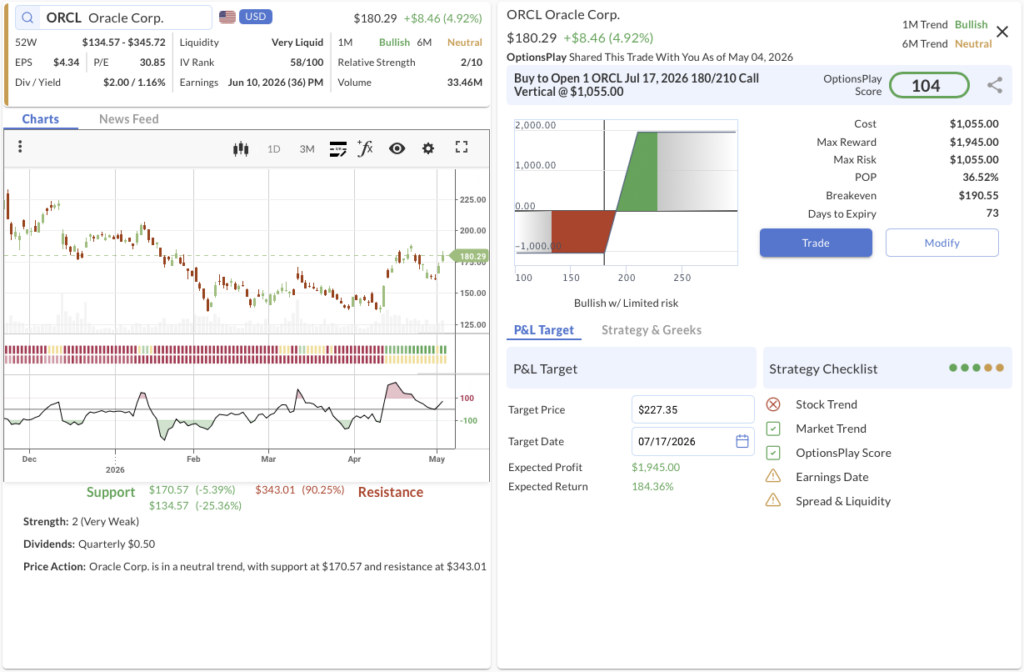
- We’re betting on: If Oracle continues to win massive AI cloud infrastructure contracts and transitions its legacy database customers to the cloud, the stock will trend higher toward our $210 target.
- The Trade: Buy to Open the ORCL Jul 17, 2026 180/210 Call Vertical @ $10.55 Debit.
- 🟢 BUY TO OPEN Jul 17, 2026 180 Call @ $19.98
- 🔴 SELL TO OPEN Jul 17, 2026 210 Call @ $9.43
- Trade Metrics: POP: 36.52% | Pay $1,055.00 per contract vs. a Max Reward of $1,945.00 (1.8:1).
- The Setup: After establishing a position in ORCL on 4/20 that is now in the green, the stock has triggered a fresh buy signal. Oracle is proving that its cloud infrastructure (OCI) can compete directly with the hyperscalers for AI workloads, securing massive GPU clusters and driving exceptional consumption growth. Furthermore, the legacy database business continues its steady transition to the cloud, driving margin expansion. This long call spread allows us to aggressively add exposure to this bullish name as it breaks out and trends toward the $210 target.
- Management:
- ⚠️ Warning: Earnings is scheduled for Jun 10, which may require active management.
- Stop Loss: Sell the spread at $5.27 (50% loss on premium).
- Take Profit: Sell the spread at $18.46 (75% gain on premium).
3. GM ($75.70) – Downshifting Auto Demand

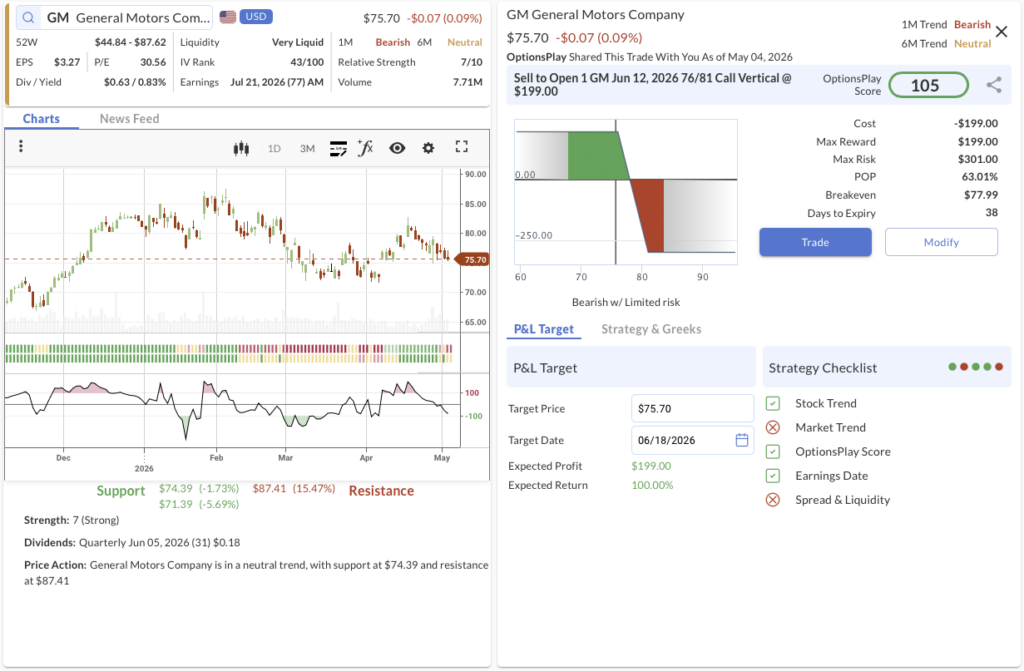
- We’re betting on: If consumer discretionary headwinds, elevated financing rates, and industry-wide pricing pressures persist, GM will face a technical breakdown toward $68, keeping the stock below our short call strike.
- The Trade: Sell to Open the GM Jun 12, 2026 76/81 Call Vertical @ $1.99 Credit.
- 🔴 SELL TO OPEN Jun 12, 2026 76 Call @ $3.18
- 🟢 BUY TO OPEN Jun 12, 2026 81 Call @ $1.19
- Trade Metrics: POP: 63.00% | Collect $199.00 per contract vs. a Max Risk of $301.00 (1.5:1).
- The Setup: General Motors has recently triggered our early underperform scans. The Consumer Discretionary sector is lagging on both weekly and daily timeframes, with the automotive industry specifically showing relative weakness across the board. Fundamentally, elevated interest rates are severely pressuring auto loan affordability, forcing pricing concessions and slowing consumer demand. Meanwhile, EV transition costs and price wars continue to drag on margins. Selling a call spread into this counter-trend rally provides an optimal technical entry to target a move lower toward $68.
- Management:
- Stop Loss: Buy back the spread at $3.98 (100% of credit received).
- Take Profit: Buy back the spread at $0.99 (50% of max gain).
DDOG, NVO, PFE
OptionsPlay DailyPlay Ideas Menu – May 4th, 2026
💰 The Income Generators (High Probability, Cash Flow)
- DDOG: Bullish Put Spread capitalizing on a major technical breakout supported by the end of cloud optimization headwinds and surging AI observability demand.
🚀 The Growth Seekers (Higher Risk, Max Reward)
- NVO: Bullish Call Spread targeting a breakout extension driven by expanding GLP-1 supply capacity and positive pipeline data.
🛡️ The Portfolio Protectors (Hedges & Bearish Bets)
- PFE: Bearish Put Spread hedging against severe relative weakness, pipeline stagnation, and balance sheet constraints following recent acquisitions.
1. DDOG ($140.53) – The Bottoming Breakout

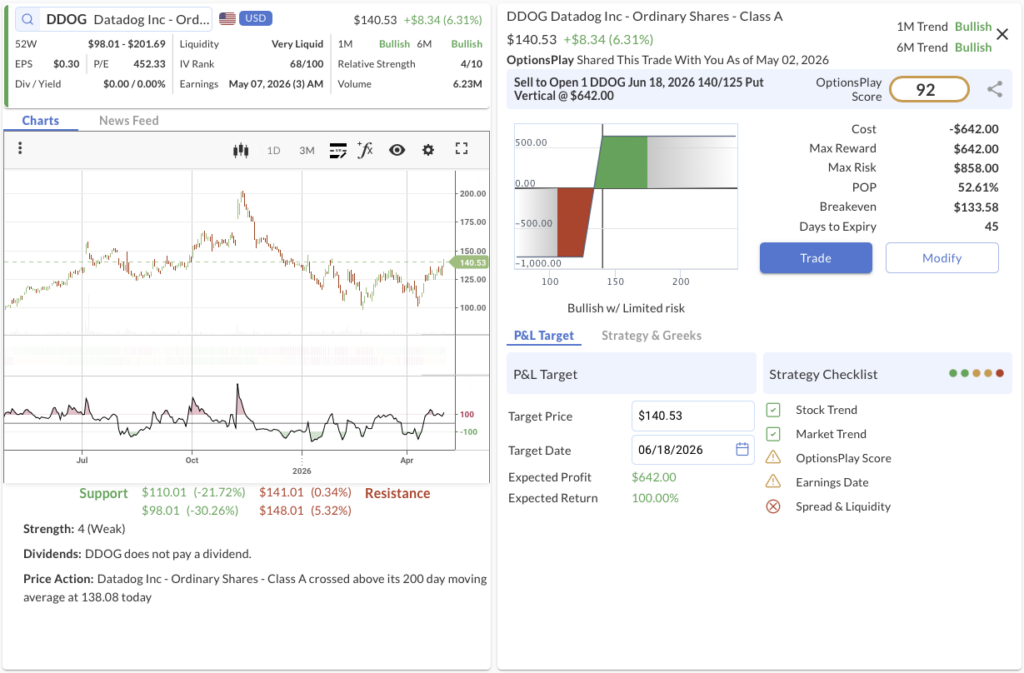
- We’re betting on: If Datadog sustains its momentum after a prolonged consolidation phase, the stock will push toward its $165 target and stay safely above our $140 strike through mid-June.
- The Trade: Sell to Open the DDOG Jun 18, 2026 140/125 Put Vertical @ $6.42 Credit.
- 🟢 BUY TO OPEN Jun 18, 2026 125 Put @ $6.88
- 🔴 SELL TO OPEN Jun 18, 2026 140 Put @ $13.30
- Trade Metrics: POP: 52.64% | Collect $642.00 per contract vs. a Max Risk of $858.00 (1.3:1).
- The Setup: Datadog broke out above $135 after a prolonged 2026 bottoming phase, opening the door toward a $165 target. Fundamentally, “cloud optimization” headwinds have cleared. As enterprise IT budgets aggressively pivot toward AI observability and vendor consolidation, DDOG’s unified platform is perfectly positioned to capture spend. With cloud consumption reaccelerating, this put spread captures premium against a newly established structural floor.
- Management:
- ⚠️ Warning: Earnings is scheduled for May 07, which requires active management.
- Stop Loss: Buy back the spread at $12.84 (100% of credit received).
- Take Profit: Buy back the spread at $3.21 (50% of max gain).
2. NVO ($43.88) – Pushing Past Resistance

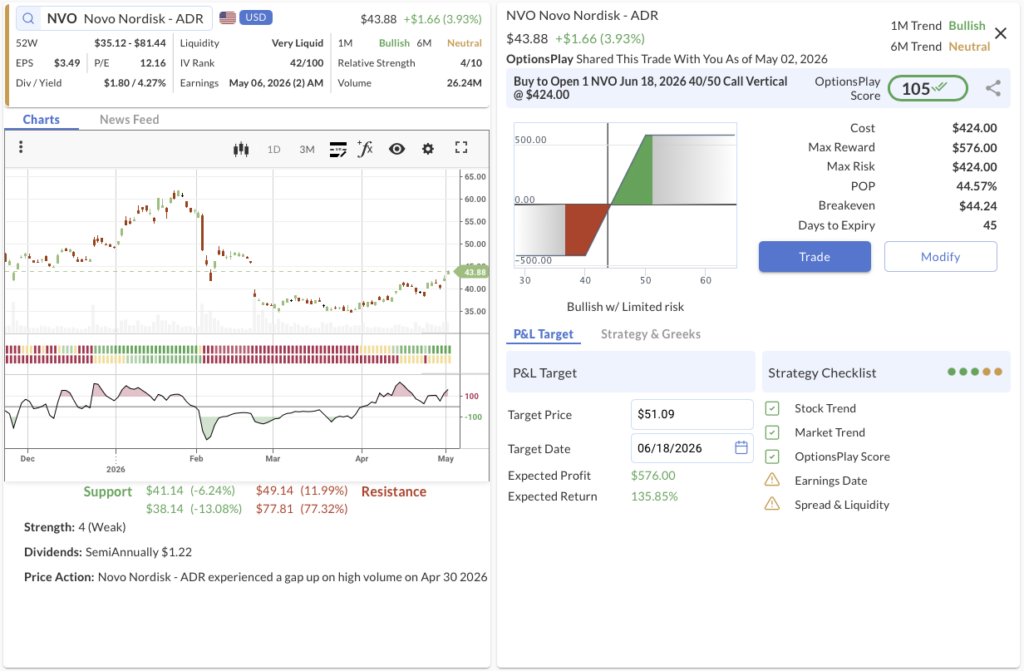
- We’re betting on: If Novo Nordisk accelerates through its breakout on the back of easing supply bottlenecks and robust prescription demand, the stock will surge into our target profit zone.
- The Trade: Buy to Open the NVO Jun 18, 2026 40/50 Call Vertical @ $4.24 Debit.
- 🟢 BUY TO OPEN Jun 18, 2026 40 Call @ $5.30
- 🔴 SELL TO OPEN Jun 18, 2026 50 Call @ $1.06
- Trade Metrics: POP: 44.61% | Pay $424.00 per contract vs. a Max Reward of $576.00 (1.4:1).
- The Setup: NVO is breaking out from a recent bottoming formation near $40 resistance, targeting a move to $49. Fundamentally, a massive inflection in manufacturing capacity is easing revenue bottlenecks for its GLP-1 portfolio. Combined with strong clinical data for its next-generation oral obesity pipeline, institutional buying has reignited. This long call spread offers an excellent risk-to-reward ratio to capture the breakout.
- Management:
- ⚠️ Warning: Earnings is scheduled for May 06, which requires active management.
- Stop Loss: Sell the spread at $2.12 (50% loss on premium).
- Take Profit: Sell the spread at $7.42 (75% gain on premium).
3. PFE ($26.33) – Fading the Weakness

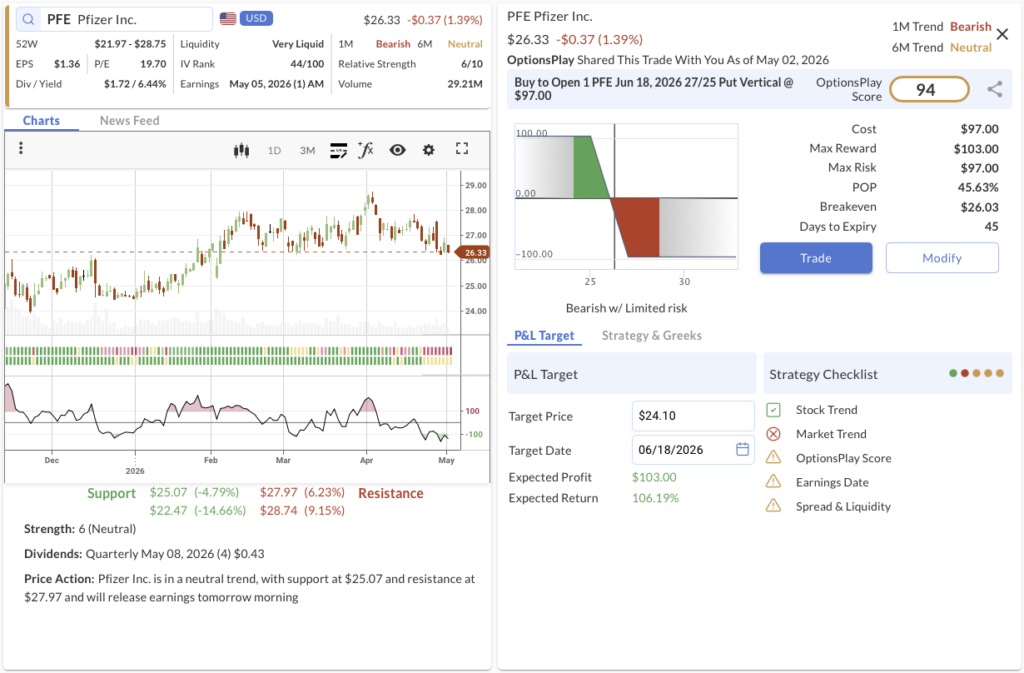
- We’re betting on: If Pfizer continues to bleed relative strength amid pipeline stagnation and margin compression, it will fail to hold structural support and flush lower towards $24.50.
- The Trade: Buy to Open the PFE Jun 18, 2026 27/25 Put Vertical @ $0.97 Debit.
- 🔴 SELL TO OPEN Jun 18, 2026 25 Put @ $0.49
- 🟢 BUY TO OPEN Jun 18, 2026 27 Put @ $1.46
- Trade Metrics: POP: 45.55% | Pay $97.00 per contract vs. a Max Reward of $103.00 (1.1:1).
- The Setup: Pfizer has tested $26 support for three months, and its poor relative strength signals a high-probability breakdown toward $24.50. Fundamentally, the company is struggling to replace its post-COVID revenue cliff. A heavily leveraged balance sheet from the Seagen acquisition severely limits buybacks and M&A, while recent clinical updates lag competitors in the obesity space. This put spread capitalizes on the lack of near-term growth catalysts.
- Management:
- ⚠️ Warning: Earnings is scheduled for May 05, which requires active management.
- Stop Loss: Sell the spread at $0.48 (50% loss on premium).
- Take Profit: Sell the spread at $1.70 (75% gain on premium).
AVGO, SHEL, TER
OptionsPlay DailyPlay Ideas Menu – May 1st, 2026
💰 The Income Generators (High Probability, Cash Flow)
- AVGO: Bullish Put Spread rolling into June as semiconductors rotate back into outperformance following Mag 4 results.
- SHEL: Bullish Put Spread leveraging elevated oil prices driven by geopolitical tensions and Washington’s blockade pressures.
🚀 The Growth Seekers (Higher Risk, Max Reward)
- TER: Bullish Call Spread capitalizing on a recent pullback to seek aggressive upside in a proven semiconductor winner.
🛡️ The Portfolio Protectors (Hedges & Bearish Bets)
- (No trades in this category today)
1. AVGO ($417.43) – The Semiconductor Rotation

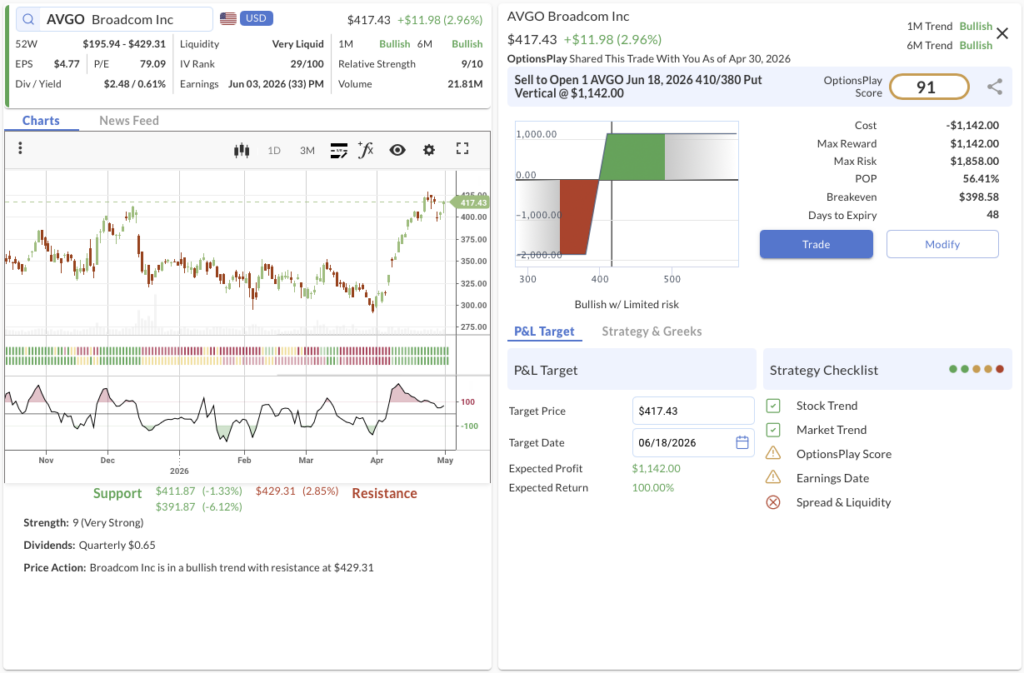
- We’re betting on: If Broadcom maintains its structural support as the broader semiconductor sector resumes its leadership, the stock will stay safely above our $410 strike through mid-June.
- The Trade: Sell to Open the AVGO Jun 18, 2026 410/380 Put Vertical @ $11.42 Credit.
- 🟢 BUY TO OPEN Jun 18, 2026 380 Put @ $14.00
- 🔴 SELL TO OPEN Jun 18, 2026 410 Put @ $25.42
- Trade Metrics: POP: 56.42% | Collect $1,142.00 per contract vs. a Max Risk of $1,858.00 (1.6:1).
- The Setup: This is a roll of a highly successful trade from a few weeks ago that is now up 75%. We are rolling this into the June put spread as semis rotate back into outperformance. Yesterday’s Mag 4 results definitively confirmed the growth needed to support massive capital expenditure across the AI infrastructure industry, providing a powerful fundamental tailwind for Broadcom.
- Management:
- ⚠️ Warning: Earnings is scheduled for Jun 03, which may require active management.
- Stop Loss: Buy back the spread at $22.84 (100% of credit received).
- Take Profit: Buy back the spread at $5.71 (50% of max gain).
2. SHEL ($90.67) – The Energy Floor

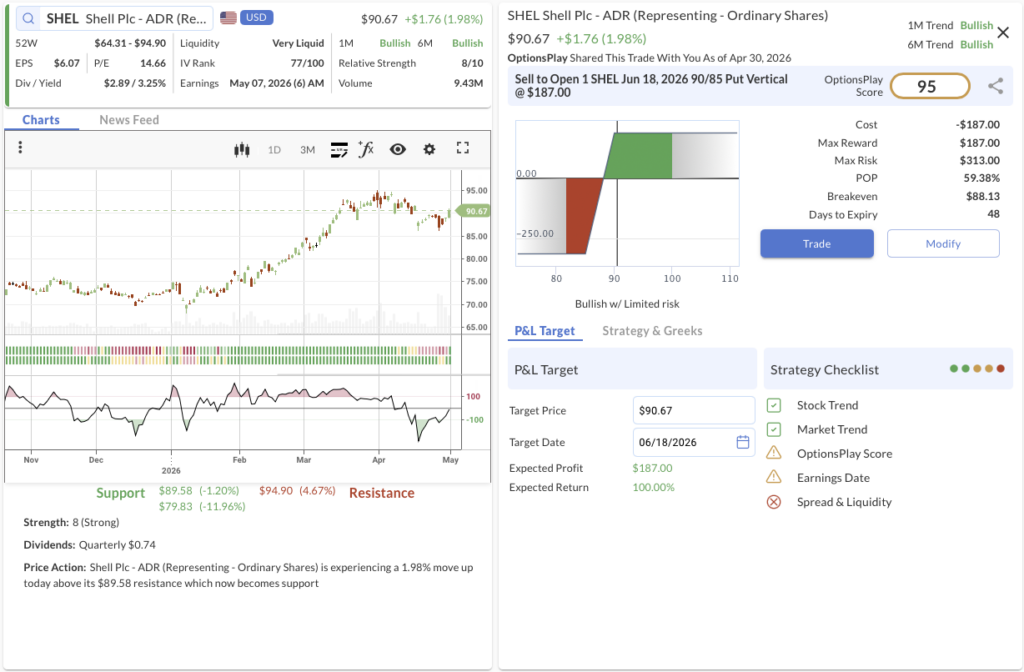
- We’re betting on: If geopolitical gridlock and economic blockades continue to place a floor under global crude markets, Shell will maintain its bullish trajectory above our $90 strike.
- The Trade: Sell to Open the SHEL Jun 18, 2026 90/85 Put Vertical @ $1.87 Credit.
- 🟢 BUY TO OPEN Jun 18, 2026 85 Put @ $1.63
- 🔴 SELL TO OPEN Jun 18, 2026 90 Put @ $3.50
- Trade Metrics: POP: 59.39% | Collect $187.00 per contract vs. a Max Risk of $313.00 (1.7:1).
- The Setup: We are initiating this position on the back of our continued view that oil prices will stay elevated. As Iran digs in and Washington seeks maximum economic pressure via the blockade, top-tier energy producers like Shell remain highly insulated. Technically, the stock is showing robust Relative Strength (8/10) and operating within a confirmed multi-timeframe Bullish Trend.
- Management:
- ⚠️ Warning: Earnings is scheduled for May 07, which may require active management.
- Stop Loss: Buy back the spread at $3.74 (100% of credit received).
- Take Profit: Buy back the spread at $0.93 (50% of max gain).
3. TER ($343.47) – Seeking Hardware Upside

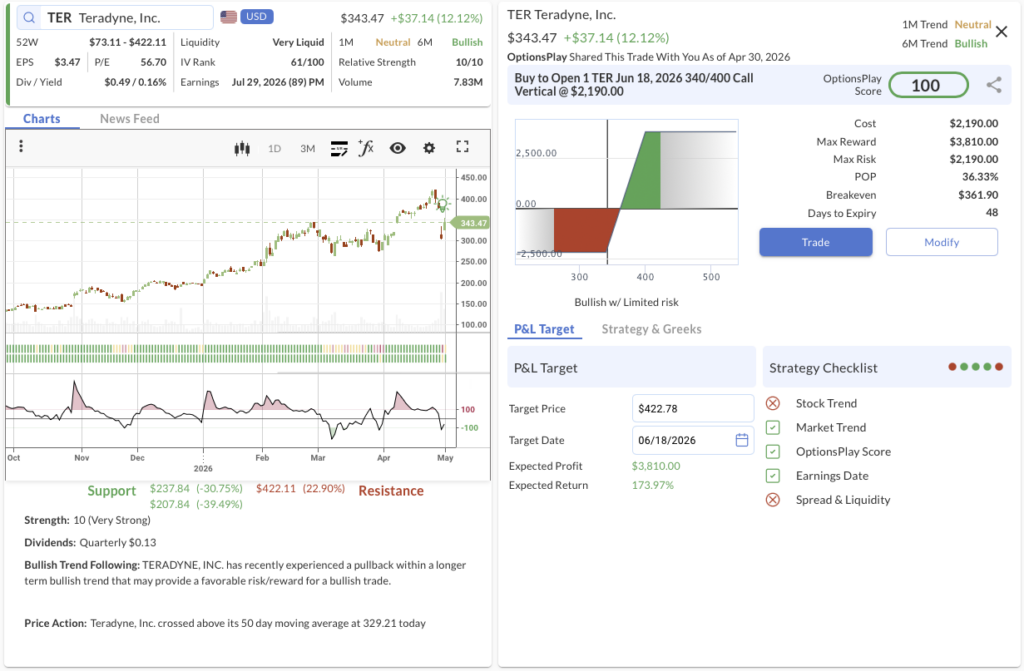
- We’re betting on: If Teradyne continues to ride the renewed relative strength in the semiconductor complex, a powerful upside breakout will push the stock deep into our target profit zone.
- The Trade: Buy to Open the TER Jun 18, 2026 340/400 Call Vertical @ $21.90 Debit.
- 🟢 BUY TO OPEN Jun 18, 2026 340 Call @ $35.55
- 🔴 SELL TO OPEN Jun 18, 2026 400 Call @ $13.65
- Trade Metrics: POP: 36.33% | Pay $2,190.00 per contract vs. a Max Reward of $3,810.00 (1.7:1).
- The Setup: Teradyne was a trade from April 2nd that is up around 75% of max gain. The recent pullback gives us another opportunity to seek further upside as semis are starting to show some relative strength again after taking a breather this week. Transitioning this to a Growth Seeker debit spread allows us to capture maximum upside reward on the breakout.
- Management:
- Stop Loss: Sell the spread at $10.95 (50% loss on premium).
- Take Profit: Sell the spread at $38.32 (75% gain on premium).
MPWR, MU, A
OptionsPlay DailyPlay Ideas Menu – April 30th, 2026
💰 The Income Generators (High Probability, Cash Flow)
- MPWR: Bullish Put Spread – As a leader in power management solutions, Monolithic Power Systems is well-positioned to capitalize on surging AI server infrastructure demand and margin expansion.
- MU: Bullish Put Spread – Micron continues to benefit from robust pricing power and tight supply in the memory market, driven by relentless enterprise and cloud AI data center investments.
🚀 The Growth Seekers (Higher Risk, Max Reward)
- (No trades in this category today)
🛡️ The Portfolio Protectors (Hedges & Bearish Bets)
- A: Bearish Call Spread – Agilent faces potential top-line headwinds and margin compression amid softening biopharma equipment demand and conservative lab spending environments.
1. MPWR ($1,526.84) – Powering the AI Infrastructure Buildout

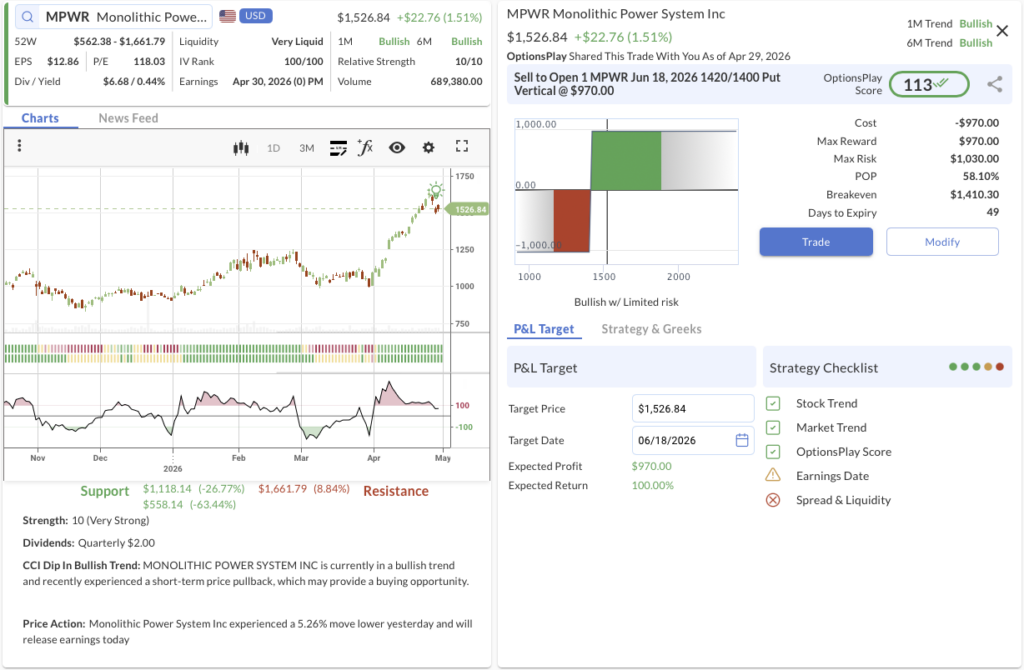
- The Trade: Sell to Open the MPWR Jun 18, 2026 1420/1400 Put Vertical @ $9.70 Credit.
- 🟢 BUY TO OPEN Jun 18, 2026 1400 Put @ $81.85
- 🔴 SELL TO OPEN Jun 18, 2026 1420 Put @ $91.55
- Trade Metrics: POP: 58.10% | Collect $970 per contract vs. a Max Risk of $1,030 (1.06:1).
- The Why: As a leader in power management solutions, Monolithic Power Systems is well-positioned to capitalize on surging AI server infrastructure demand and margin expansion.
- The Technicals: MPWR is in a strong 1M and 6M bullish trend with solid support at $1,118.14, having recently experienced a short-term pullback that provides a compelling entry point for trend continuation.
- Management:
- ⚠️ Warning: Earnings is scheduled for Apr 30, 2026, which may require active management.
- Stop Loss: Buy back the spread at $19.40 (100% of credit received).
- Take Profit: Buy back the spread at $4.85 (50% of max gain).
2. MU ($518.46) – Riding the Memory Market Upswing

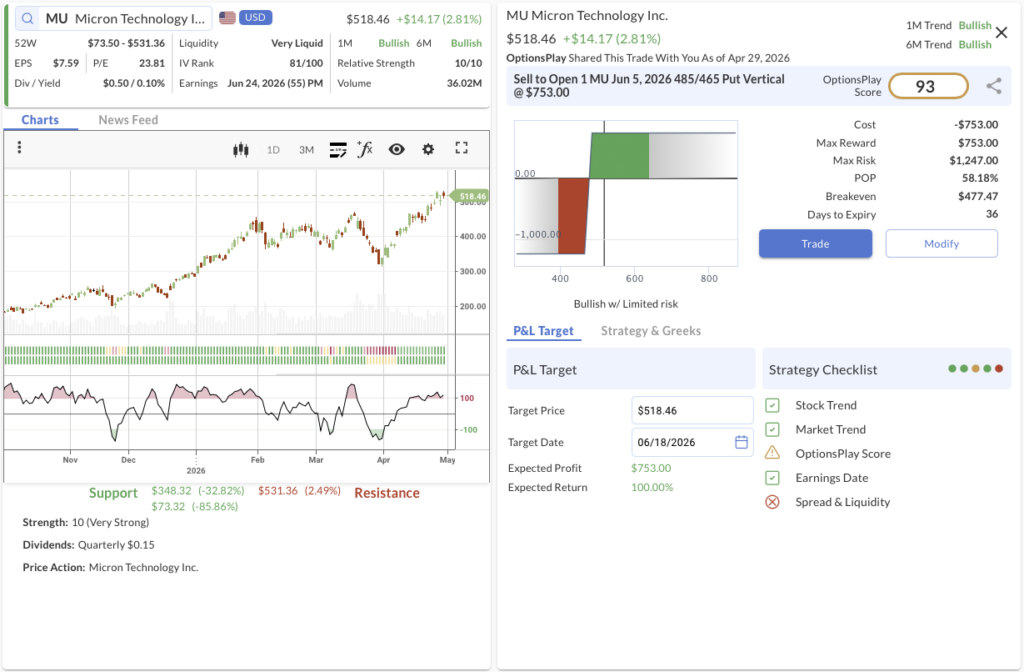
- The Trade: Sell to Open the MU Jun 5, 2026 485/465 Put Vertical @ $7.53 Credit.
- 🟢 BUY TO OPEN Jun 5, 2026 465 Put @ $25.45
- 🔴 SELL TO OPEN Jun 5, 2026 485 Put @ $32.98
- Trade Metrics: POP: 58.18% | Collect $753 per contract vs. a Max Risk of $1,247 (1.66:1).
- The Why: Micron continues to benefit from robust pricing power and tight supply in the memory market, driven by relentless enterprise and cloud AI data center investments.
- The Technicals: MU maintains a steady 1M and 6M bullish trajectory, rebounding from recent consolidation to push toward new highs with established support at $348.32.
- Management:
- Stop Loss: Buy back the spread at $15.06 (100% of credit received).
- Take Profit: Buy back the spread at $3.76 (50% of max gain).
3. A ($111.30) – Softening Biopharma Equipment Demand

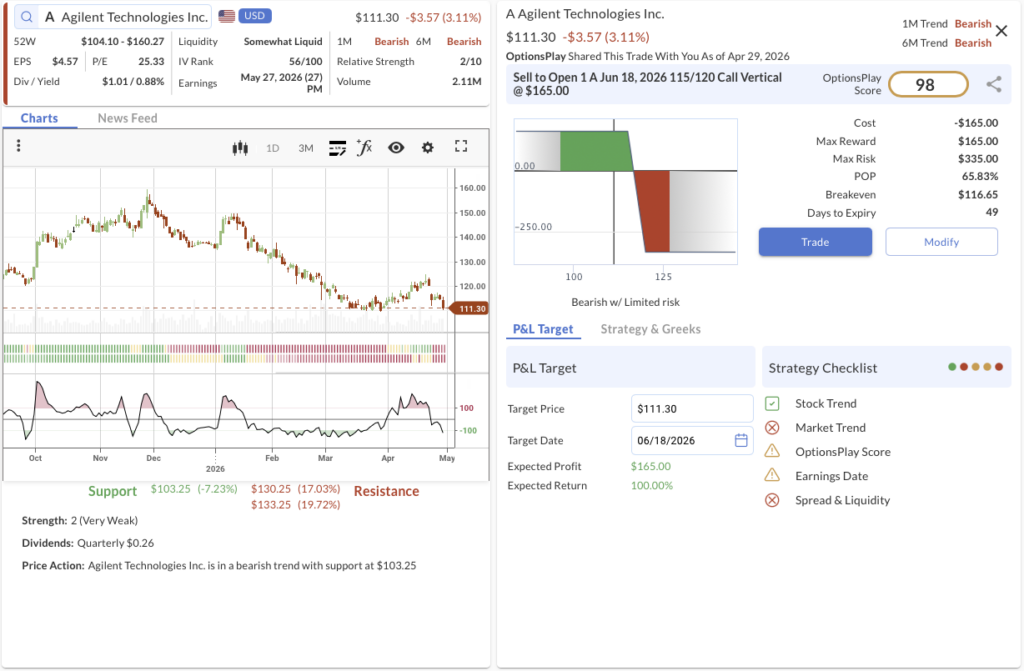
- The Trade: Sell to Open the A Jun 18, 2026 115/120 Call Vertical @ $1.65 Credit.
- 🔴 SELL TO OPEN Jun 18, 2026 115 Call @ $4.45
- 🟢 BUY TO OPEN Jun 18, 2026 120 Call @ $2.80
- Trade Metrics: POP: 65.83% | Collect $165 per contract vs. a Max Risk of $335 (2.03:1).
- The Why: Agilent faces potential top-line headwinds and margin compression amid softening biopharma equipment demand and conservative lab spending environments.
- The Technicals: A is entrenched in a definitive 1M and 6M bearish trend, recently breaking lower with formidable overhead resistance at $130.25 restricting upward mobility.
- Management:
- ⚠️ Warning: Earnings is scheduled for May 27, 2026, which may require active management.
- Stop Loss: Buy back the spread at $3.30 (100% of credit received).
- Take Profit: Buy back the spread at $0.82 (50% of max gain).
GOOGL, DELL
OptionsPlay DailyPlay Ideas Menu – April 29th, 2026
💰 The Income Generators (High Probability, Cash Flow)
- GOOGL: Bullish Put Spread capitalizing on strong technical momentum and AI infrastructure demand.
- DELL: Bullish Put Spread leveraging Dell’s transformation into a high-growth enterprise AI infrastructure provider trading at an attractive valuation.
🚀 The Growth Seekers (Higher Risk, Max Reward)
- (No trades in this category today)
🛡️ The Portfolio Protectors (Hedges & Bearish Bets)
- (No trades in this category today)
1. GOOGL ($349.78) – Monetizing the Cloud

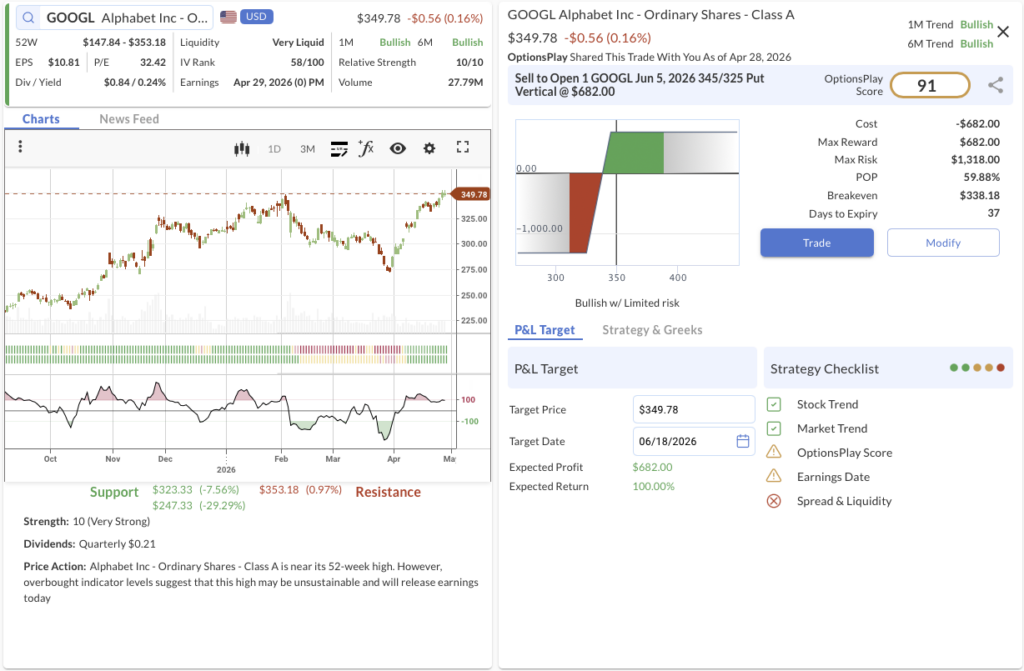
- We’re betting on: If Alphabet continues to ride its structural bullish trend and monetization efforts across its cloud and ad networks hold strong, the stock will maintain its support base and stay above our $340 strike.
- The Trade: Sell to Open the GOOGL Jun 05, 2026 345/325 Put Vertical @ $6.82 Credit.
- 🟢 BUY TO OPEN Jun 05, 2026 325 Put @ $5.73
- 🔴 SELL TO OPEN Jun 05, 2026 345 Put @ $12.55
- Trade Metrics: POP: 59.88% | Collect $682.00 per contract vs. a Max Risk of $1,318.00 (1.9:1).
- The Setup: Alphabet remains a cornerstone of the mega-cap tech trade. The stock is supported by maximum Relative Strength (10/10) within a primary Bullish Trend (1M & 6M). With structural support firmly established near the $330 level, selling a put spread here allows us to capture premium by leaning on a high-probability technical floor as the company proves out its AI monetization cycle.
- Management:
- Stop Loss: Buy back the spread at $13.64 (100% of credit received).
- Take Profit: Buy back the spread at $3.41 (50% of max gain).
2. DELL ($205.93) – The AI Factory Transformation

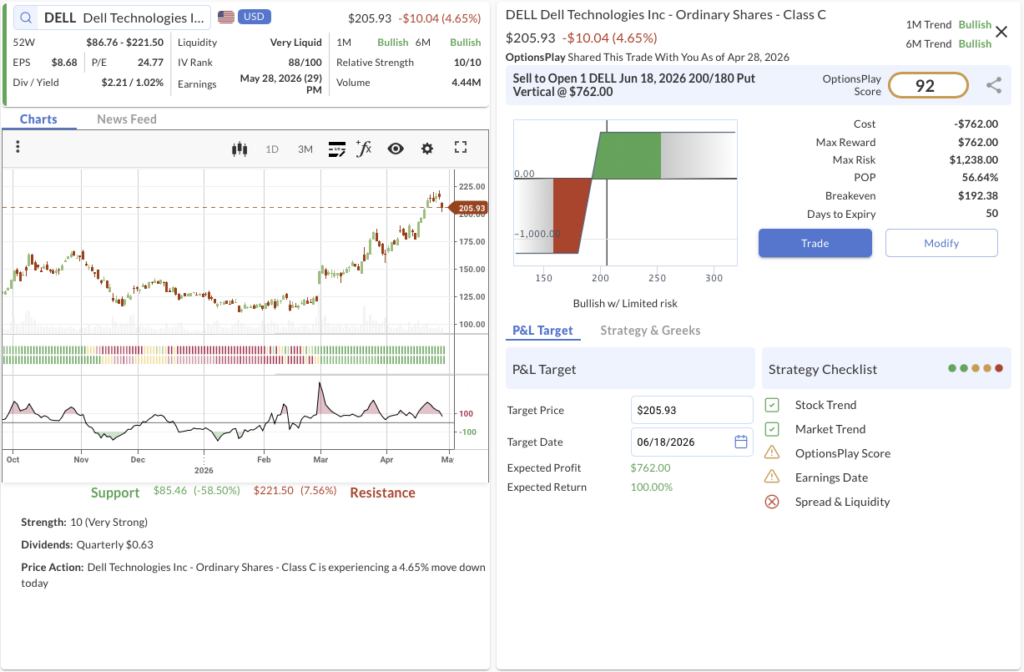
- We’re betting on: If the market continues to re-rate Dell from a legacy hardware manufacturer to a high-growth AI infrastructure play, the stock will maintain its breakout trajectory and hold safely above our $150 strike.
- The Trade: Sell to Open the DELL Jun 18, 2026 200/180 Put Vertical @ $7.62 Credit.
- 🟢 BUY TO OPEN Jun 18, 2026 180 Put @ $7.88
- 🔴 SELL TO OPEN Jun 18, 2026 200 Put @ $15.50
- Trade Metrics: POP: 56.64% | Collect $762.00 per contract vs. a Max Risk of $1,238.00 (1.6:1).
- The Setup: The core transformation story is that Dell is no longer a legacy PC maker. It has repositioned itself as a central infrastructure provider for enterprise AI, and the “AI Factory” (PowerEdge servers, ObjectScale storage, NVIDIA Blackwell GPUs, and liquid cooling) is gaining massive traction. ISG grew 73% year over year, with AI servers up an incredible 342%. Despite this, trading near 10x forward earnings, the valuation still reflects a hardware company, not a high-growth AI platform. This disconnect offers a prime trend-following setup to sell premium on the dip.
- Management:
- Stop Loss: Buy back the spread at $15.24 (100% of credit received).
- Take Profit: Buy back the spread at $3.81 (50% of max gain).
NVDA, COHR, AMZN
OptionsPlay DailyPlay Ideas Menu – April 28th, 2026
💰 The Income Generators (High Probability, Cash Flow)
- NVDA: Bullish Put Spread capitalizing on the marquee AI name rejoining our Confirmed leadership board with multi-timeframe strength.
- COHR: Bullish Put Spread leveraging perfect relative strength and confirmed bullish trends to capture premium.
🚀 The Growth Seekers (Higher Risk, Max Reward)
- AMZN: Long Call Spread targeting continued AWS acceleration, AI infrastructure dominance, and margin expansion heading into earnings.
🛡️ The Portfolio Protectors (Hedges & Bearish Bets)
- (No trades in this category today)
1. NVDA ($216.61) – Reclaiming AI Leadership

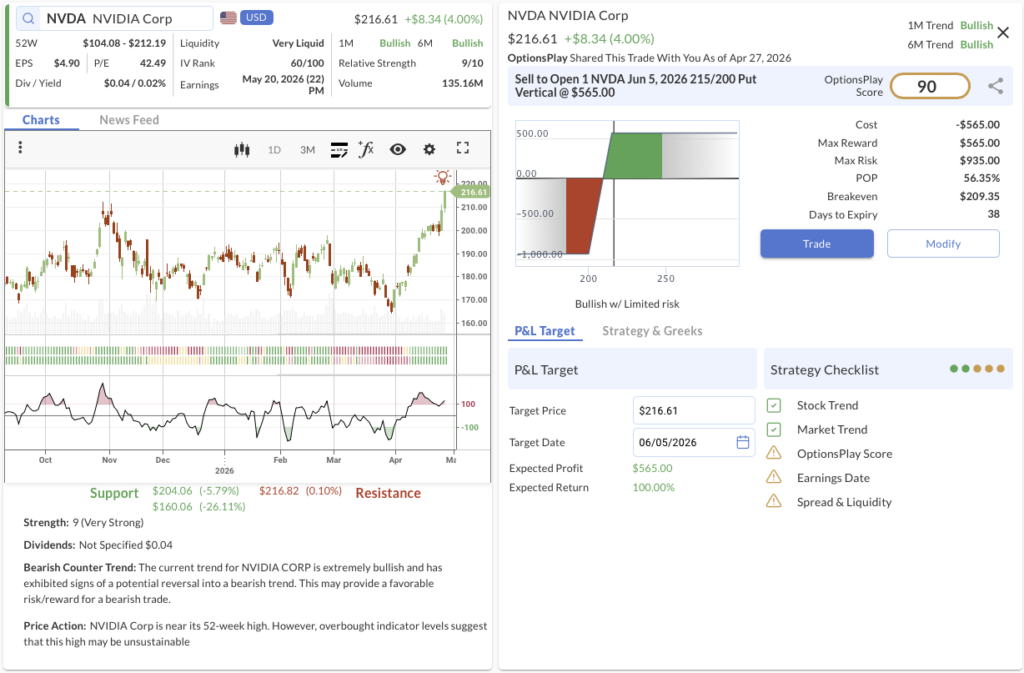
- We’re betting on: If NVIDIA maintains its structural breakout and multi-timeframe fundamental strength, the stock will hold its support base and stay above our $215 strike through early June.
- The Trade: Sell to Open the NVDA Jun 5, 2026 215/200 Put Vertical @ $5.65 Credit.
- 🟢 BUY TO OPEN Jun 05, 2026 200 Put @ $5.50
- 🔴 SELL TO OPEN Jun 05, 2026 215 Put @ $11.15
- Trade Metrics: POP: 56.35% | Collect $565.00 per contract vs. a Max Risk of $935.00 (1.6:1).
- The Setup: Sourced from our Equity Research Watchlist, NVIDIA has re-entered the leadership board with multi-timeframe strength after a long absence. It ranks among the strongest fundamentals in our broader coverage universe. The marquee AI name rejoining “Confirmed” status alongside a complex-wide broadening is a critical signal. Technically, the stock is supported by robust Relative Strength (9/10) and confirmed Bullish Trends across 1M and 6M timeframes.
- Management:
- ⚠️ Warning: Earnings is scheduled for May 20, which may require active management.
- Stop Loss: Buy back the spread at $11.30 (100% of credit received).
- Take Profit: Buy back the spread at $2.82 (50% of max gain).
2. COHR ($321.53) – Momentum in Materials

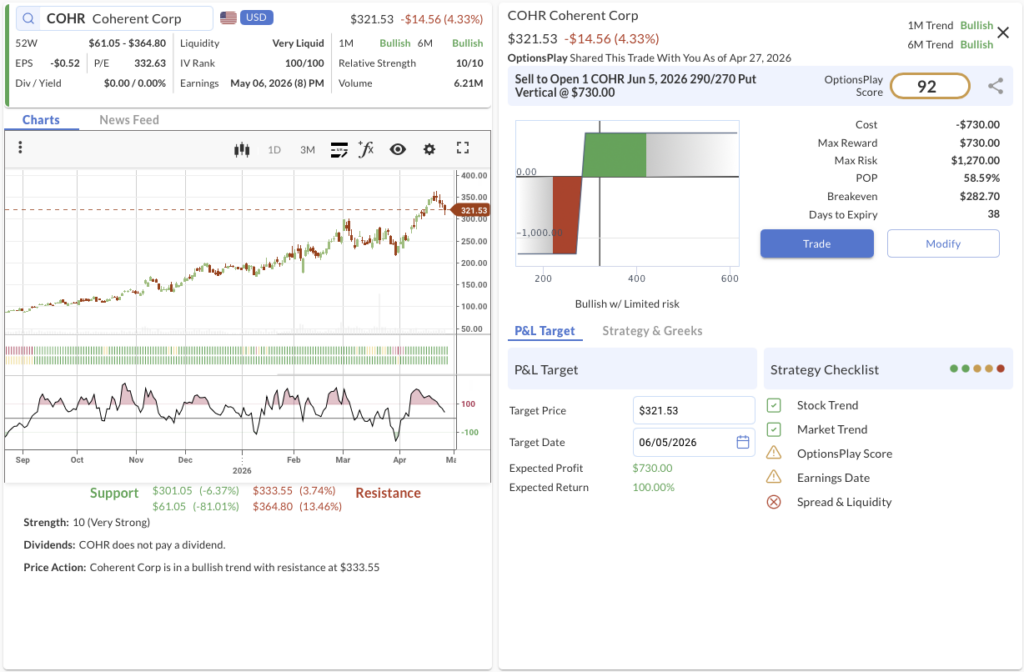
- We’re betting on: If Coherent Corp continues to ride its powerful bullish momentum, the stock will easily maintain support above our $290 strike, allowing this credit spread to expire worthless.
- The Trade: Sell to Open the COHR Jun 5, 2026 290/270 Put Vertical @ $7.30 Credit.
- 🟢 BUY TO OPEN Jun 05, 2026 270 Put @ $18.35
- 🔴 SELL TO OPEN Jun 05, 2026 290 Put @ $25.65
- Trade Metrics: POP: 58.59% | Collect $730.00 per contract vs. a Max Risk of $1,270.00 (1.7:1).
- The Setup: Coherent Corp is displaying flawless technical momentum, characterized by a perfect Relative Strength score (10/10) and confirmed Bullish Trends across both 1M and 6M timeframes. We are utilizing this structural strength to sell premium below the current price action, leaning on established support near $301.
- Management:
- ⚠️ Warning: Earnings is scheduled for May 06, which may require active management.
- Stop Loss: Buy back the spread at $14.60 (100% of credit received).
- Take Profit: Buy back the spread at $3.65 (50% of max gain).
3. AMZN ($261.12) – The AWS Reacceleration

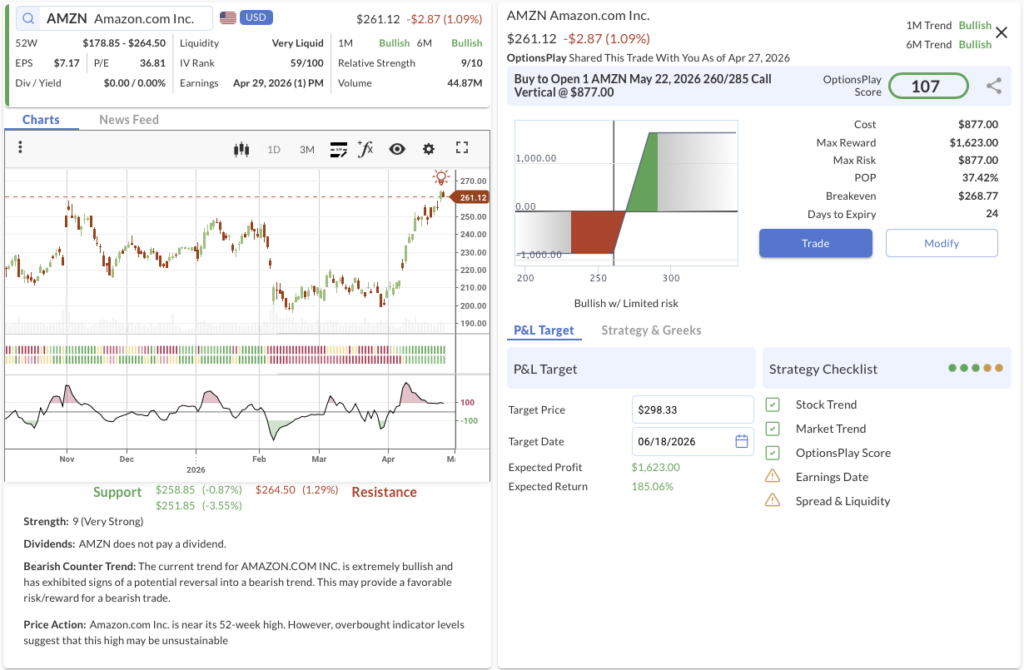
- We’re betting on: If Amazon delivers a strong earnings report demonstrating AWS growth and AI infrastructure dominance, the stock will push through overhead resistance and expand its breakout range.
- The Trade: Buy to Open the AMZN May 22, 2026 260/285 Call Vertical @ $8.77 Debit.
- 🟢 BUY TO OPEN May 22, 2026 260 Call @ $12.77
- 🔴 SELL TO OPEN May 22, 2026 285 Call @ $4.00
- Trade Metrics: POP: 37.44% | Pay $877.00 per contract vs. a Max Reward of $1,623.00 (1.8:1).
- The Setup: Heading into its April 29 earnings print, Amazon is pushing near new 52-week highs. AWS is reaccelerating, and AI revenue is scaling quickly with meaningful enterprise demand. Massive ~$200B capex is largely backed by customers, reducing execution risk, while strategic deals (like Meta partnerships) validate Amazon’s custom chip ecosystem. Technically, the stock is in a confirmed Bullish Trend (1M & 6M) with strong Relative Strength (9/10), offering a high-reward setup for a beat-and-raise scenario.
- Management:
- ⚠️ Warning: Earnings is scheduled for Apr 29, which may require active management.
- Stop Loss: Sell the spread at $4.38 (50% loss on premium).
- Take Profit: Sell the spread at $15.34 (75% gain on premium).
BA, ASML, FSLR
OptionsPlay DailyPlay Ideas Menu – April 27th, 2026
Strategies Corner: Narrow Leadership & The Megacap Pivot
The S&P 500 (7,165) and Nasdaq (24,837) closed Friday at fresh records, driven by Intel’s historic 23.6% surge and a major Google Cloud AI deal. However, the tape underneath those records is the narrowest it has been all year. The Philadelphia Semiconductor Index has strung together 18 consecutive up sessions, yet five of the eleven S&P 500 sectors finished red. That is leadership concentration, not a clean broadening trade.
While the earnings backdrop is genuinely exceptional—blended Q1 EPS growth is tracking at +15.1% with record 13.4% net margins—this extreme concentration warrants caution. When a single sector carries the tape, the next leg lower in those leaders becomes the entire index print. I am trimming the most extended leadership names, rotating proceeds into laggard sectors with clean Q1 prints (Materials, Financials), and raising hedge ratios.
Wednesday, April 29, is the defining pivot of the year. We have the FOMC rate decision (where a hold is 99.7% priced in), the War Powers Act 60-day ceiling for the Iran conflict, and mega-cap tech earnings (Microsoft, Meta, Alphabet, and Amazon) all reporting at the close. The primary variable is the hyperscaler capex guide. The market demands monetization evidence for massive AI spending. If these giants reiterate or raise capex without commensurate cloud or ad monetization, the AI infrastructure thesis could re-rate violently.
The macro overlay compounds this risk heading into Thursday’s GDP and Core PCE prints. With the US-Iran ceasefire effectively collapsed and Brent holding above $100, the oil-pass-through risk in Core PCE could cement a “no cuts in 2026” base case.
My Playbook: Keep core long exposure on for the earnings backdrop, but trim concentration in the leaders that have run the hardest. Raise the hedge book through energy and defined-risk options, and treat Wednesday’s hyperscaler capex guides as the single most important variable for the rest of 2026’s tech tape. This tape has earned respect, but it no longer earns chasing.
💰 The Income Generators (High Probability, Cash Flow)
- BA: Bullish Put Spread leaning on technical support and a highlighted placement on our Equity Research Watchlist.
- ASML: Bullish Put Spread buying a short-term CCI dip in a top-tier semiconductor equipment leader.
🚀 The Growth Seekers (Higher Risk, Max Reward)
- (No trades in this category today)
🛡️ The Portfolio Protectors (Hedges & Bearish Bets)
- FSLR: Bearish Call Spread hedging against weak guidance, downward estimate revisions, and fragile sentiment into earnings.
1. BA ($232.44) – Establishing the Floor

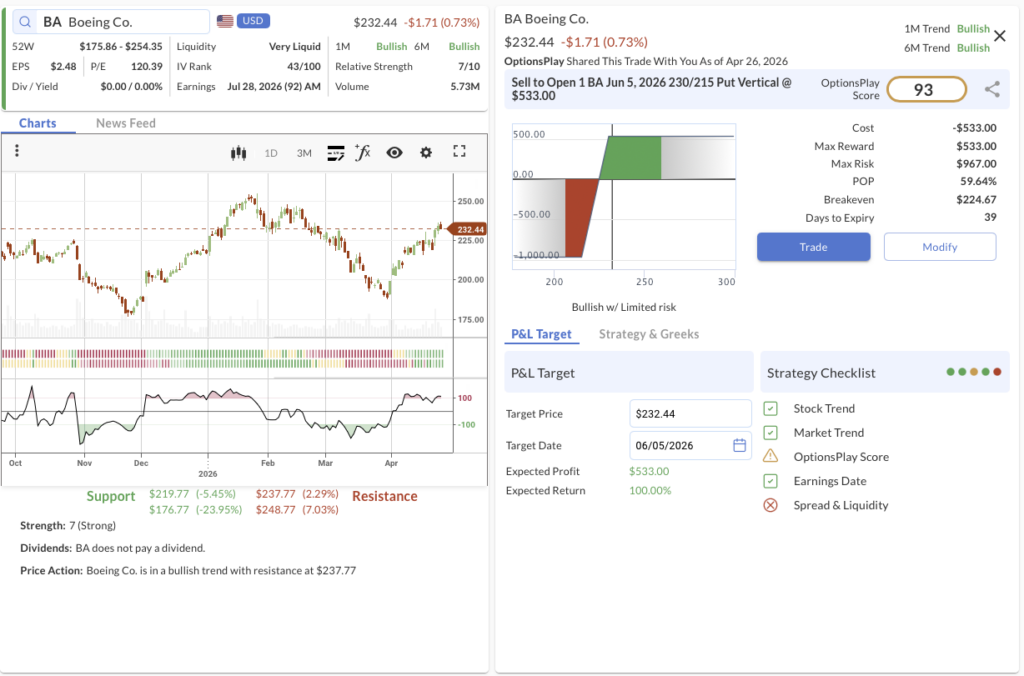
- We’re betting on: If Boeing can maintain its structural support floor and industrial sentiment remains resilient, the stock will continue to base build and hold above our $230 strike through early June.
- The Trade: Sell to Open the BA Jun 5, 2026 230/215 Put Vertical @ $5.33 Credit.
- 🟢 BUY TO OPEN Jun 05, 2026 215 Put @ $3.74
- 🔴 SELL TO OPEN Jun 05, 2026 230 Put @ $9.07
- Trade Metrics: POP: 59.65% | Collect $533.00 per contract vs. a Max Risk of $967.00 (1.8:1).
- The Setup: Highlighted on our Equity Research Watchlist, Boeing is attempting to establish a firm floor. Technically, the stock is showing a primary Bullish Trend (1M & 6M) and recently experienced a pullback near its $219 support zone. Selling a put spread here capitalizes on its solid Relative Strength (7/10) to generate premium while leaning on structural support just below current prices.
- Management:
- Stop Loss: Buy back the spread at $10.66 (100% of credit received).
- Take Profit: Buy back the spread at $2.66 (50% of max gain).
2. ASML ($1,457.70) – Buying the Silicon Dip

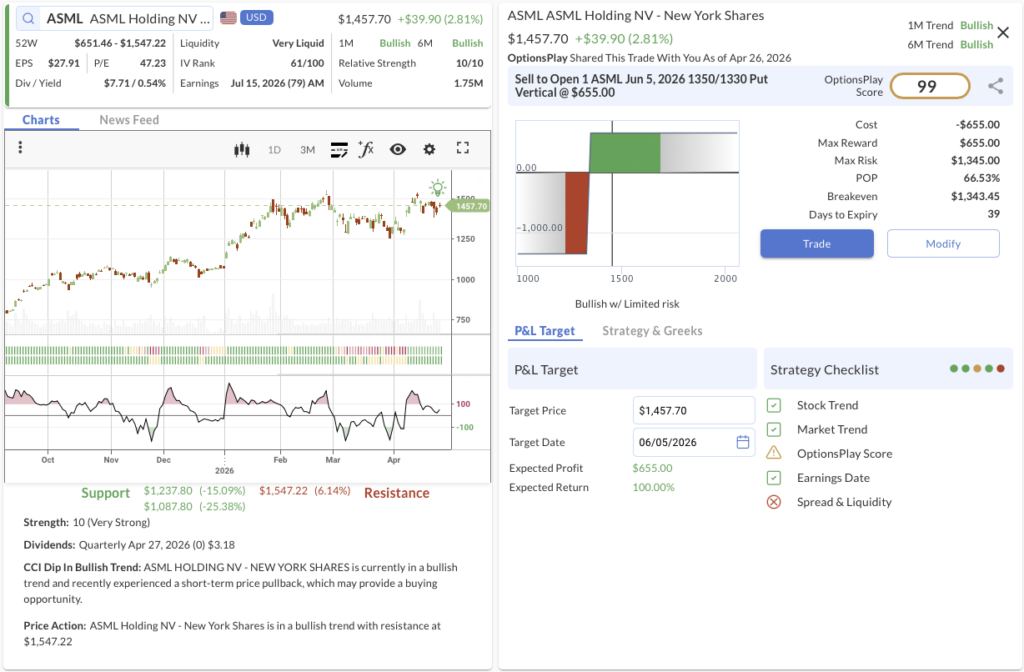
- We’re betting on: If AI capex spending continues to support advanced lithography demand, ASML will bounce off its recent pullback and remain safely above our $1,350 strike through early June.
- The Trade: Sell to Open the ASML Jun 5, 2026 1350/1330 Put Vertical @ $6.55 Credit.
- 🟢 BUY TO OPEN Jun 05, 2026 1330 Put @ $39.55
- 🔴 SELL TO OPEN Jun 05, 2026 1350 Put @ $46.10
- Trade Metrics: POP: 66.54% | Collect $655.00 per contract vs. a Max Risk of $1,345.00 (2.1:1).
- The Setup: With the Semiconductor Index extending an unprecedented 18-day winning streak on the back of explosive AI capex, ASML remains a critical linchpin in global chip production. Supported by maximum Relative Strength (10/10) within a powerful Bullish Trend (1M & 6M), the stock recently experienced a short-term CCI dip. This provides a high-probability buying opportunity to sell premium against its established support base near $1,237.
- Management:
- Stop Loss: Buy back the spread at $13.10 (100% of credit received).
- Take Profit: Buy back the spread at $3.27 (50% of max gain).
3. FSLR ($193.76) – Fading the Solar Sentiment

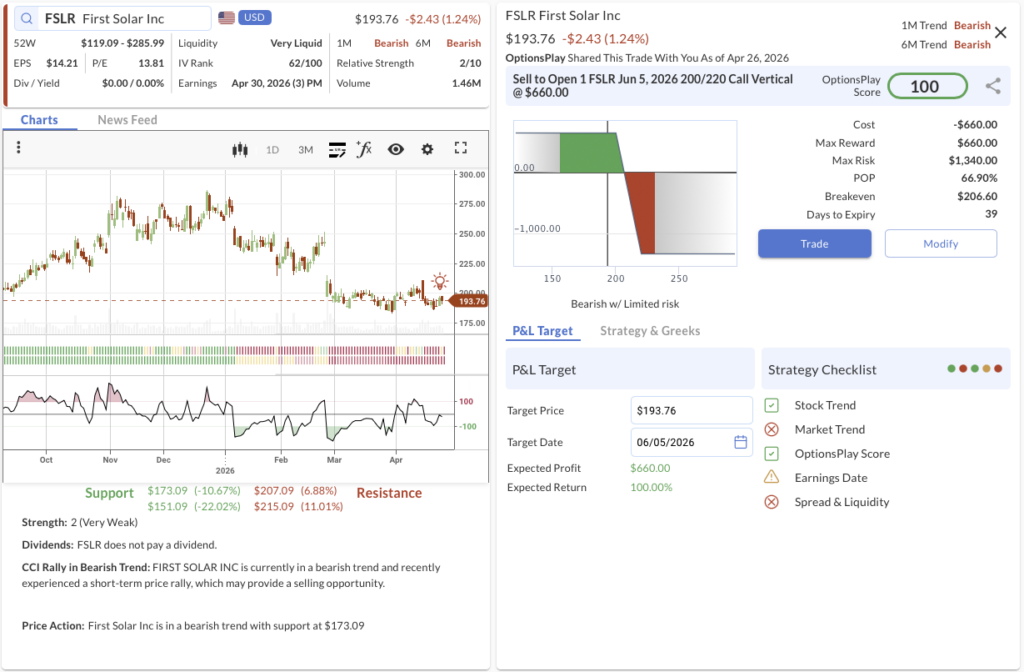
- We’re betting on: If tariff costs, policy uncertainty, and weak guidance continue to weigh heavily on investor sentiment, First Solar’s counter-trend bounce will fail, keeping the stock suppressed below our $200 strike.
- The Trade: Sell to Open the FSLR Jun 5, 2026 200/220 Call Vertical @ $6.60 Credit.
- 🔴 SELL TO OPEN Jun 05, 2026 200 Call @ $12.63
- 🟢 BUY TO OPEN Jun 05, 2026 220 Call @ $6.03
- Trade Metrics: POP: 66.90% | Collect $660.00 per contract vs. a Max Risk of $1,340.00 (2.0:1).
- The Setup: First Solar’s outlook into its April 30 earnings leans slightly bearish. While long-term fundamentals remain intact, recent execution has been uneven, with weak guidance and downward estimate revisions. Revenue expectations for 2026 came in below consensus, and tariff costs plus policy uncertainty add pressure. Technically, the stock is mired in a dual Bearish Trend (1M & 6M) with Very Weak Relative Strength (2/10). The recent CCI rally in a bearish trend offers a textbook selling opportunity before overhead resistance kicks in at $215.
- Management:
- ⚠️ Warning: Earnings is scheduled for Apr 30, which may require active management.
- Stop Loss: Buy back the spread at $13.20 (100% of credit received).
- Take Profit: Buy back the spread at $3.30 (50% of max gain).
MPC, IWM, BMY
OptionsPlay DailyPlay Ideas Menu – April 24th, 2026
Strategies Corner: The “Beat-and-Fade” Regime
Today was a modest reset, not a regime shift. The S&P 500 closed at 7,108 and the Nasdaq at 24,439—the first red day since Monday, pulling back from Wednesday’s records. The tape made clear why: a concentrated software rout led by ServiceNow’s worst day on record, punctuated by IBM, a second Tesla leg lower, and the first genuinely uncomfortable PMI print of the year. This reads as sector-specific stress layered on top of live geopolitics, not the start of a broader correction. My framing remains constructive but hedged. Intel’s after-hours blowout—with Data Center and AI revenue up 22% year-over-year and a clean Q2 raise—validates that the earnings-led bull is alive, but highly selective. The market is willing to pay up for monetization evidence when a company actually delivers it.
The bigger message sits in the pattern. Roughly 81% of S&P 500 reporters are beating this quarter, yet names that beat without raising are being sold aggressively. ServiceNow beat and faded on explicit Iran-linked subscription headwinds; IBM and Tesla did the same on weak outlooks or massive capex raises. This is a “beat-and-fade” regime. The market is no longer accepting “good quarter, same outlook” to chase prices to records; it demands forward confirmation.
Looking to the Mag 4 next Tuesday, the bar remains unchanged: monetization is the test. We know Alphabet’s $175-$185B capex figure, but Cloud growth needs to clear 50%. Microsoft needs Azure constant-currency in the high 30s. Amazon needs AWS above 20%. Meta needs revenue growth to hold 32%. If they deliver, the software rout stays quarantined. If two or more miss on the forward outlook, the April rally will be severely tested. I want monetization evidence, and I am expressing that view through defined-risk options rather than outright directional bets.
On the macro side, stagflation is now in the tape. PMIs flagged manufacturing input costs at a 10-month high against slowing services, arriving exactly as Brent settles near $104 for its sixth straight session. With President Trump publicly ordering the Navy to destroy Iranian mine-laying vessels and declaring Hormuz “sealed up tight,” oil pass-through risk is materializing. Wednesday’s FOMC decision is the first real test of whether Chair Powell leans against the softer services read or holds the line against hotter input costs.
My Playbook: I am keeping the energy book on as an explicit hedge. I’m maintaining small-cap positioning at cheap 16x forward multiples with 17% consensus growth, leaning into semis over software after Intel, and running defined-risk options through Mag 4 and the FOMC. This tape still rewards staying engaged—it just demands doing it with hedges.
💰 The Income Generators (High Probability, Cash Flow)
- MPC: Bullish Put Spread fading a short-term dip on a top-tier refiner acting as a geopolitical hedge.
- IWM: Bullish Put Spread capitalizing on a regime shift toward broader small-cap market participation.
🚀 The Growth Seekers (Higher Risk, Max Reward)
- (No trades in this category today)
🛡️ The Portfolio Protectors (Hedges & Bearish Bets)
- BMY: Bearish Long Put Spread hedging against weak pharmaceutical flow, negative revisions, and a tough earnings setup.
1. MPC ($221.10) – Hedging with the Refiners

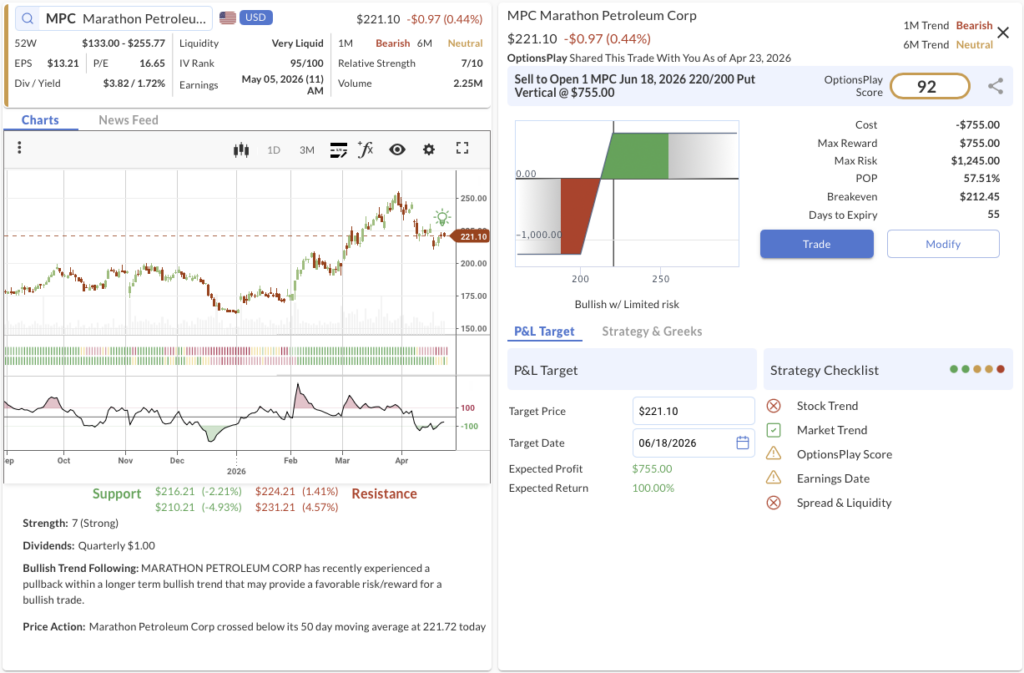
- We’re betting on: If oil remains elevated above $100 and domestic refiners continue to benefit from geopolitical risk premiums, MPC will bounce from its short-term pullback and hold above our $220 strike through June.
- The Trade: Sell to Open the MPC Jun 18, 2026 220/200 Put Vertical @ $7.55 Credit.
- 🟢 BUY TO OPEN Jun 18, 2026 200 Put @ $5.00
- 🔴 SELL TO OPEN Jun 18, 2026 220 Put @ $12.55
- Trade Metrics: POP: 57.52% | Collect $755.00 per contract vs. a Max Risk of $1,245.00 (1.6:1).
- The Setup: Highlighted on our Iran Watchlist and Flow Dashboard, Marathon Petroleum serves as a critical structural hedge against the ongoing Hormuz disruptions. While the stock crossed below its 50-day moving average today, this short-term CCI pullback within a longer-term bullish structure provides a highly favorable risk/reward entry to sell premium on a defensively positioned energy leader.
- Management:
- ⚠️ Warning: Earnings is scheduled for May 05, which may require active management.
- Stop Loss: Buy back the spread at $15.10 (100% of credit received).
- Take Profit: Buy back the spread at $3.78 (50% of max gain).
2. IWM ($275.52) – The Broadening Rotation

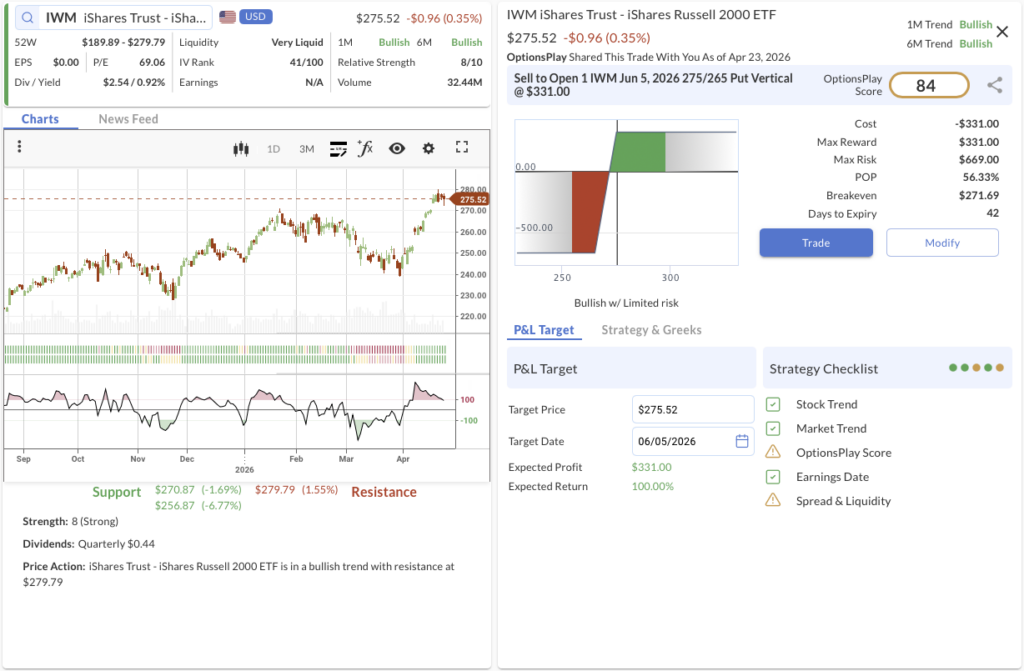
- We’re betting on: If capital continues rotating out of concentrated tech and into under-owned domestic equities, small-cap breadth will expand, keeping IWM safely above our $275 strike.
- The Trade: Sell to Open the IWM Jun 5, 2026 275/265 Put Vertical @ $3.31 Credit.
- 🟢 BUY TO OPEN Jun 05, 2026 265 Put @ $4.96
- 🔴 SELL TO OPEN Jun 05, 2026 275 Put @ $8.27
- Trade Metrics: POP: 56.34% | Collect $331.00 per contract vs. a Max Risk of $669.00 (2.0:1).
- The Setup: Small-cap breadth is building, marking an early regime shift from narrow mega-cap leadership to broader market participation. With domestic exposure, easing financial conditions, and an attractive 16x forward multiple, IWM is perfectly positioned to capture this rotation. Technically, the ETF is in a confirmed Bullish Trend (1M & 6M) with strong Relative Strength (8/10), making this a high-conviction trend-following setup.
- Management:
- Stop Loss: Buy back the spread at $6.62 (100% of credit received).
- Take Profit: Buy back the spread at $1.66 (50% of max gain).
3. BMY ($59.02) – Fading the Pharma Flow

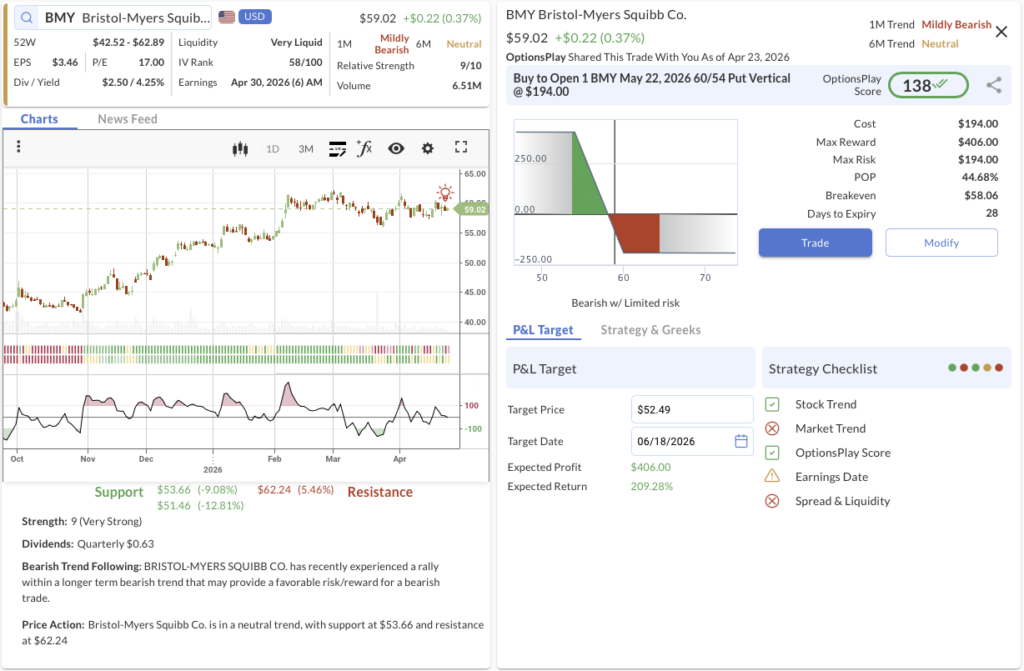
- We’re betting on: If seasonal destocking, negative earnings revisions, and looming patent headwinds materialize during its earnings print, BMY will fail to hold support and drift lower, expanding the value of this debit spread.
- The Trade: Buy to Open the BMY May 22, 2026 60/54 Put Vertical @ $1.94 Debit.
- 🔴 SELL TO OPEN May 22, 2026 54 Put @ $0.61
- 🟢 BUY TO OPEN May 22, 2026 60 Put @ $2.55
- Trade Metrics: POP: 44.67% | Pay $194.00 per contract vs. a Max Reward of $406.00 (2.1:1).
- The Setup: Bristol Myers Squibb heads into its April 30 earnings with a fundamentally weak setup. EPS is expected down roughly 19% year-over-year, and analyst sentiment is drifting lower. Our Flow Playbook specifically flags to “Avoid Pharma” right now, and the stock recently triggered a bearish trend-following alert. Because options volatility skew is unfavorable for a short call spread, utilizing a defined-risk long put vertical is the optimal way to play the downside.
- Management:
- ⚠️ Warning: Earnings is scheduled for Apr 30, which may require active management.
- Stop Loss: Sell the spread at $0.97 (50% loss on premium).
- Take Profit: Sell the spread at $3.40 (75% gain on premium).
LRCX, CMI, TEAM
OptionsPlay DailyPlay Ideas Menu – April 23rd, 2026
💰 The Income Generators (High Probability, Cash Flow)
- LRCX: Put Vertical capitalizing on strong semiconductor equipment demand and robust earnings momentum following their recent report.
- CMI: Put Vertical leveraging the industrial sector’s resilience and strong commercial engine demand ahead of their upcoming earnings release.
🚀 The Growth Seekers (Higher Risk, Max Reward)
- (No trades in this category today)
🛡️ The Portfolio Protectors (Hedges & Bearish Bets)
- TEAM: Call Vertical fading the recent rally due to ongoing valuation concerns and slowing enterprise software growth metrics.
1. LRCX ($265.55) – Post-Earnings Momentum Continuation

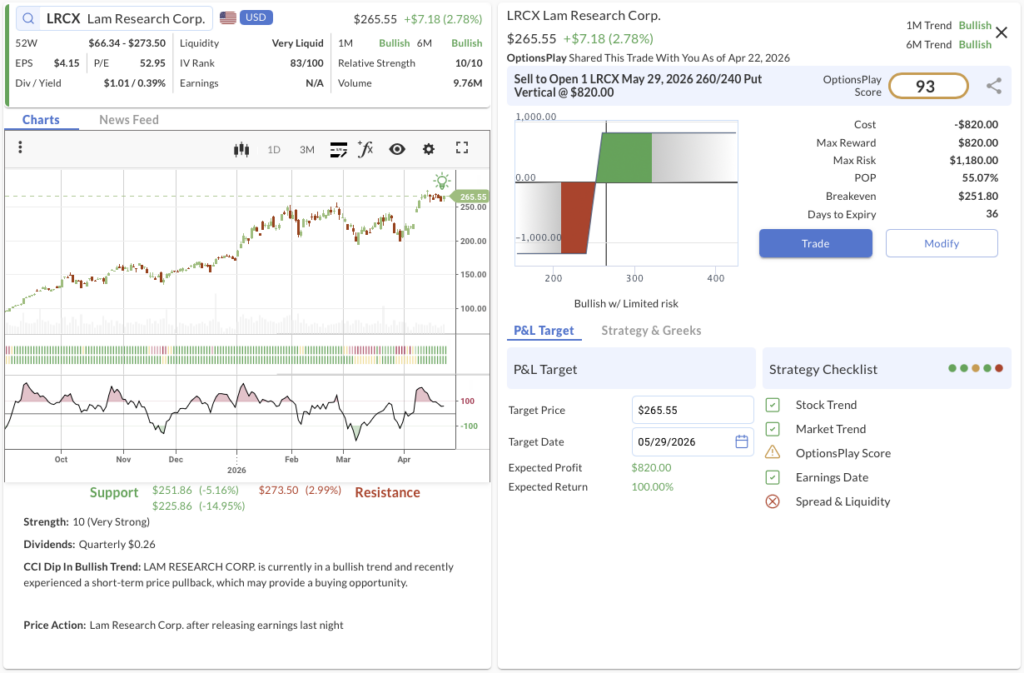
- The Trade: Sell to Open the LRCX May 29, 2026 260/240 Put Vertical @ $8.20 Credit.
- 🟢 BUY TO OPEN May 29, 2026 240 Put @ $11.30
- 🔴 SELL TO OPEN May 29, 2026 260 Put @ $19.50
- Trade Metrics: POP: 55.07% | Collect $820 per contract vs. a Max Risk of $1,180 (1.44:1).
- The Why: Capitalizing on strong semiconductor equipment demand and robust earnings momentum following their recent report.
- The Technicals: LRCX remains in a strong multi-month bullish trend and has recently experienced a short-term CCI pullback to its immediate support level near $251, providing a solid entry point for a bullish setup.
- Management:
- Stop Loss: Buy back the spread at $16.40 (100% of credit received).
- Take Profit: Buy back the spread at $4.10 (50% of max gain).
2. CMI ($639.22) – Industrial Resilience Income

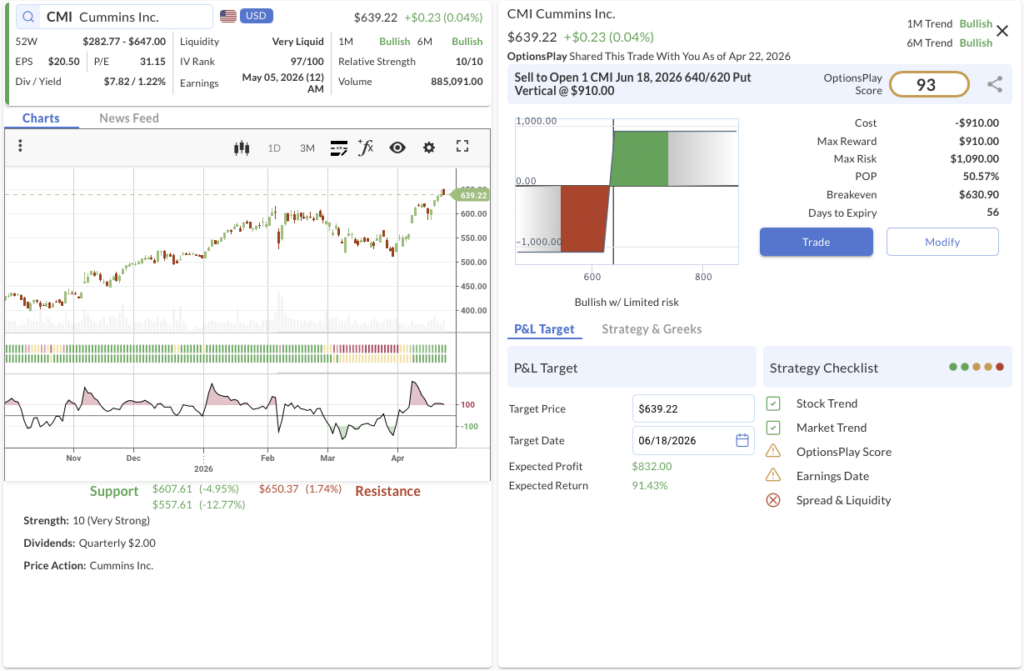
- The Trade: Sell to Open the CMI Jun 18, 2026 640/620 Put Vertical @ $9.10 Credit.
- 🟢 BUY TO OPEN Jun 18, 2026 620 Put @ $29.30
- 🔴 SELL TO OPEN Jun 18, 2026 640 Put @ $38.40
- Trade Metrics: POP: 50.57% | Collect $910 per contract vs. a Max Risk of $1,090 (1.20:1).
- The Why: Leveraging the industrial sector’s resilience and strong commercial engine demand ahead of their upcoming earnings release.
- The Technicals: CMI is maintaining a steady uptrend across the 1-month and 6-month timeframes, consistently making higher highs and holding strong structural support above the $607 level.
- Management:
- ⚠️ Warning: Earnings is scheduled for May 05, 2026, which may require active management.
- Stop Loss: Buy back the spreade at $18.20 (100% of credit received).
- Take Profit: Buy back the spread at $4.55 (50% of max gain).
3. TEAM ($74.01) – Fading the Relief Rally

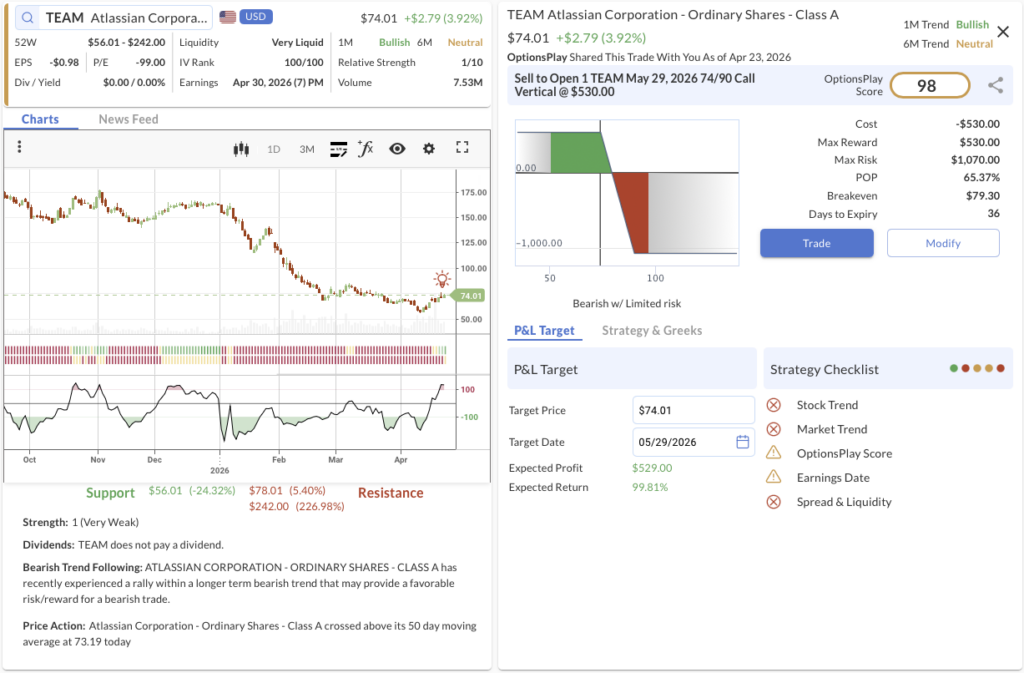
- The Trade: Sell to Open the TEAM May 29, 2026 74/90 Call Vertical @ $5.30 Credit.
- 🔴 SELL TO OPEN May 29, 2026 74 Call @ $8.80
- 🟢 BUY TO OPEN May 29, 2026 90 Call @ $3.50
- Trade Metrics: POP: 65.37% | Collect $530 per contract vs. a Max Risk of $1,070 (2.02:1).
- The Why: Fading the recent rally due to ongoing valuation concerns and slowing enterprise software growth metrics.
- The Technicals: TEAM has rallied into immediate resistance near $78 following a long-term bearish trend, presenting an optimal risk-reward scenario to fade the recent crossover of its 50-day moving average.
- Management:
- ⚠️ Warning: Earnings is scheduled for Apr 30, 2026, which may require active management.
- Stop Loss: Buy back the spread at $10.60 (100% of credit received).
- Take Profit: Buy back the spread at $2.65 (50% of max gain).
HLT, MU
OptionsPlay DailyPlay Ideas Menu – April 22nd, 2026
💰 The Income Generators (High Probability, Cash Flow)
- HLT: Bullish Put Spread capitalizing on resilient premium travel demand and strong pricing power heading into earnings.
- MU: Bullish Put Spread re-entering a high-conviction AI infrastructure play following a short-term CCI dip.
🚀 The Growth Seekers (Higher Risk, Max Reward)
- (No trades in this category today)
🛡️ The Portfolio Protectors (Hedges & Bearish Bets)
- (No trades in this category today)
1. HLT ($340.21) – Checking In for Income

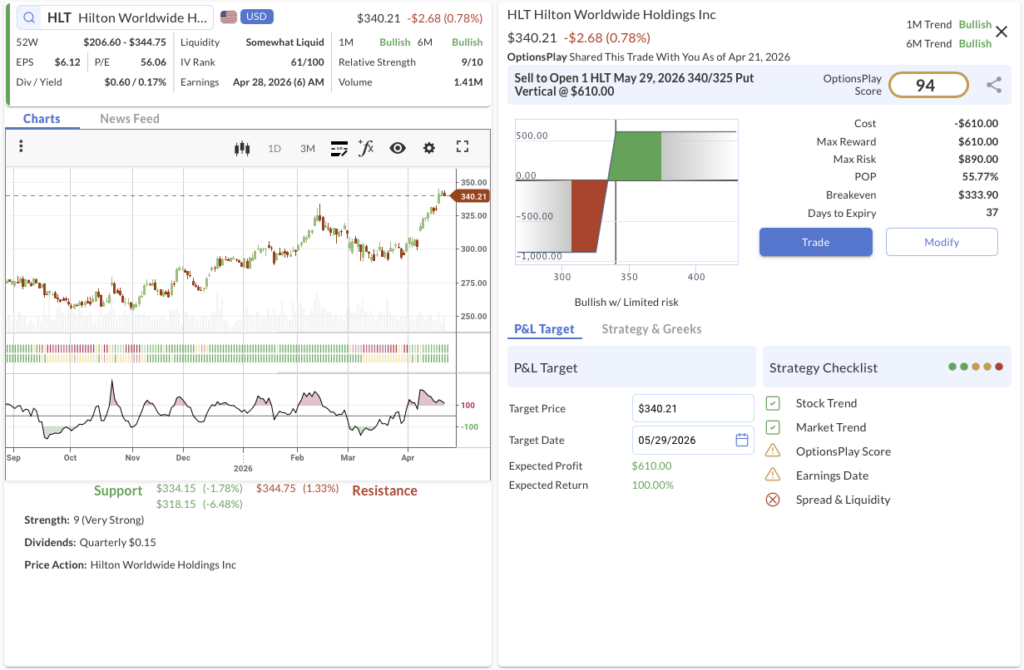
- We’re betting on: If global travel demand remains resilient and Hilton continues to leverage its pricing power, the stock will maintain its bullish trajectory and hold above our $340 strike through late May.
- The Trade: Sell to Open the HLT May 29, 2026 340/325 Put Vertical @ $6.10 Credit.
- 🟢 BUY TO OPEN May 29, 2026 325 Put @ $6.55
- 🔴 SELL TO OPEN May 29, 2026 340 Put @ $12.65
- Trade Metrics: POP: 55.77% | Collect $610.00 per contract vs. a Max Risk of $890.00 (1.5:1).
- The Setup: Despite broader consumer spending concerns, Hilton’s premium lodging portfolio and strong loyalty network provide durable pricing power. Technically, the stock exhibits robust Relative Strength (9/10) within a confirmed Bullish Trend (1M & 6M). With structural support established near $334, selling a put spread here offers a high-probability income setup just below current price action as it aims to break overhead resistance at $345.
- Management:
- ⚠️ Warning: Earnings is scheduled for Apr 28, which may require active management.
- Stop Loss: Buy back the spread at $12.20 (100% of credit received).
- Take Profit: Buy back the spread at $3.05 (50% of max gain).
2. MU ($449.38) – Supplying the AI Cycle

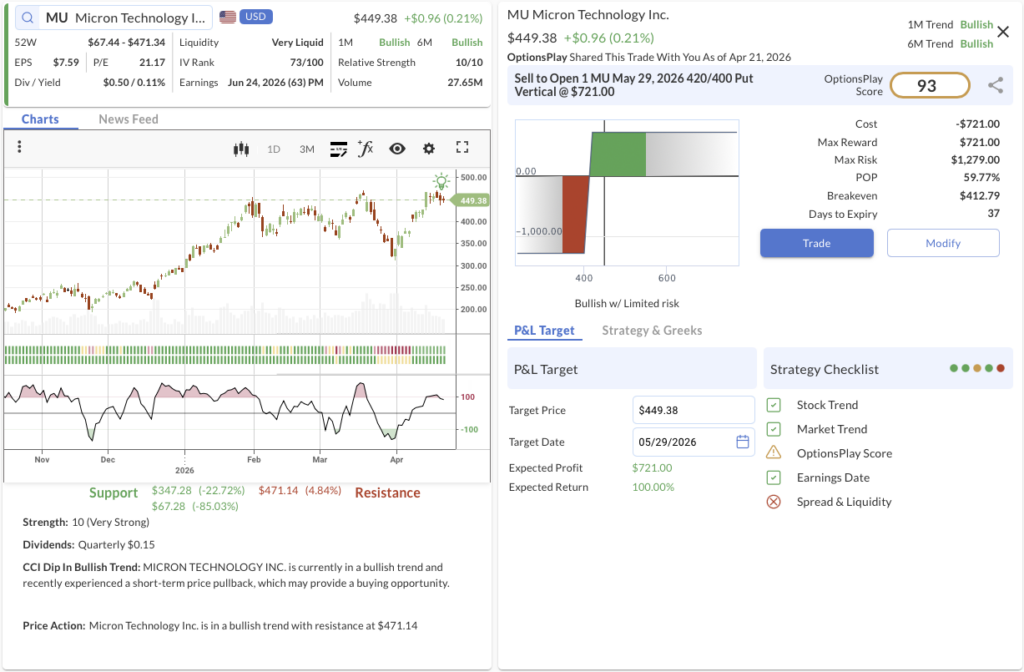
- We’re betting on: If Micron’s leadership in high-bandwidth memory continues to fuel its structural transition into a core AI infrastructure play, the stock will bounce from its recent CCI dip and stay well above our $420 strike.
- The Trade: Sell to Open the MU May 29, 2026 420/400 Put Vertical @ $7.21 Credit.
- 🟢 BUY TO OPEN May 29, 2026 400 Put @ $18.52
- 🔴 SELL TO OPEN May 29, 2026 420 Put @ $25.73
- Trade Metrics: POP: 59.77% | Collect $721.00 per contract vs. a Max Risk of $1,279.00 (1.8:1).
- The Setup: Micron is emerging as a core AI infrastructure play, not just a cyclical memory name. Its leadership in high-bandwidth memory (HBM4) is driving a structural shift in demand, with 2026 supply effectively sold out, fueling strong pricing power and clear earnings visibility. Technically, MU maintains maximum Relative Strength (10/10) in a powerful Bullish Trend (1M & 6M) and recently triggered a CCI dip alert, providing an optimal dip-buying opportunity to re-enter a proven winner above its $347 structural support base.
- Management:
- Stop Loss: Buy back the spread at $14.42 (100% of credit received).
- Take Profit: Buy back the spread at $3.60 (50% of max gain).