
MU, CL

OptionsPlay DailyPlay Ideas Menu – May 20th, 2026
What’s Driving The Market
- The Yield Shock Is The Real Story: The 30-year US Treasury yield recently punched through 5.19% intraday, hitting its highest level since July 2007. This violent move reset the discount rate for all long-duration assets, pulling the Nasdaq Composite down 0.84% and triggering the third consecutive daily decline for the S&P 500. The Russell 2000 took the heaviest hit, dropping over 1% as small caps absorbed the dual pressure of higher financing costs and slower growth expectations.
- Fiscal and Inflation Realities: The bond market’s reaction is driven by sticky inflation, not just geopolitical noise. April’s CPI print of +3.8% y/y marked the highest annual reading since May 2023, while the PPI at +6.0% y/y showed wholesale inflation passthrough is firmly underway. Consequently, the CME FedWatch tool now shows roughly a 50% to 60% probability of a rate hike this year, a stunning reversal from the rate cuts priced in just weeks ago.
- Geopolitical Volatility and Crude: WTI fell roughly 1.4% and Brent dropped 1.8% after reports surfaced that a scheduled US strike on Iran was called off in favor of renewed negotiations mediated by Pakistan. Despite this brief reprieve, oil prices remain elevated. With the Strait of Hormuz effectively closed and dozens of tankers anchored near Kharg Island, the IEA warns that global inventories are depleting at a record pace.
- Earnings Provide Mixed Signals: Home Depot beat expectations on both EPS and revenue, but posted a meaningful miss on comparable store sales (+0.6% actual versus +0.9% expected). This highlights a consumer environment under pressure from housing affordability constraints. Looking ahead, the market is bracing for NVIDIA’s earnings on Wednesday, which will serve as the ultimate binary test for the entire AI capital expenditure narrative.
💰 The Income Generators (High Probability, Cash Flow)
- MU: Bullish Put Spread capitalizing on an attractive risk to reward profile ahead of earnings as memory demand remains fundamentally robust.
🚀 The Growth Seekers (Higher Risk, Max Reward)
- CL: Bullish Call Spread targeting a clear early breakout driven by defensive relative strength and accelerating consumer staples momentum.
🛡️ The Portfolio Protectors (Hedges & Bearish Bets)
- (No trades in this category today)
1. MU ($698.74): The Memory Premium

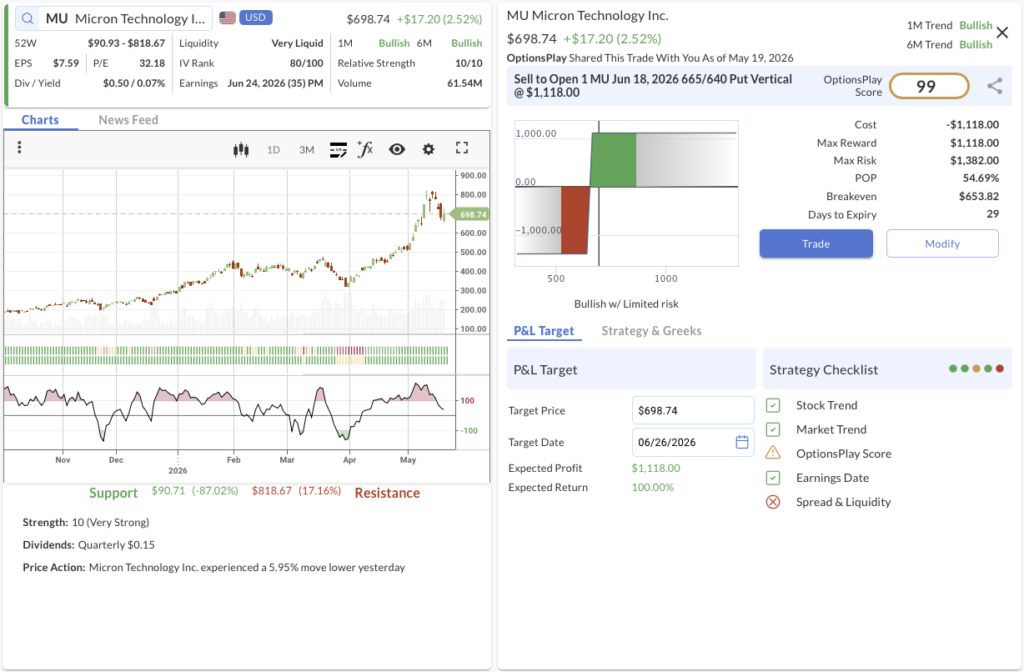
- We’re betting on: If Micron continues to hold its structural support levels ahead of its upcoming earnings, driven by strong fundamental demand for High Bandwidth Memory, this spread will decay rapidly.
- The Trade: Sell to Open the MU Jun 18, 2026 665/640 Put Vertical @ $11.18 Credit.
- 🟢 BUY TO OPEN Jun 18, 2026 640 Put @ $40.60
- 🔴 SELL TO OPEN Jun 18, 2026 665 Put @ $51.78
- Trade Metrics: POP: 54.69% | Collect $1,118.00 per contract vs. a Max Risk of $1,382.00 (0.8:1).
- The Setup: After two highly successful trades on April 9th and April 22nd, we have another pristine opportunity to sell a put spread on Micron. The stock is currently trading in a confirmed Bullish trend across multiple timeframes. By executing an out-of-the-money credit spread, we are capturing highly elevated implied volatility. This specific setup offers a nearly 1 to 1 risk-to-reward ratio, providing an excellent buffer while taking advantage of the underlying AI memory cycle tailwinds before the earnings binary occurs.
- Management:
- Stop Loss: Buy back the spread at $22.36 (100% of credit received).
- Take Profit: Buy back the spread at $5.59 (50% of max gain).
2. CL ($90.02): The Defensive Breakout

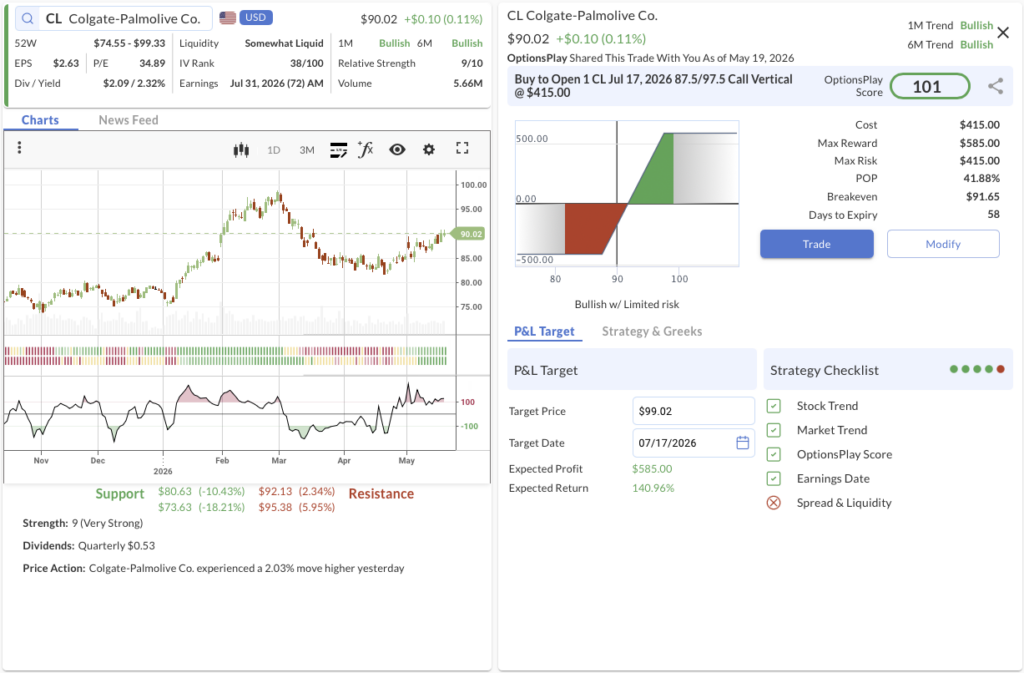
- We’re betting on: If Colgate-Palmolive continues its defensive outperformance and breaks through current resistance, the stock will extend its momentum toward the $99 upside target.
- The Trade: Buy to Open the CL Jul 17, 2026 87.5/97.5 Call Vertical @ $4.15 Debit.
- 🟢 BUY TO OPEN Jul 17, 2026 87.5 Call @ $5.15
- 🔴 SELL TO OPEN Jul 17, 2026 97.5 Call @ $1.00
- Trade Metrics: POP: 41.89% | Pay $415.00 per contract vs. a Max Reward of $585.00 (1.4:1).
- The Setup: Colgate-Palmolive (CL) just triggered our early breakout scans and is showing massive relative strength (9/10) compared to the broader market. In an environment where the 30-year yield is spiking and tech is bleeding, capital is rapidly rotating into high-quality, defensive consumer staples that exhibit pricing power. With the stock currently in a confirmed 1M and 6M Bullish trend, this debit spread provides a highly efficient structure to target a $99 upside objective.
- Management:
- Stop Loss: Sell the spread at $2.07 (50% loss on premium).
- Take Profit: Sell the spread at $7.26 (75% gain on premium).
NVDA, RLKB, ZS
OptionsPlay DailyPlay Ideas Menu – May 19th, 2026
What’s Driving The Market
- Tech Bleed and Dow Divergence: The new week opened with duration sensitive equities taking a hit as the 10-Year Treasury punched through 4.60% to a fresh 52-week high. The S&P 500 Information Technology sector fell over 1%, and the Nasdaq struggled to recover from intraday lows. Conversely, Financials, Energy, and Industrials anchored the Dow Jones, which advanced nearly 160 points. This highlights an internally bifurcated market where the broader S&P 500 finished essentially flat.
- The Yield Shock: The 10-Year yield at 4.60% to 4.61% is back at levels not seen in over a year. This is driven by hot April CPI and PPI prints, which confirm that wholesale inflation passthrough is firmly underway. The bond market is aggressively pricing in this inflation channel, which is being exacerbated by the ongoing constraints in the Strait of Hormuz.
- Oil Rebids Then Fades: Crude prices saw a strong bid initially, with WTI June futures advancing approximately 3% and Brent rising 2% to over $112 on aggressive weekend geopolitical rhetoric. However, the rally faded in extended trading, and Brent slipped back under $110 after reports surfaced that a scheduled military strike was called off to allow for regional negotiations. The two-way risk remains extreme as the IEA cautions that global inventories are depleting at a record pace.
- VIX Compression: Despite the rate shock, the VIX compressed by 3.31% to 17.82. This sub-18 level suggests that positioning remains constructive ahead of NVIDIA’s earnings on Wednesday and that the market is currently unwilling to pay up for tail hedges. Volatility is currently concentrated in single names and rates rather than the broader equity index, though this regime could shift quickly if NVIDIA misses guidance or if geopolitical negotiations break down.
💰 The Income Generators (High Probability, Cash Flow)
- NVDA: Bullish Put Spread capturing highly elevated implied volatility ahead of tomorrow’s earnings report as AI infrastructure demand remains robust.
- RKLB: Bullish Put Spread aggressively rolling a winning position to capture fresh premium as the space infrastructure leader extends its massive breakout.
🚀 The Growth Seekers (Higher Risk, Max Reward)
- ZS: Bullish Call Spread targeting a volume-driven breakout fueled by a strong cybersecurity read-through from Cisco’s earnings.
🛡️ The Portfolio Protectors (Hedges & Bearish Bets)
- (No trades in this category today)
1. NVDA ($222.32): The Earnings Premium

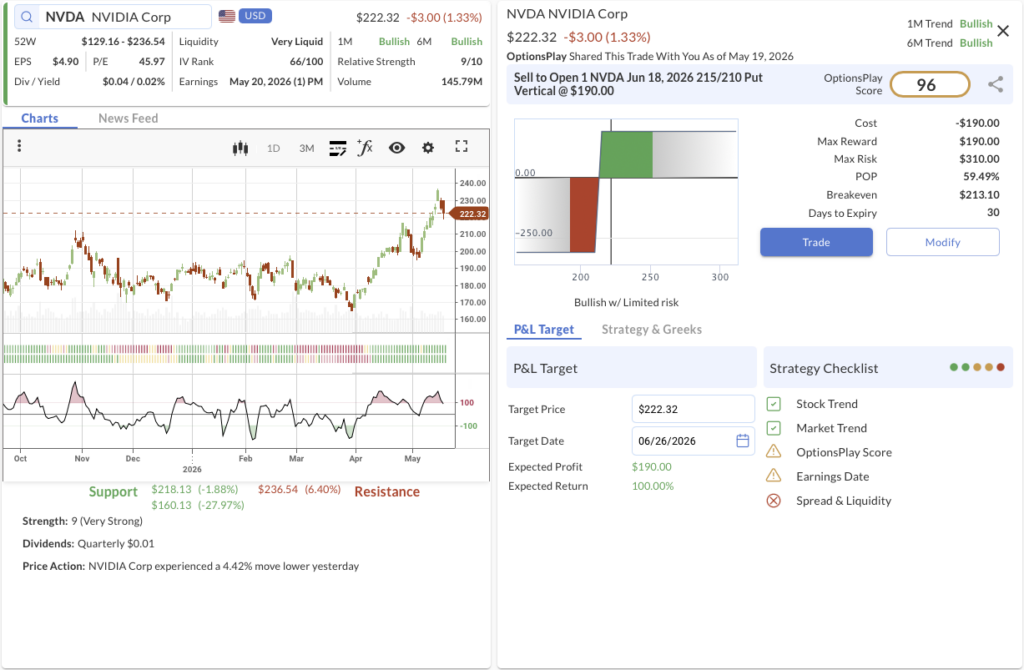
- We’re betting on: If NVIDIA delivers another strong quarter driven by hyperscaler AI spending and its stock holds structural support, this spread will rapidly decay as post-earnings volatility crushes.
- The Trade: Sell to Open the NVDA Jun 18, 2026 215/210 Put Vertical @ $1.90 Credit.
- 🟢 BUY TO OPEN Jun 18, 2026 210 Put @ $6.10
- 🔴 SELL TO OPEN Jun 18, 2026 215 Put @ $8.00
- Trade Metrics: POP: 59.50% | Collect $190.00 per contract vs. a Max Risk of $310.00 (0.6:1).
- The Setup: NVIDIA reports earnings tomorrow after the closing bell. The recent short-term price pullback provides an excellent opportunity to sell defined risk premium into the event. Fundamentally, NVIDIA remains the undisputed king of AI accelerators. Commentary from major cloud providers confirms that capital expenditure budgets are heavily skewed toward AI infrastructure, virtually guaranteeing robust demand for NVIDIA’s Blackwell and Hopper architectures. By utilizing a put credit spread, we can heavily capitalize on the elevated implied volatility ahead of the print while leaving plenty of cushion below the current price.
- Management:
- ⚠️ Warning: Earnings are scheduled for May 20 (tomorrow after the close), which guarantees immediate volatility and requires active management.
- Stop Loss: Buy back the spread at $3.80 (100% of credit received).
- Take Profit: Buy back the spread at $0.95 (50% of max gain).
2. ZS ($174.69): The Zero Trust Breakout

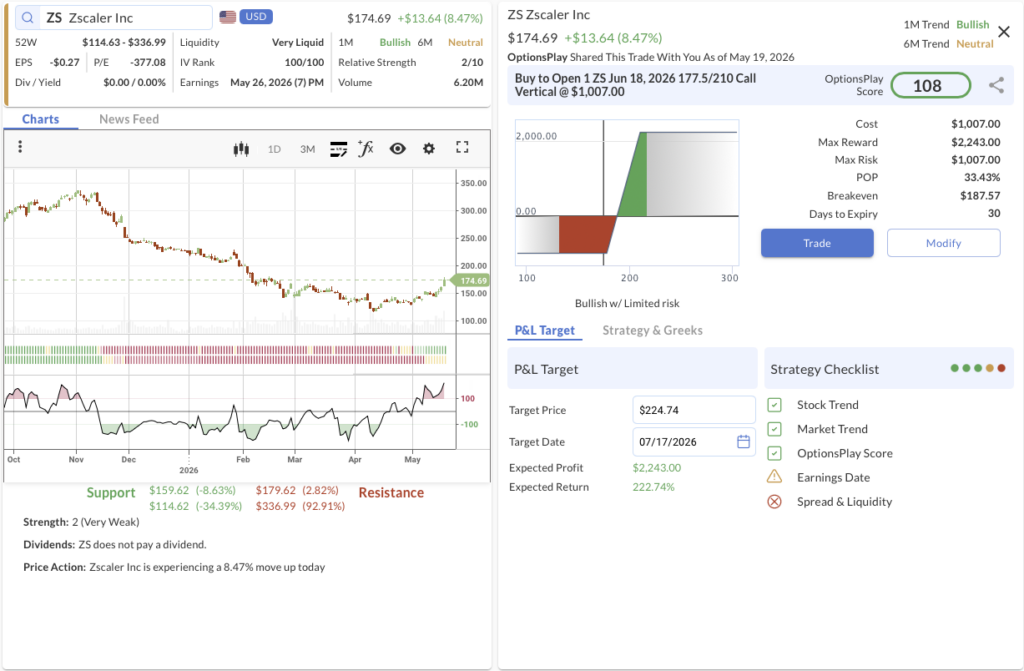
- We’re betting on: If Zscaler sustains its high-volume breakout and capitalizes on expanding enterprise security budgets, the stock will push aggressively toward our $210 target.
- The Trade: Buy to Open the ZS Jun 18, 2026 177.5/210 Call Vertical @ $10.07 Debit.
- 🟢 BUY TO OPEN Jun 18, 2026 177.5 Call @ $16.95
- 🔴 SELL TO OPEN Jun 18, 2026 210 Call @ $6.88
- Trade Metrics: POP: 33.43% | Pay $1,007.00 per contract vs. a Max Reward of $2,243.00 (2.2:1).
- The Setup: Zscaler is emerging as a powerful early breakout candidate on exceptionally strong volume. This move was directly catalyzed by Cisco’s earnings today, which provided a highly constructive read-through for the broader networking and cybersecurity sector. Fundamentally, as legacy corporate networks dissolve and remote AI applications expand, enterprise IT budgets are aggressively migrating toward Zscaler’s “Zero Trust” architecture. This long call spread offers a fantastic risk-to-reward ratio of greater than 2 to 1 as the stock targets the $210 level.
- Management:
- ⚠️ Warning: Earnings are scheduled for May 26, which requires active management prior to expiration.
- Stop Loss: Sell the spread at $5.03 (50% loss on premium).
- Take Profit: Sell the spread at $17.62 (75% gain on premium).
3. RKLB ($131.16): Hitting the Home Run

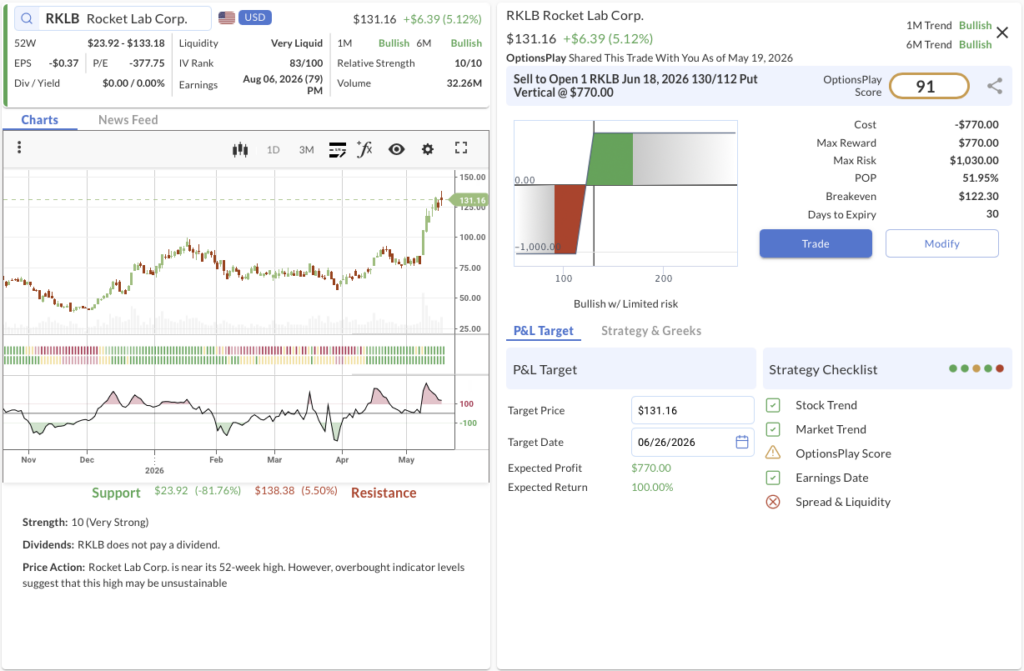
- We’re betting on: If Rocket Lab continues its relentless momentum and holds its freshly minted support levels, this aggressive credit spread will generate outsized income through mid-June.
- The Trade: Sell to Open the RKLB Jun 18, 2026 130/112 Put Vertical @ $7.70 Credit.
- 🟢 BUY TO OPEN Jun 18, 2026 112 Put @ $7.45
- 🔴 SELL TO OPEN Jun 18, 2026 130 Put @ $15.15
- Trade Metrics: POP: 51.96% | Collect $770.00 per contract vs. a Max Risk of $1,030.00 (0.7:1).
- The Setup: Our previous RKLB trade from May 11th has rapidly captured 57% of its max profit. Instead of sitting idle, the stock has generated a brand new buy signal as it consolidates near 52-week highs. Fundamentally, Rocket Lab is separating itself from the speculative space pack, leveraging consistent launch success, deep defense sector integration, and massive progress on its larger Neutron vehicle. The market is increasingly treating RKLB as the premier pure-play space infrastructure asset. We are leaning into this profitable trend to hit a home run by rolling into a fresh, high-premium credit spread.
- Management:
- Stop Loss: Buy back the spread at $15.40 (100% of credit received).
- Take Profit: Buy back the spread at $3.85 (50% of max gain).
COP, CCJ
OptionsPlay DailyPlay Ideas Menu – May 18th, 2026
What’s Driving The Market
- Summit Outcomes: Trump and Xi’s Beijing meeting concluded with the current policies on Taiwan, export controls, and Iran mediation remaining unchanged. The primary deliverable was a 200-jet Boeing order, which was below the 500 initially discussed prior to the trip. Boeing shares declined approximately 4% as the market digested the impact on the aerospace sector and the broader China-exposed equity complex. Market analysts generally viewed the meeting as maintaining the status quo.
- Crude Relights the Fuse: With the US and Iran ceasefire reportedly struggling and the Strait of Hormuz effectively closed, fresh naval fire exchanges pushed Brent crude through $109 and WTI above $105. The IEA has formally labeled this the largest oil supply disruption in market history, driving the national gas average up a consecutive 25 cents to $4.52 per gallon.
- Yields Shift the Curve: Hot April inflation (+3.8% y/y CPI) and compounding PPI data triggered a sharp breakout on the long end of the yield curve. The 10Y yield spiked to 4.59% and the 30Y topped 5.10%, effectively erasing rate-cut hopes for the year and pushing rate-hike odds to nearly 39%.
- Tech Bears the Brunt: As duration risk repriced, the AI and semiconductor complex sold off. NVIDIA shed roughly 4% heading into earnings, and Micron dropped over 4% amid Samsung HBM strike risks. Meanwhile, a 6% weekly drop in the SPDR S&P Retail ETF serves as a quiet indicator of consumer strain under the weight of rising gas prices.
💰 The Income Generators (High Probability, Cash Flow)
- COP: Bullish Put Spread capturing high premium as energy structural tailwinds support a breakout toward the $135 upside target.
🚀 The Growth Seekers (Higher Risk, Max Reward)
- (No trades in this category today)
🛡️ The Portfolio Protectors (Hedges & Bearish Bets)
- CCJ: Bearish Put Spread fading a stretched valuation that aggressively prices in long-term demand realization in a rising rate environment.
1. COP ($122.41): The Geopolitical Premium

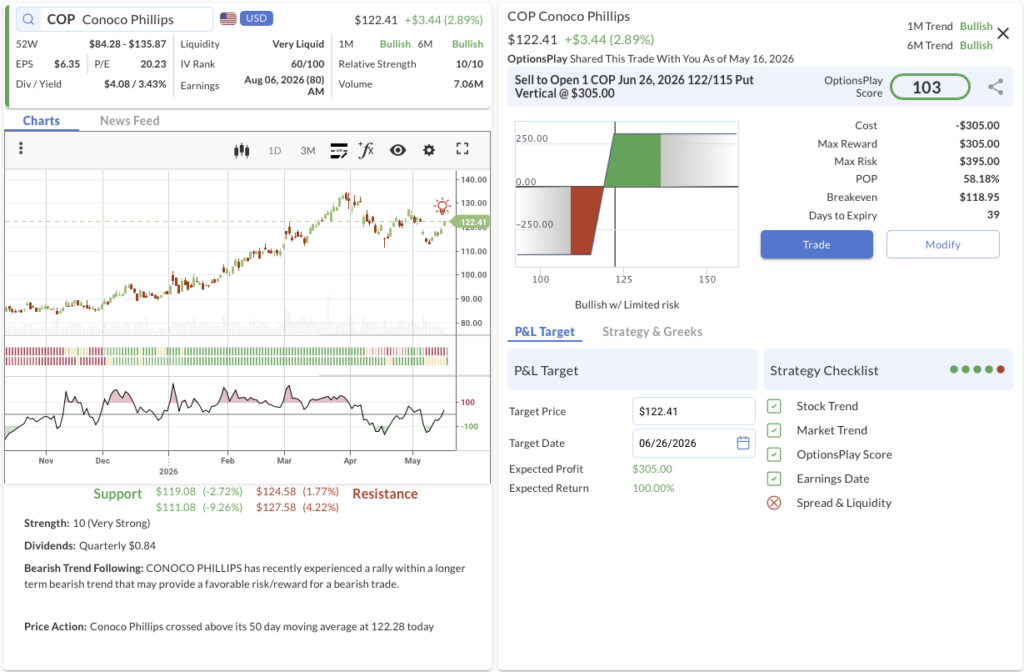
- We’re betting on: If global crude supply disruptions intensify and geopolitical gridlock in the Middle East persists, ConocoPhillips will hold its breakout momentum and remain safely above our $122 short strike through late June.
- The Trade: Sell to Open the COP Jun 26, 2026 122/115 Put Vertical @ $3.05 Credit.
- 🟢 BUY TO OPEN Jun 26, 2026 115 Put @ $2.15
- 🔴 SELL TO OPEN Jun 26, 2026 122 Put @ $5.20
- Trade Metrics: POP: 58.18% | Collect $305.00 per contract vs. a Max Risk of $395.00 (1.3:1).
- The Setup: Energy is aggressively back in play. With the Strait of Hormuz continuing to be closed, no clear path for de-escalation in Iran, and Brent crude pushing through $109 per barrel, top-tier domestic producers are perfectly positioned to capture the pricing upside of this historic supply disruption. Technically, the stock is in a confirmed Bullish trend across multiple timeframes with a perfect 10/10 Relative Strength score. Selling an at-the-money put spread allows us to generate cash flow while the stock pushes toward its $135 target.
- Management:
- Stop Loss: Buy back the spread at $6.10 (100% of credit received).
- Take Profit: Buy back the spread at $1.52 (50% of max gain).
2. CCJ ($107.51): Pricing in Perfection

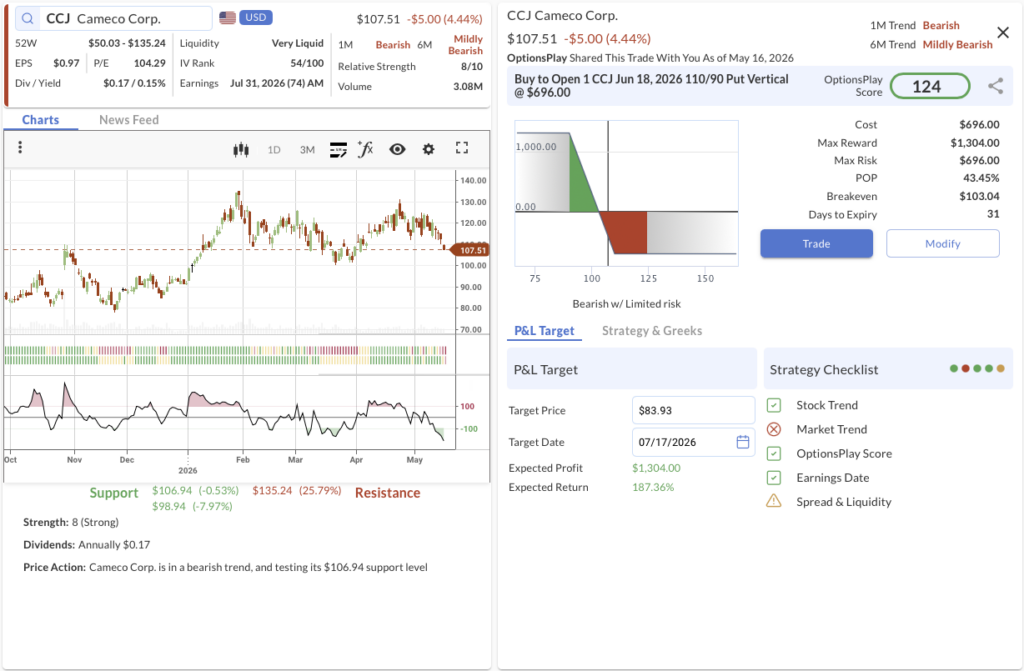
- We’re betting on: If duration risk continues to reprice and the market punishes extreme valuations, Cameco will break below its structural support and accelerate toward our $90 downside target.
- The Trade: Buy to Open the CCJ Jun 18, 2026 110/90 Put Vertical @ $6.96 Debit.
- 🔴 SELL TO OPEN Jun 18, 2026 90 Put @ $1.19
- 🟢 BUY TO OPEN Jun 18, 2026 110 Put @ $8.15
- Trade Metrics: POP: 43.45% | Pay $696.00 per contract vs. a Max Reward of $1,304.00 (1.9:1).
- The Setup: Cameco has undoubtedly delivered on the uranium thesis, but at 92.5x forward earnings and 18.2x sales, the stock is priced for absolute perfection. It is currently pricing in flawless Small Modular Reactor (SMR) and data-center demand realization that is structurally 5 to 10 years out. In an environment where the 10Y yield just broke out to 4.59%, stocks trading at these extreme multiples are highly vulnerable. With the stock entering a confirmed Bearish trend and testing its $106.94 support level, this debit spread is perfectly positioned to capture a breakdown.
- Management:
- Stop Loss: Sell the spread at $3.48 (50% loss on premium).
- Take Profit: Sell the spread at $12.18 (75% gain on premium).
ORCL, PEP
OptionsPlay DailyPlay Ideas Menu – May 15th, 2026
💰 The Income Generators (High Probability, Cash Flow)
- ORCL: Bullish Put Spread rolling up a highly successful previous position, capitalizing on expanding cloud infrastructure demand and aggressive AI contract wins.
🚀 The Growth Seekers (Higher Risk, Max Reward)
- (No trades in this category today)
🛡️ The Portfolio Protectors (Hedges & Bearish Bets)
- PEP: Bearish Put Spread aggressively adding to a winning short position as consumer pricing fatigue and volume weakness trigger a fresh technical sell signal.
1. ORCL ($195.61) – The Cloud Infrastructure Roll

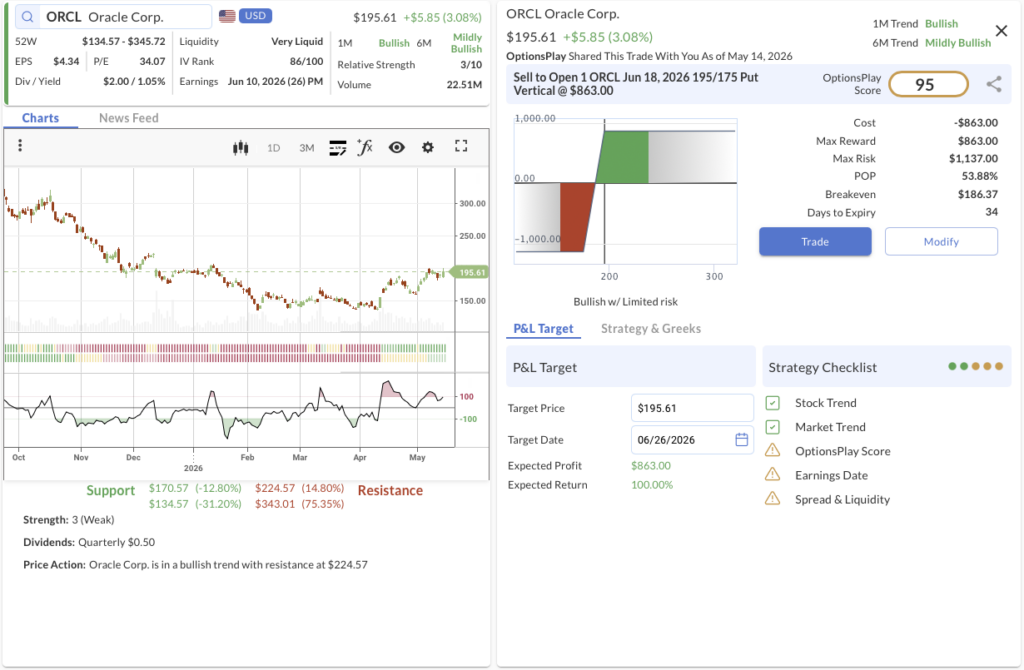
- We’re betting on: If Oracle maintains its bullish trajectory and continues to win mega-cap AI workloads, the stock will securely hold its newly established support base and keep this spread safely out-of-the-money.
- The Trade: Sell to Open the ORCL Jun 18, 2026 195/175 Put Vertical @ $8.63 Credit.
- 🟢 BUY TO OPEN Jun 18, 2026 175 Put @ $7.60
- 🔴 SELL TO OPEN Jun 18, 2026 195 Put @ $16.23
- Trade Metrics: POP: 53.88% | Collect $863.00 per contract vs. a Max Risk of $1,137.00 (1.3:1).
- The Setup: On April 20th, we initiated a bullish short put vertical on ORCL that has now beautifully captured over 80% of its max gain. With the stock in a confirmed 1M and 6M Bullish trend, we are taking profits and rolling the position up to capture fresh premium. Fundamentally, Oracle is proving its cloud infrastructure (OCI) is a formidable competitor to AWS and Azure, specifically for massive AI training and inference clusters. As legacy database clients continue their lucrative migrations to the cloud, Oracle’s margin profile provides a robust fundamental floor to support this technical momentum.
- Management:
- ⚠️ Warning: Earnings are scheduled for Jun 10, which requires active management prior to expiration.
- Stop Loss: Buy back the spread at $17.26 (100% of credit received).
- Take Profit: Buy back the spread at $4.31 (50% of max gain).
2. PEP ($148.67) – Pressing the Staples Breakdown

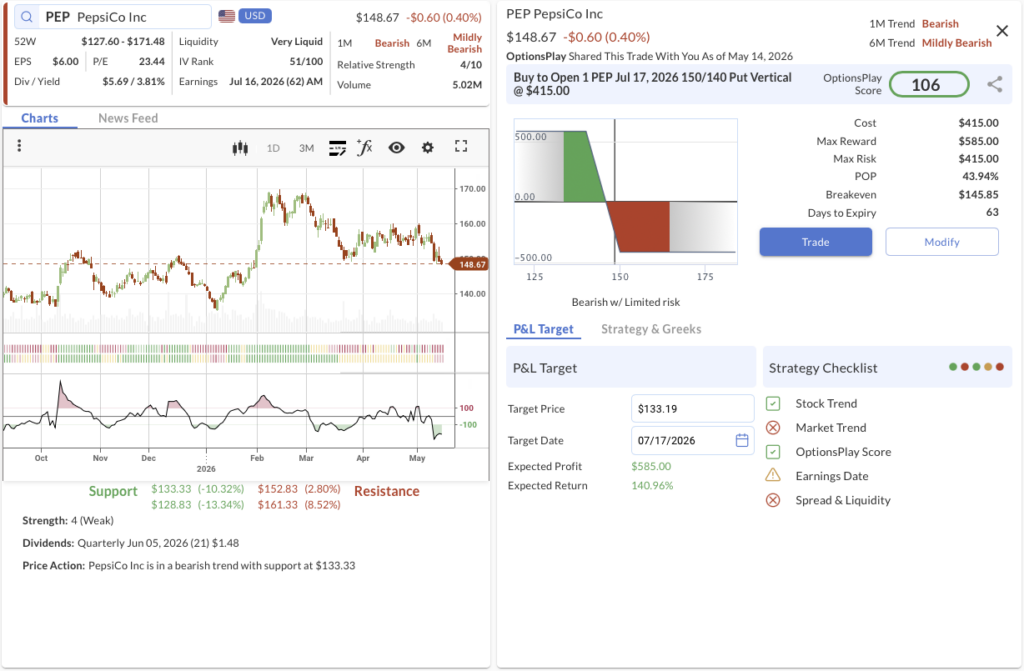
- We’re betting on: If consumer staples continue to suffer from margin compression and volume weakness, PepsiCo will accelerate its technical breakdown, maximizing the value of this debit spread.
- The Trade: Buy to Open the PEP Jul 17, 2026 150/140 Put Vertical @ $4.15 Debit.
- 🔴 SELL TO OPEN Jul 17, 2026 140 Put @ $3.15
- 🟢 BUY TO OPEN Jul 17, 2026 150 Put @ $7.30
- Trade Metrics: POP: 43.93% | Pay $415.00 per contract vs. a Max Reward of $585.00 (1.4:1).
- The Setup: Our initial bearish trade on PEP from May 11th is already up 40%. The stock has just sliced through critical support levels and generated a fresh sell signal, giving us the perfect technical setup to aggressively add to our short exposure. Fundamentally, the consumer staples sector is facing a toxic mix: years of aggressive price hikes have finally hit a wall of consumer resistance, resulting in stagnant or declining unit volumes. Compounded by a “higher-for-longer” rate environment that punishes traditional dividend proxies, PEP’s path of least resistance remains lower.
- Management:
- ⚠️ Warning: Earnings are scheduled for Jul 16, which requires active management right before expiration.
- Stop Loss: Sell the spread at $2.07 (50% loss on premium).
- Take Profit: Sell the spread at $7.26 (75% gain on premium).
MRVL, SONY, AXP
OptionsPlay DailyPlay Ideas Menu – May 14th, 2026
💰 The Income Generators (High Probability, Cash Flow)
- MRVL: Bullish Put Spread rolling a highly successful previous position, capitalizing on robust AI networking demand and custom silicon growth.
🚀 The Growth Seekers (Higher Risk, Max Reward)
- SONY: Bullish Call Spread targeting a volume-driven breakout supported by a fundamental recovery in image sensors for the AI and automotive markets.
🛡️ The Portfolio Protectors (Hedges & Bearish Bets)
- AXP: Bearish Put Spread hedging against a technical breakdown as persistent inflation and $5 gas pressure consumer travel and entertainment spending.
1. MRVL ($177.95) – The AI Networking Engine

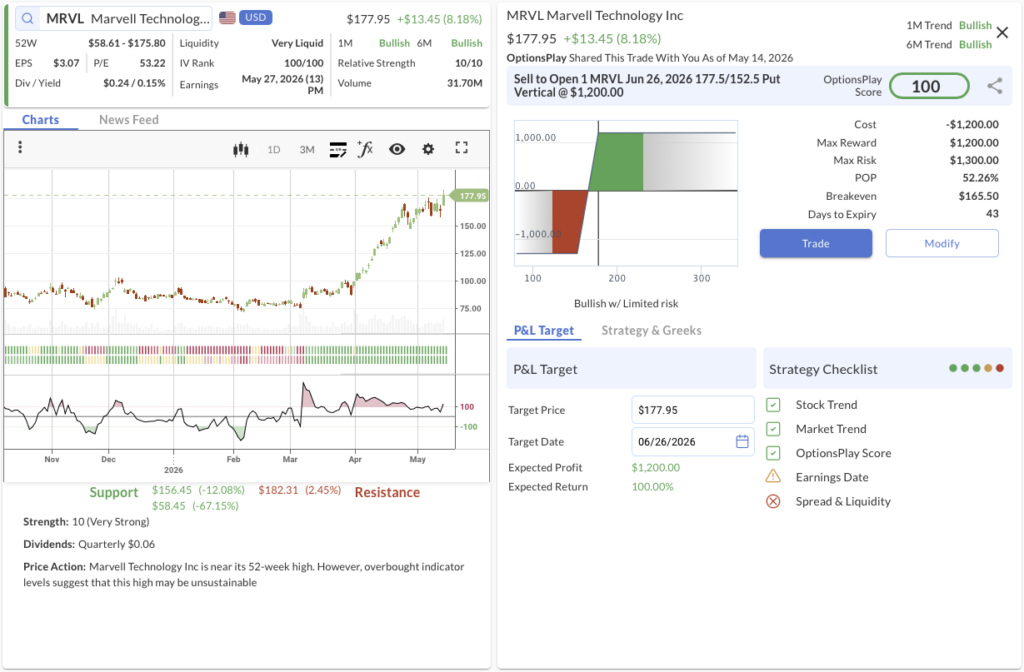
- We’re betting on: If Marvell maintains its bullish momentum and continues to dominate the data center interconnect and custom ASIC markets, the stock will stay safely above our elevated $177.50 strike through late June.
- The Trade: Sell to Open the MRVL Jun 26, 2026 177.5/152.5 Put Vertical @ $12.00 Credit.
- 🟢 BUY TO OPEN Jun 26, 2026 152.5 Put @ $9.85
- 🔴 SELL TO OPEN Jun 26, 2026 177.5 Put @ $21.85
- Trade Metrics: POP: 52.26% | Collect $1,200.00 per contract vs. a Max Risk of $1,300.00 (0.9:1).
- The Setup: Our previous MRVL trade from April 7th has successfully captured nearly 100% of its max gain, and the stock just triggered another clear buy signal. We are leaning into this strength by initiating a credit spread that collects massive income—over 45% of the vertical width. Fundamentally, Marvell is a critical bottleneck supplier for AI infrastructure, providing the electro-optics and custom silicon required to network massive GPU clusters together. This structural tailwind provides a powerful floor for the stock.
- Management:
- ⚠️ Warning: Earnings are scheduled for May 27, which requires active management prior to expiration.
- Stop Loss: Buy back the spread at $24.00 (100% of credit received).
- Take Profit: Buy back the spread at $6.00 (50% of max gain).
2. SONY ($22.79) – The Sensor Breakout

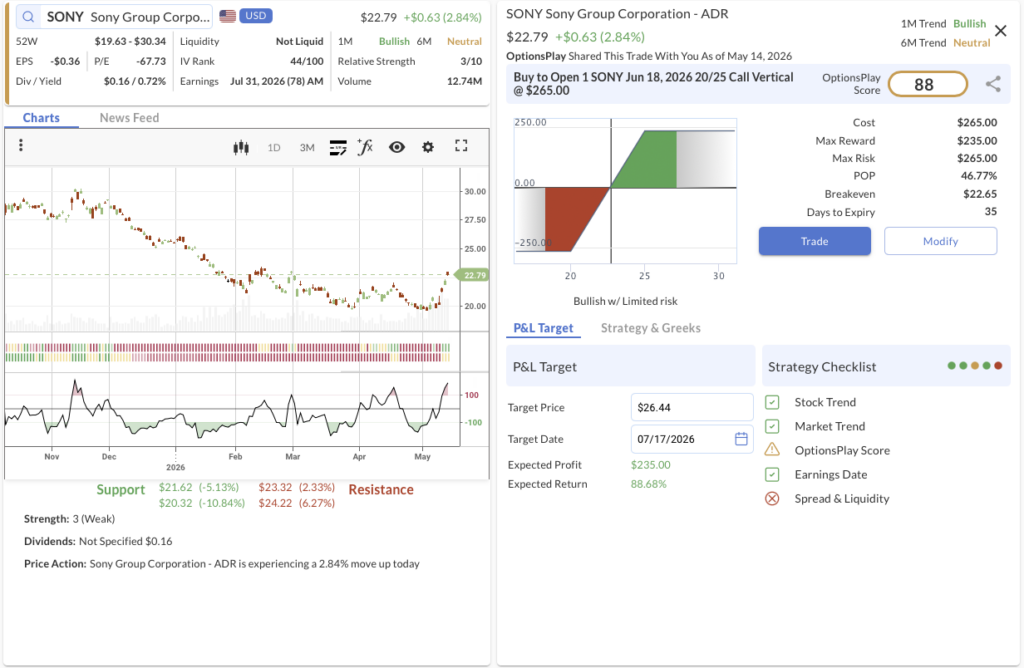
- We’re betting on: If Sony continues its volume-driven breakout and fundamentals accelerate, the stock will push toward our $25 target, heavily expanding the value of this debit spread.
- The Trade: Buy to Open the SONY Jun 18, 2026 20/25 Call Vertical @ $2.65 Debit.
- 🟢 BUY TO OPEN Jun 18, 2026 20 Call @ $3.15
- 🔴 SELL TO OPEN Jun 18, 2026 25 Call @ $0.50
- Trade Metrics: POP: 46.77% | Pay $265.00 per contract vs. a Max Reward of $235.00 (0.8:1).
- The Setup: Sony is an early breakout candidate showing exceptional volume after cleanly breaking above the $22 resistance level. It is now targeting a move toward $25. Fundamentally, the company is experiencing a compelling recovery in its core image sensor business. As global smartphone markets stabilize and the AI and autonomous automotive sectors demand increasingly advanced visual inputs, Sony’s dominant market share in image sensors provides a highly visible growth path.
- Management:
- Stop Loss: Sell the spread at $1.33 (50% loss on premium).
- Take Profit: Sell the spread at $4.64 (75% gain on premium).
3. AXP ($309.61) – Fading the Consumer

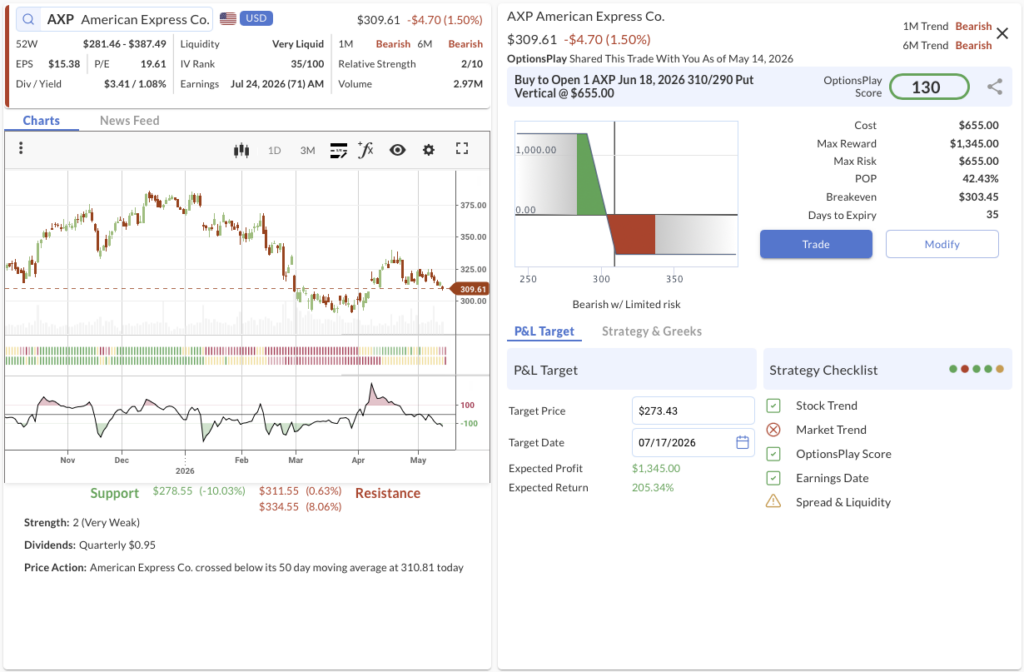
- We’re betting on: If consumer spending fatigue and high energy costs pressure American Express’s transaction volumes, the stock will accelerate its breakdown toward the $290 support zone.
- The Trade: Buy to Open the AXP Jun 18, 2026 310/290 Put Vertical @ $6.55 Debit.
- 🔴 SELL TO OPEN Jun 18, 2026 290 Put @ $3.98
- 🟢 BUY TO OPEN Jun 18, 2026 310 Put @ $10.53
- Trade Metrics: POP: 42.42% | Pay $655.00 per contract vs. a Max Reward of $1,345.00 (2.1:1).
- The Setup: American Express is exhibiting notable technical weakness, having recently broken down below its 50-day moving average. This triggers a technical downside target of $290. Fundamentally, the premium consumer is finally beginning to show cracks. Persistent inflation and a sticky $5-per-gallon gas environment are heavily pressuring discretionary spending, specifically the travel and entertainment (T&E) volumes that serve as the primary growth engine for AXP. This long put spread offers a highly efficient 2-to-1 risk/reward profile to capitalize on the rollover.
- Management:
- Stop Loss: Sell the spread at $3.27 (50% loss on premium).
- Take Profit: Sell the spread at $11.46 (75% gain on premium).
DELL, SE
OptionsPlay DailyPlay Ideas Menu – May 13th, 2026
💰 The Income Generators (High Probability, Cash Flow)
- DELL: Bullish Put Spread rolling a highly successful previous position, capitalizing on massive AI infrastructure backlog and sustained server demand.
🚀 The Growth Seekers (Higher Risk, Max Reward)
- SE: Bullish Call Spread targeting a bearish-to-bullish trend reversal backed by accelerating e-commerce growth and strong regional execution.
🛡️ The Portfolio Protectors (Hedges & Bearish Bets)
- (No trades in this category today)
1. DELL ($238.94) – The Infrastructure Engine

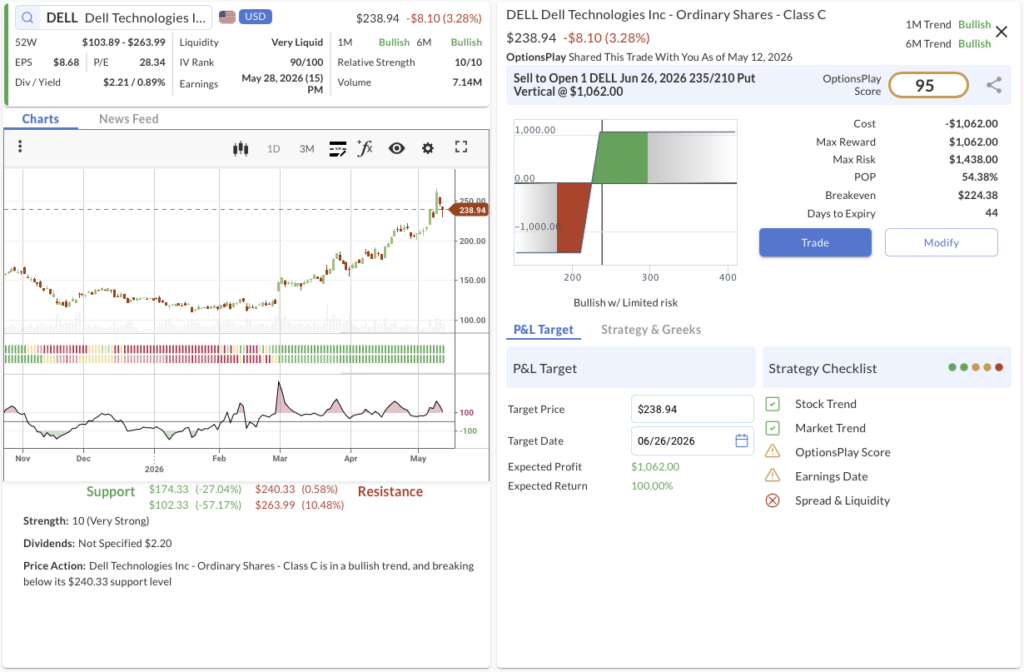
- We’re betting on: If Dell maintains its structural momentum as a dominant force in AI server infrastructure, the stock will continue to hold its elevated support and keep this spread safely out-of-the-money.
- The Trade: Sell to Open the DELL Jun 26, 2026 235/210 Put Vertical @ $10.62 Credit.
- 🟢 BUY TO OPEN Jun 26, 2026 210 Put @ $10.48
- 🔴 SELL TO OPEN Jun 26, 2026 235 Put @ $21.10
- Trade Metrics: POP: 54.38% | Collect $1,062.00 per contract vs. a Max Risk of $1,438.00 (1.4:1).
- The Setup: DELL was a trade idea from April 29th that has already gained 53% of the max reward and just triggered a fresh bullish signal. We are initiating a new put credit spread here which collects an extremely attractive premium of over 42% of the vertical width. Fundamentally, Dell continues to cement its leadership in the AI server market. The company recently recorded $64 billion in AI orders and built a staggering $43 billion backlog, projecting its AI server revenues to near $50 billion by fiscal 2027. As the market increasingly shifts toward agentic AI systems requiring massive on-premise compute and high-throughput storage, Dell’s enterprise infrastructure is capturing immense demand.
- Management:
- ⚠️ Warning: Earnings is scheduled for May 28, which requires active management.
- Stop Loss: Buy back the spread at $21.24 (100% of credit received).
- Take Profit: Buy back the spread at $5.31 (50% of max gain).
2. SE ($96.02) – The Southeast Asian Inflection

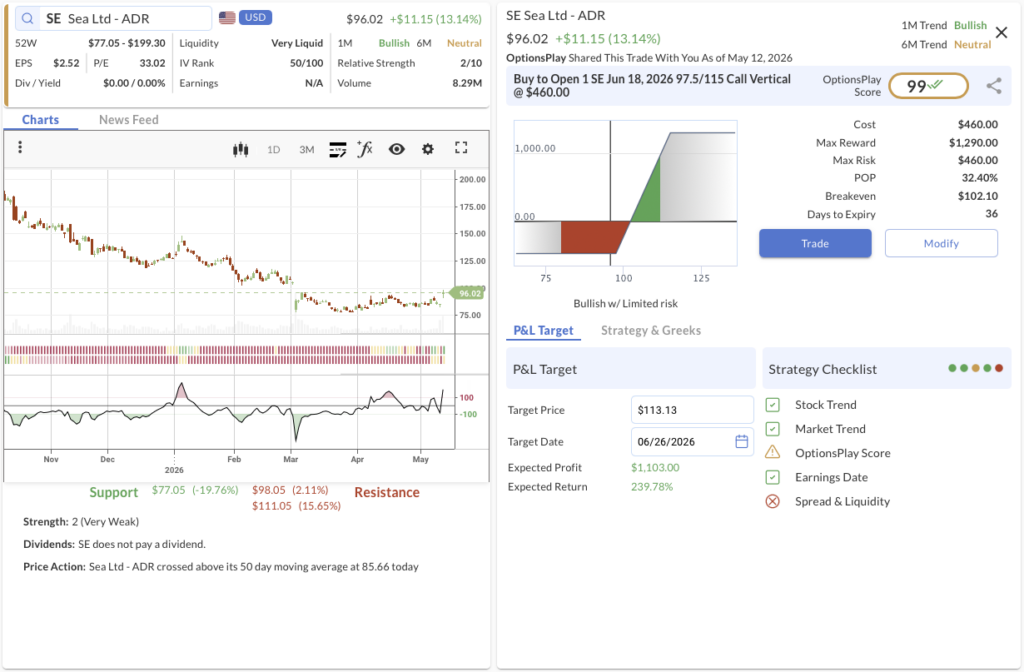
- We’re betting on: If Sea Limited continues to scale its e-commerce and fintech units with rigorous financial discipline, this technical breakout will accelerate toward our $110 target.
- The Trade: Buy to Open the SE Jun 18, 2026 97.50/115 Call Vertical @ $4.60 Debit.
- 🟢 BUY TO OPEN Jun 18, 2026 97.50 Call @ $5.98
- 🔴 SELL TO OPEN Jun 18, 2026 115 Call @ $1.38
- Trade Metrics: POP: 32.40% | Pay $460.00 per contract vs. a Max Reward of $1,290.00 (2.8:1).
- The Setup: Sea Limited (SE) appears to be in the early stages of a massive bearish-to-bullish trend reversal, staging a recent breakout above the $90 resistance level on high volume. This technical inflection point targets $110 on the upside and is backed by a blowout Q1 2026 earnings report, where Sea generated $7.1 billion in revenue—a 47% year-over-year increase. Adjusted EBITDA topped $1 billion for the very first time, while the core Shopee e-commerce division saw gross merchandise value (GMV) grow 30%. Additionally, the SeaMoney fintech unit scaled its loan book by 71% year-over-year. Management has demonstrated exceptional regional execution and cost discipline, reinforcing strong operational momentum despite conservative initial guidance.
- Management:
- Stop Loss: Sell the spread at $2.30 (50% loss on premium).
- Take Profit: Sell the spread at $8.05 (75% gain on premium).
CRCL, BIDU
OptionsPlay DailyPlay Ideas Menu – May 12th, 2026
💰 The Income Generators (High Probability, Cash Flow)
- CRCL: Bullish Put Spread leveraging a massive infrastructure moat in programmable money and the emerging agentic economy.
- BIDU: Bullish Put Spread capitalizing on an AI-driven breakout ahead of upcoming earnings as cloud infrastructure outpaces legacy search.
🚀 The Growth Seekers (Higher Risk, Max Reward)
- (No trades in this category today)
🛡️ The Portfolio Protectors (Hedges & Bearish Bets)
- (No trades in this category today)
1. CRCL ($131.53) – Building the Agentic Economy

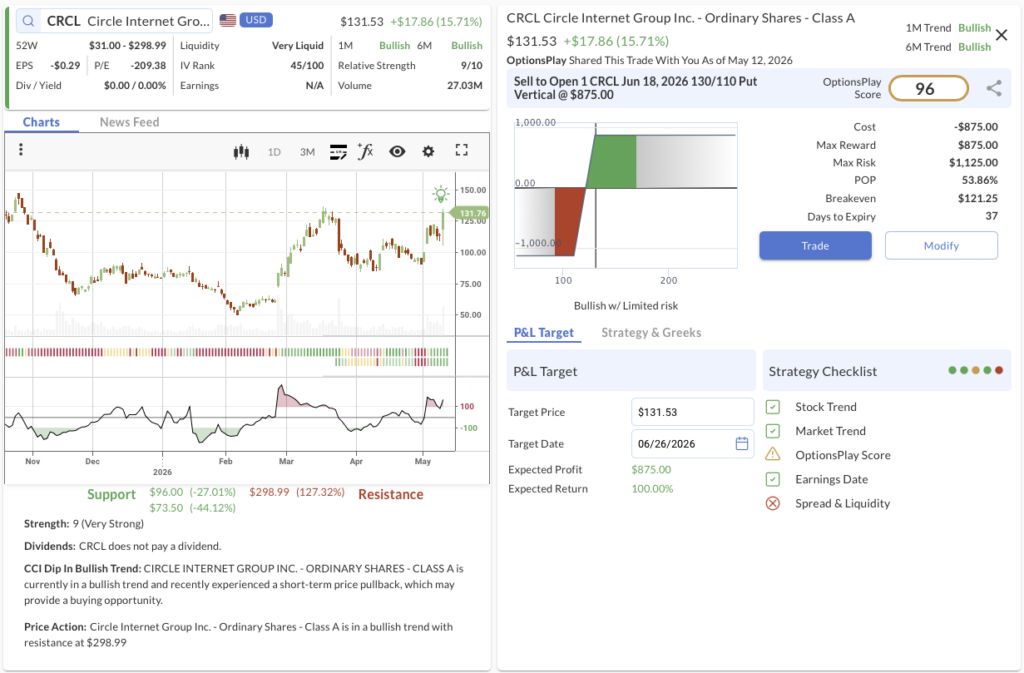
- We’re betting on: If Circle Internet Group maintains its bullish trajectory and continues to solidify its role as the foundational plumbing for institutional crypto, the stock will stay safely above our $130 strike through mid-June.
- The Trade: Sell to Open the CRCL Jun 18, 2026 130/110 Put Vertical @ $8.75 Credit.
- 🟢 BUY TO OPEN Jun 18, 2026 110 Put @ $5.90
- 🔴 SELL TO OPEN Jun 18, 2026 130 Put @ $14.65
- Trade Metrics: POP: 53.87% | Collect $875.00 per contract vs. a Max Risk of $1,125.00 (1.3:1).
- The Setup: Circle (CRCL) has surged +15.71% in a powerful momentum move. Fundamentally, we are highly bullish on the company’s overall vision. As the issuer of USDC, Circle is an interesting differentiator from pure-play crypto exchanges or Bitcoin proxies; it is building the full-stack infrastructure for programmable money and the “agentic economy” (AI agents executing autonomous transactions). This provides a massive structural moat. From a technical standpoint, the stock is in a confirmed Bullish trend on both the 1M and 6M timeframes, and this put spread offers an unusually favorable risk/reward profile given the elevated implied volatility.
- Management:
- Stop Loss: Buy back the spread at $17.50 (100% of credit received).
- Take Profit: Buy back the spread at $4.37 (50% of max gain).
2. BIDU ($145.78) – The AI Cloud Inflection

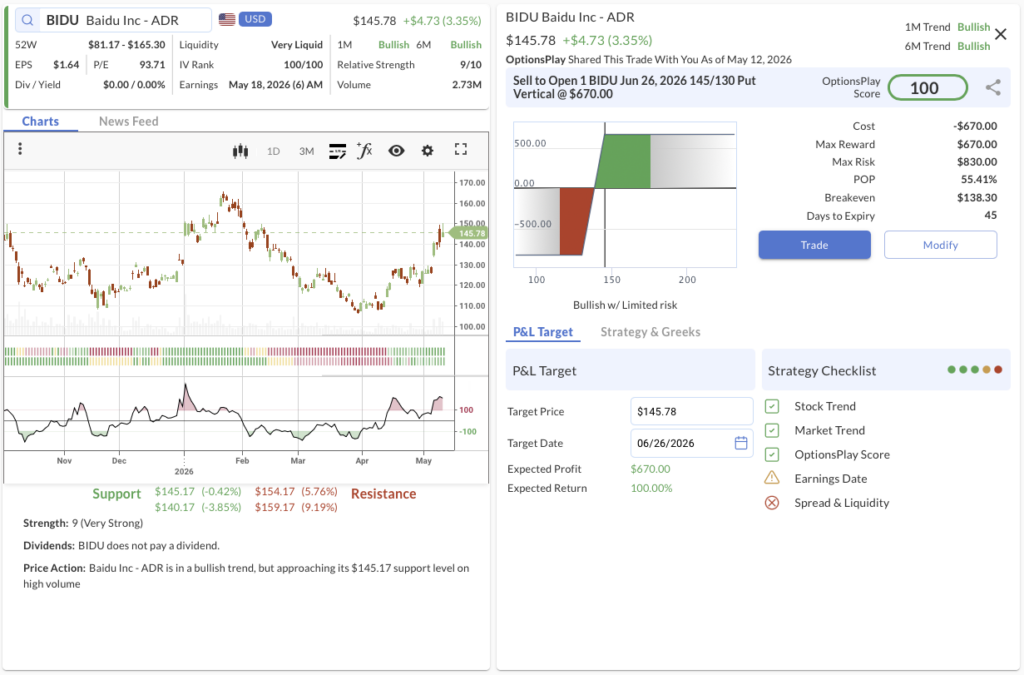
- We’re betting on: If Baidu’s upcoming earnings report validates the rapid scaling of its AI and Cloud businesses, the stock will maintain its breakout above former resistance and hold above our $145 strike.
- The Trade: Sell to Open the BIDU Jun 26, 2026 145/130 Put Vertical @ $6.70 Credit.
- 🟢 BUY TO OPEN Jun 26, 2026 130 Put @ $4.85
- 🔴 SELL TO OPEN Jun 26, 2026 145 Put @ $11.55
- Trade Metrics: POP: 55.41% | Collect $670.00 per contract vs. a Max Risk of $830.00 (1.2:1).
- The Setup: Baidu recently triggered a powerful technical breakout above $130, and is now testing support near $145 on high volume. Fundamentally, the narrative is shifting rapidly ahead of their Q1 2026 results (scheduled for pre-market on May 18). While legacy search and advertising revenues have been soft, Baidu’s AI-powered businesses—specifically its Cloud Infrastructure and Ernie-driven applications—are scaling rapidly and aggressively offsetting those declines. By selling this put spread just below the current price, we can collect rich premium while leaning on the stock’s maximum Relative Strength (9/10).
- Management:
- ⚠️ Warning: Earnings is scheduled for May 18, which requires active management.
- Stop Loss: Buy back the spread at $13.40 (100% of credit received).
- Take Profit: Buy back the spread at $3.35 (50% of max gain).
TSLA, RKLB, PEP
OptionsPlay DailyPlay Ideas Menu – May 11th, 2026
💰 The Income Generators (High Probability, Cash Flow)
- TSLA: Bullish Put Spread capitalizing on a major technical breakout supported by stabilizing EV pricing and momentum in autonomous driving approvals.
- RKLB: Bullish Put Spread leveraging a massive volume-driven breakout fueled by record revenue and expanding defense sector contracts.
🚀 The Growth Seekers (Higher Risk, Max Reward)
- (No trades in this category today)
🛡️ The Portfolio Protectors (Hedges & Bearish Bets)
- PEP: Bearish Put Spread fading a breakdown in consumer staples as volume weakness and high interest rates pressure the stock below structural support.
1. TSLA ($428.35) – The Autonomous Breakout

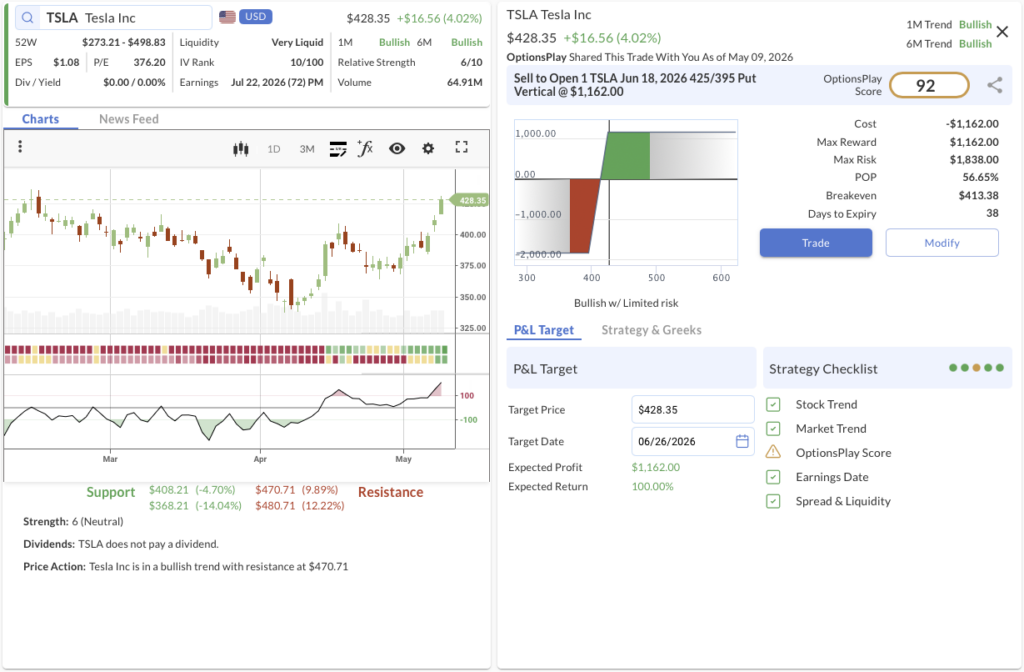
- We’re betting on: If Tesla sustains its breakout momentum above $410 and structural support holds, the stock will continue its push toward $440, allowing this credit spread to expire worthless.
- The Trade: Sell to Open the TSLA Jun 18, 2026 425/395 Put Vertical @ $11.62 Credit.
- 🟢 BUY TO OPEN Jun 18, 2026 395 Put @ $10.48
- 🔴 SELL TO OPEN Jun 18, 2026 425 Put @ $22.10
- Trade Metrics: POP: 56.68% | Collect $1,162.00 per contract vs. a Max Risk of $1,838.00 (1.6:1).
- The Setup: Tesla is breaking out above its $410 resistance level and targeting $440 while clearly outperforming the S&P 500. Fundamentally, the stock is catching a major bid as the prolonged EV price wars show signs of stabilization and recent Chinese delivery metrics topped expectations. Furthermore, positive regulatory momentum surrounding its Full Self-Driving (FSD) approvals and safety test milestones are reigniting the company’s growth premium. Selling an at-the-money put spread allows us to generate rich premium against this high-probability breakout.
- Management:
- Stop Loss: Buy back the spread at $23.24 (100% of credit received).
- Take Profit: Buy back the spread at $5.81 (50% of max gain).
2. RKLB ($105.55) – Escaping Gravity

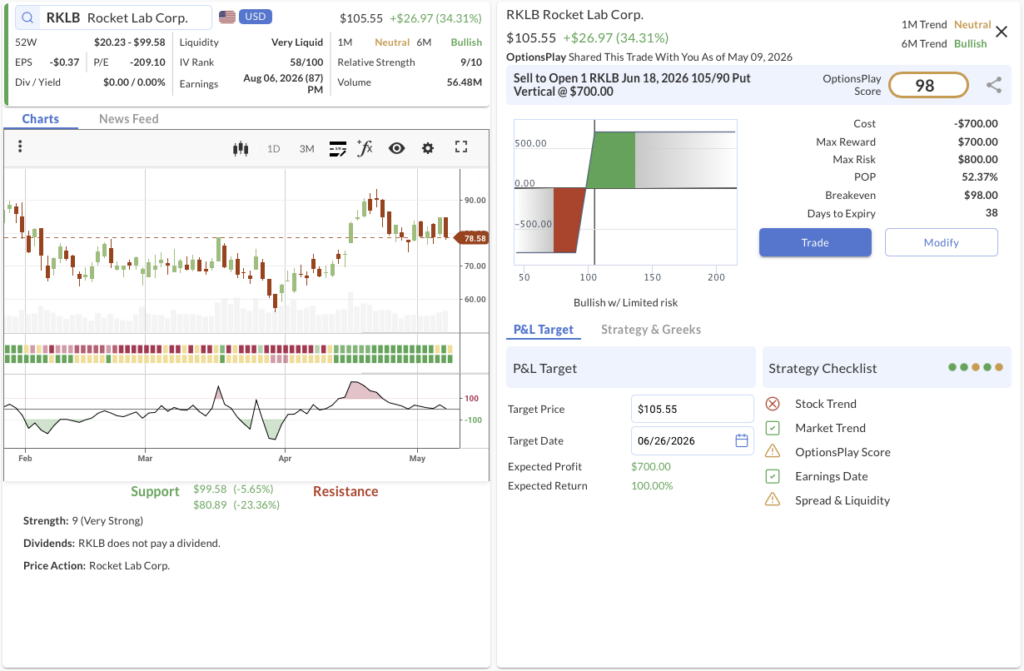
- We’re betting on: If Rocket Lab continues to ride its recent breakout on strong volume, the stock will extend its bullish trend safely above our short put strike through mid-June.
- The Trade: Sell to Open the RKLB Jun 18, 2026 105/90 Put Vertical @ $7.00 Credit.
- 🟢 BUY TO OPEN Jun 18, 2026 90 Put @ $5.75
- 🔴 SELL TO OPEN Jun 18, 2026 105 Put @ $12.75
- Trade Metrics: POP: 52.38% | Collect $700.00 per contract vs. a Max Risk of $800.00 (1.1:1).
- The Setup: Rocket Lab recently broke out above its $100 resistance on massive volume, completing a bullish double-top pattern and outperforming the broader market. From a fundamental perspective, the space infrastructure provider just delivered a blowout quarter featuring record revenue and an expanding operational backlog. A newly minted $30 million defense contract with Anduril Industries and strategic robotics acquisitions are solidifying its position as a top-tier space and defense contractor. This technical breakout, paired with undeniable fundamental momentum, provides a perfect setup to sell premium.
- Management:
- Stop Loss: Buy back the spread at $14.00 (100% of credit received).
- Take Profit: Buy back the spread at $3.50 (50% of max gain).
3. PEP ($154.62) – Fading the Staples

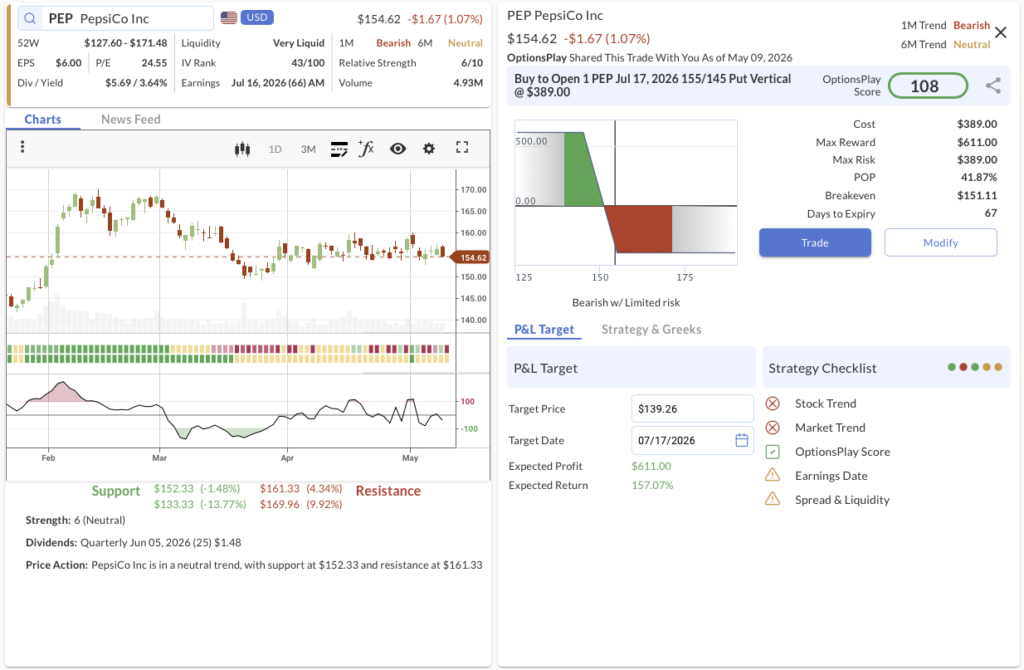
- We’re betting on: If PepsiCo breaks its critical structural support as consumer pushback pressures volumes, the stock will accelerate toward its $145 downside target, maximizing the value of this debit spread.
- The Trade: Buy to Open the PEP Jul 17, 2026 155/145 Put Vertical @ $3.89 Debit.
- 🔴 SELL TO OPEN Jul 17, 2026 145 Put @ $2.86
- 🟢 BUY TO OPEN Jul 17, 2026 155 Put @ $6.75
- Trade Metrics: POP: 41.82% | Pay $389.00 per contract vs. a Max Reward of $611.00 (1.6:1).
- The Setup: As PepsiCo heavily tests its $155 support level, its deteriorating relative performance to the S&P 500 suggests a high-probability breakdown toward our $145 target. Fundamentally, consumer staples are facing a highly restrictive environment: years of aggressive price hikes are finally meeting consumer resistance, leading to stagnant volumes. Additionally, the broader adoption of GLP-1 weight-loss drugs remains a lingering structural headwind for snack sales, and the “higher-for-longer” interest rate environment continues to punish traditional dividend proxies. This long put spread cleanly captures the downside risk.
- Management:
- Stop Loss: Sell the spread at $1.94 (50% loss on premium).
- Take Profit: Sell the spread at $6.81 (75% gain on premium).
AAPL, QQQ, VZ
OptionsPlay DailyPlay Ideas Menu – May 8th, 2026
💰 The Income Generators (High Probability, Cash Flow)
- AAPL: Bullish Put Spread leaning on strong relative strength and an impressive fundamental breakout driven by record product demand.
🚀 The Growth Seekers (Higher Risk, Max Reward)
- (No trades in this category today)
🛡️ The Portfolio Protectors (Hedges & Bearish Bets)
- QQQ: Bearish Put Spread hedging against low-volume, narrow-breadth exhaustion in mega-cap tech.
- VZ: Bearish Call Spread fading telecom relative weakness as massive debt loads collide with a hawkish macro environment.
1. AAPL ($287.44) – The Hardware Supercycle

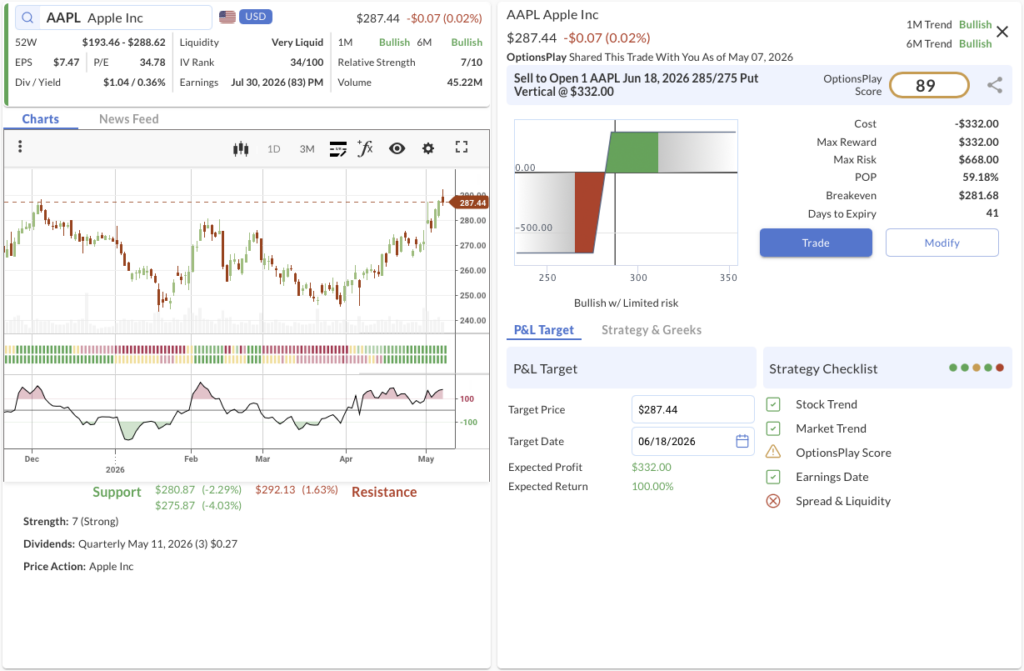
- We’re betting on: If Apple continues to exhibit structural relative strength and fundamental growth across its core product lines, the stock will maintain its breakout and hold safely above our $285 strike.
- The Trade: Sell to Open the AAPL Jun 18, 2026 285/275 Put Vertical @ $3.32 Credit.
- 🟢 BUY TO OPEN Jun 18, 2026 275 Put @ $4.18
- 🔴 SELL TO OPEN Jun 18, 2026 285 Put @ $7.50
- Trade Metrics: POP: 59.20% | Collect $332.00 per contract vs. a Max Risk of $668.00 (2.0:1).
- The Setup: Apple triggered our early breakout scan while continuing to strictly outperform the broader S&P 500. Fundamentally, this breakout is heavily supported by a blowout second-quarter earnings report where revenue hit $111.18 billion. The highly anticipated iPhone 17 lineup has seen extraordinary global demand, becoming the world’s best-selling smartphone. Alongside robust Mac and wearables sales, the Services business expanded 14% year-over-year to an all-time record of $30.01 billion. With a massive new $100 billion stock buyback authorization providing a firm fundamental floor, this put spread capitalizes on unquestionable momentum.
- Management:
- Stop Loss: Buy back the spread at $6.64 (100% of credit received).
- Take Profit: Buy back the spread at $1.66 (50% of max gain).
2. QQQ ($694.94) – Hedging the Air Pocket

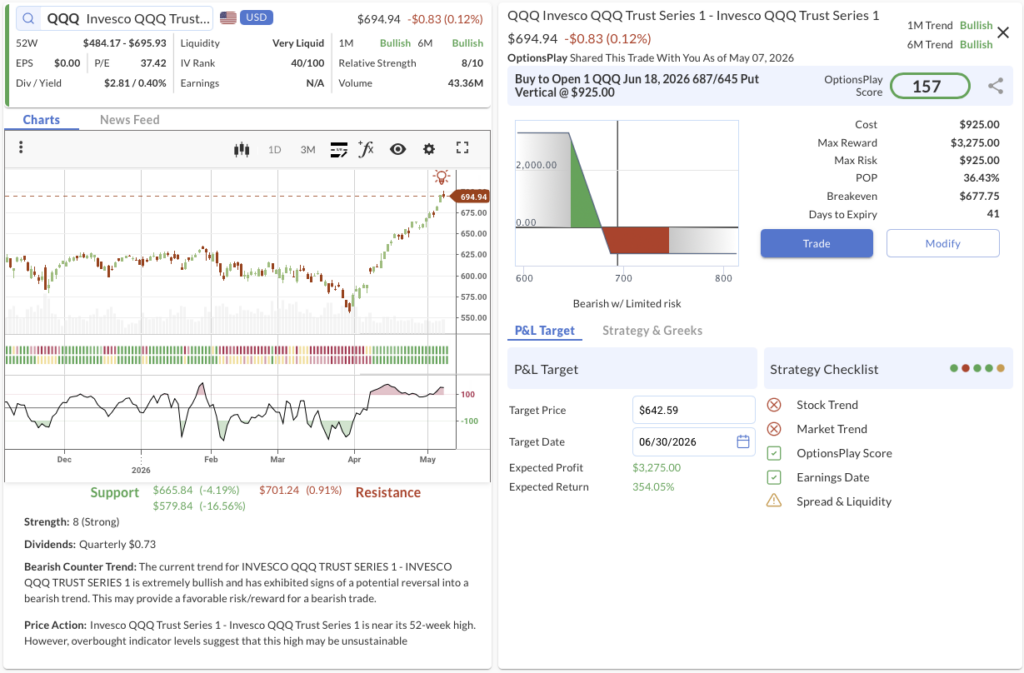
- We’re betting on: If the narrow, low-volume tech rally exhausts itself, the Nasdaq will experience a sharp mean-reversion event, rapidly expanding the value of this debit spread.
- The Trade: Buy to Open the QQQ Jun 18, 2026 687/645 Put Vertical @ $9.25 Debit.
- 🔴 SELL TO OPEN Jun 18, 2026 645 Put @ $5.61
- 🟢 BUY TO OPEN Jun 18, 2026 687 Put @ $14.86
- Trade Metrics: POP: 36.41% | Pay $925.00 per contract vs. a Max Reward of $3,275.00 (3.5:1).
- The Setup: With the recent 25% rally in the QQQ over the past five weeks occurring on below-average volume, the risk of a severe pullback is heavily elevated. The rally has been led almost entirely by a highly concentrated group of mega-cap tech names, making the index exceptionally vulnerable to exhaustion. Because there is very little structural support for the QQQ until the $615 level, we are utilizing an out-of-the-money put spread to cleanly hedge portfolio downside risk. We will look to aggressively add to this position if the broader markets begin to slip.
- Management:
- Stop Loss: Sell the spread at $4.62 (50% loss on premium).
- Take Profit: Sell the spread at $16.19 (75% gain on premium).
3. VZ ($47.09) – Disconnecting the Rally

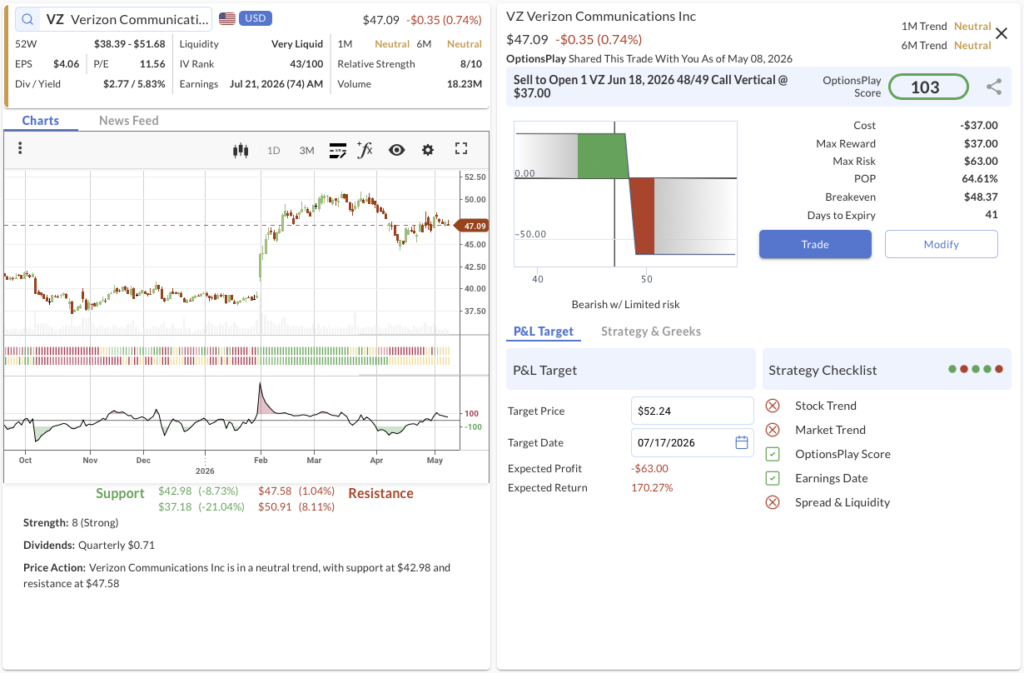
- We’re betting on: If heavily leveraged telecoms struggle against a “higher for longer” interest rate regime, Verizon’s technical breakdown will accelerate toward our $39 downside target.
- The Trade: Sell to Open the VZ Jun 18, 2026 48/49 Call Vertical @ $0.37 Credit.
- 🔴 SELL TO OPEN Jun 18, 2026 48 Call @ $1.08
- 🟢 BUY TO OPEN Jun 18, 2026 49 Call @ $0.71
- Trade Metrics: POP: 64.59% | Collect $37.00 per contract vs. a Max Risk of $63.00 (1.7:1).
- The Setup: With the broader market starting to show weakness, Verizon’s trend quality has deteriorated rapidly over the past month after failing to hold a new 52-week high. The stock has now triggered a bearish trend-following scan as relative weakness sets in. Fundamentally, despite recent retail subscriber additions, Verizon is burdened by a staggering $172.5 billion debt load following its recent acquisition of Frontier Communications. In a tape where the Fed remains pinned in a hawkish hold, heavily indebted and capital-intensive telecom stocks face significant margin pressure. Selling a call spread here allows us to fade the recent rally with a high probability of success.
- Management:
- Stop Loss: Buy back the spread at $0.74 (100% of credit received).
- Take Profit: Buy back the spread at $0.18 (50% of max gain).
NET, RDDT
OptionsPlay DailyPlay Ideas Menu – May 7th, 2026
💰 The Income Generators (High Probability, Cash Flow)
- NET: Bullish Put Spread capitalizing on a major technical breakout supported by robust edge-computing demand and AI infrastructure expansion.
- RDDT: Bullish Put Spread leaning on strong relative strength in the communications sector and highly profitable AI data licensing revenue.
🚀 The Growth Seekers (Higher Risk, Max Reward)
- (No trades in this category today)
🛡️ The Portfolio Protectors (Hedges & Bearish Bets)
- (No trades in this category today)
1. NET ($248.59) – The Edge Computing Breakout

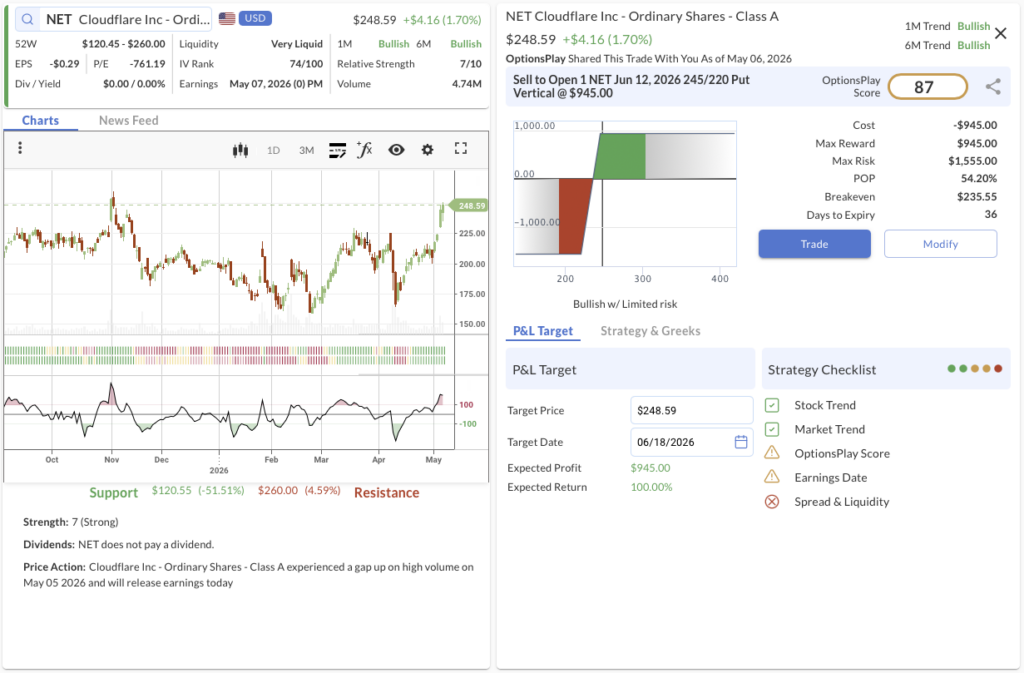
- We’re betting on: If Cloudflare sustains its breakout momentum and edge-network consumption remains robust, the stock will continue its push toward the $270 target and stay safely above our $245 strike through mid-June.
- The Trade: Sell to Open the NET Jun 12, 2026 245/220 Put Vertical @ $9.45 Credit.
- 🟢 BUY TO OPEN Jun 12, 2026 220 Put @ $10.55
- 🔴 SELL TO OPEN Jun 12, 2026 245 Put @ $20.00
- Trade Metrics: POP: 54.21% | Collect $945.00 per contract vs. a Max Risk of $1,555.00 (1.6:1).
- The Setup: Cloudflare’s technical breakout above the critical $230 level is highly constructive for further upside to our $270 target. Fundamentally, the company is proving it is much more than a content delivery network; its aggressive expansion into “Workers AI” and zero-trust security is capturing massive enterprise IT spend. Because inference at the edge is becoming a necessity for AI application performance, NET commands a premium multiple. This put spread allows us to capture rich premium while leaning on the newly established structural floor near $240.
- Management:
- Stop Loss: Buy back the spread at $18.90 (100% of credit received).
- Take Profit: Buy back the spread at $4.72 (50% of max gain).
2. RDDT ($166.56) – Monetizing the Community

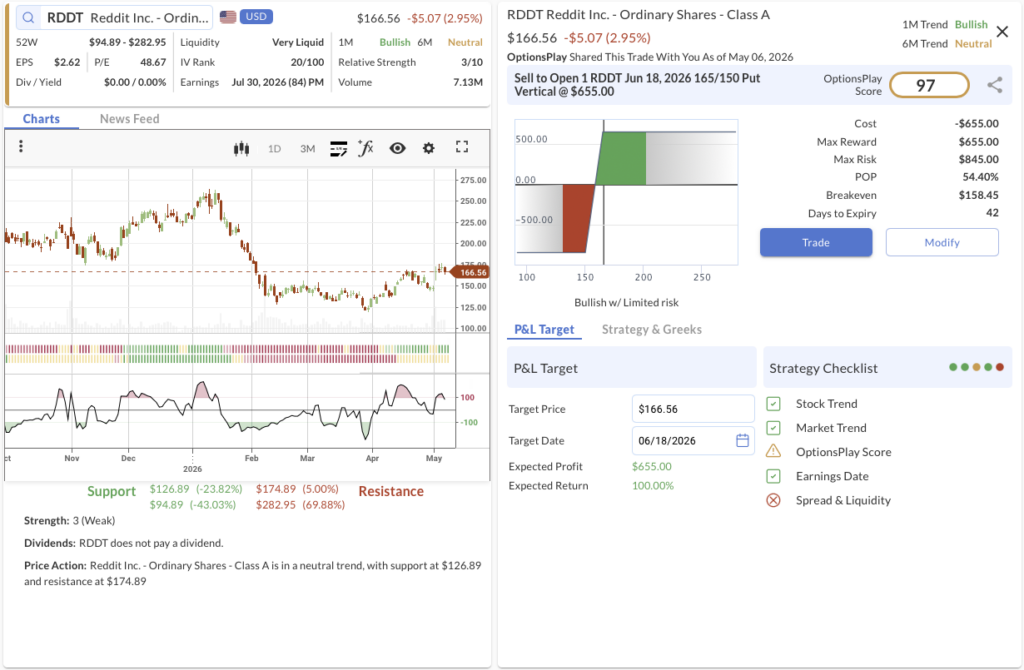
- We’re betting on: If Reddit maintains its robust user growth and high-margin AI data licensing agreements continue to pad the bottom line, the stock will push toward $190 and easily hold above our $165 strike.
- The Trade: Sell to Open the RDDT Jun 18, 2026 165/150 Put Vertical @ $6.55 Credit.
- 🟢 BUY TO OPEN Jun 18, 2026 150 Put @ $6.80
- 🔴 SELL TO OPEN Jun 18, 2026 165 Put @ $13.35
- Trade Metrics: POP: 54.41% | Collect $655.00 per contract vs. a Max Risk of $845.00 (1.3:1).
- The Setup: Reddit recently broke out above $160, setting up a technical trajectory toward a $190 upside target. This move is heavily supported by massive relative strength across the Communications sector. Underneath the hood, the fundamental thesis is anchored by their evolving revenue model. Beyond standard advertising growth, Reddit is successfully executing highly lucrative, 100%-margin data licensing deals with major hyperscalers to train LLMs. This unique data moat provides a strong fundamental floor, making a short put spread the optimal strategy to capture upside while mitigating directional risk.
- Management:
- Stop Loss: Buy back the spread at $13.10 (100% of credit received).
- Take Profit: Buy back the spread at $3.27 (50% of max gain).