
GE, MAR, ELV

OptionsPlay DailyPlay Ideas Menu – June 8th, 2026
What’s Driving The Market
- Healthy Internal Reallocation Rather Than Market Panic: While large-cap indices suffered steep declines led by an intense tech liquidation, the underlying market structure revealed a clean, orderly reallocation rather than a systemic panic event. Old-economy, dividend-paying, lower-multiple sectors cleanly absorbed capital fleeing long-duration growth. Staples, utilities, and healthcare finished green to reinforce a constructive cyclical backdrop.
- Bond Yields Rushed Higher on Hot Economic Data: Fixed-income markets shouldered the heavy lifting as the hot May employment report printed a blowout 172,000 against an 80,000 consensus. The massive payroll beat pushed the 10-year Treasury yield up to 4.55% and sent the 2-year yield ripping to 4.17%. Fed funds futures quickly adjusted to price in a 60% probability of at least one additional rate hike by year-end.
- Extreme Positioning Resets the Crowded AI Complex: The semiconductor space bore the brunt of the execution reset as the PHLX Semiconductor Index posted an intense single-day shakeout. Despite a fundamentally stellar headline print from Broadcom highlighting record AI-infrastructure traction, softer custom-silicon comments triggered a massive unwind of overbought positioning across primary semiconductor operators.
- Cross-Asset Volatility Signals Contained Equity Risk: Despite over a trillion dollars of technology market cap getting erased in a single session, the VIX remained remarkably well-behaved at 15. The containment of broad volatility indices alongside stable credit spreads and an orderly firming of the dollar confirms that the price action represents a healthy sector rotation rather than a structural regime breakdown.
💰 The Income Generators (High Probability, Cash Flow)
- GE: Bullish Put Spread aggressively compounding exposure following a high-volume confirmation of its major technical breakout.
🚀 The Growth Seekers (Higher Risk, Max Reward)
- MAR: Bullish Call Spread chasing a high-conviction breakout to new all-time highs on powerful relative volume.
- ELV: Bullish Call Spread capitalizing on an early defensive growth acceleration as capital leaves the tech complex.
🛡️ The Portfolio Protectors (Hedges & Bearish Bets)
- (No trades in this category today)
1. GE ($328.00): Compounding the Breakout

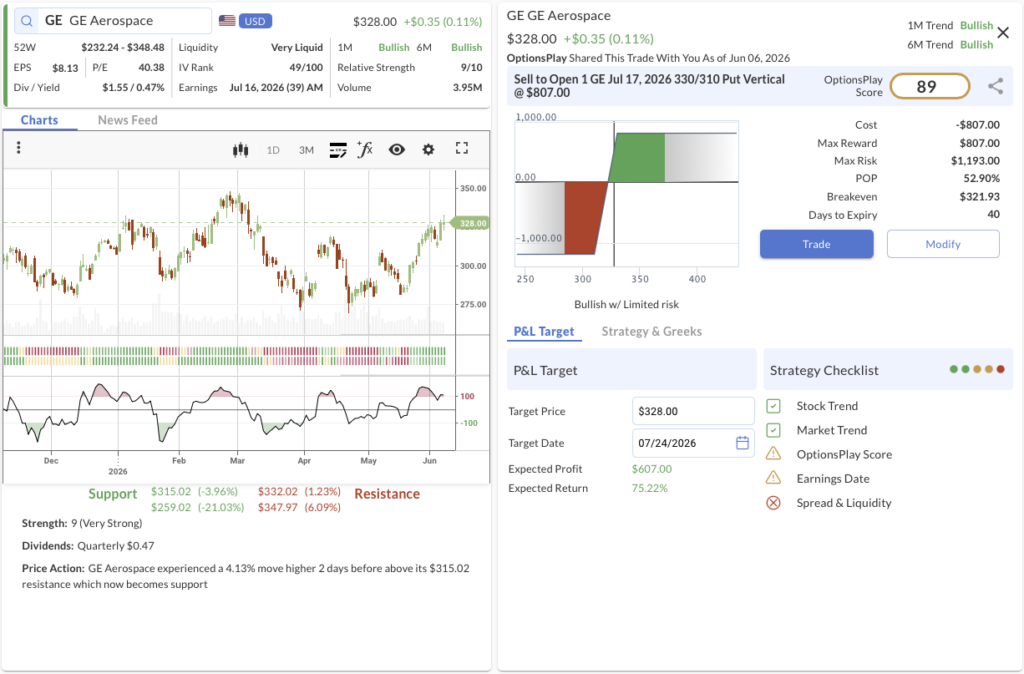
- We’re betting on: If GE Aerospace maintains its structural upward trajectory and translates old overhead resistance into firm baseline support, this credit spread will decay cleanly to capture max income.
- The Trade: Sell to Open the GE Jul 17, 2026 330/310 Put Vertical @ $8.07 Credit.
- 🟢 BUY TO OPEN Jul 17, 2026 310 Put @ $9.43
- 🔴 SELL TO OPEN Jul 17, 2026 330 Put @ $17.50
- Trade Metrics: POP: 52.90% | Collect $807.00 per contract vs. a Max Risk of $1,193.00 (1.48:1).
- The Setup: Following up on our initial bullish positioning from May 28th, GE is exhibiting exceptional market leadership. The stock advanced over 4% to secure a clear technical breakout past its heavy $320 resistance zone, which now converts into key support. Backed by a pristine 9/10 Relative Strength score and a confirmed Bullish 1M and 6M moving average cloud, this short put vertical gives us an optimized risk-neutral structure to target an extension toward our $340 objective.
- Management:
- ⚠️ Warning: Earnings are scheduled for July 16, which requires active management prior to expiration.
- Stop Loss: Buy back the spread at $16.14 (100% of credit received).
- Take Profit: Buy back the spread at $4.04 (50% of max gain).
2. MAR ($392.51): Chasing the All-Time High Extension

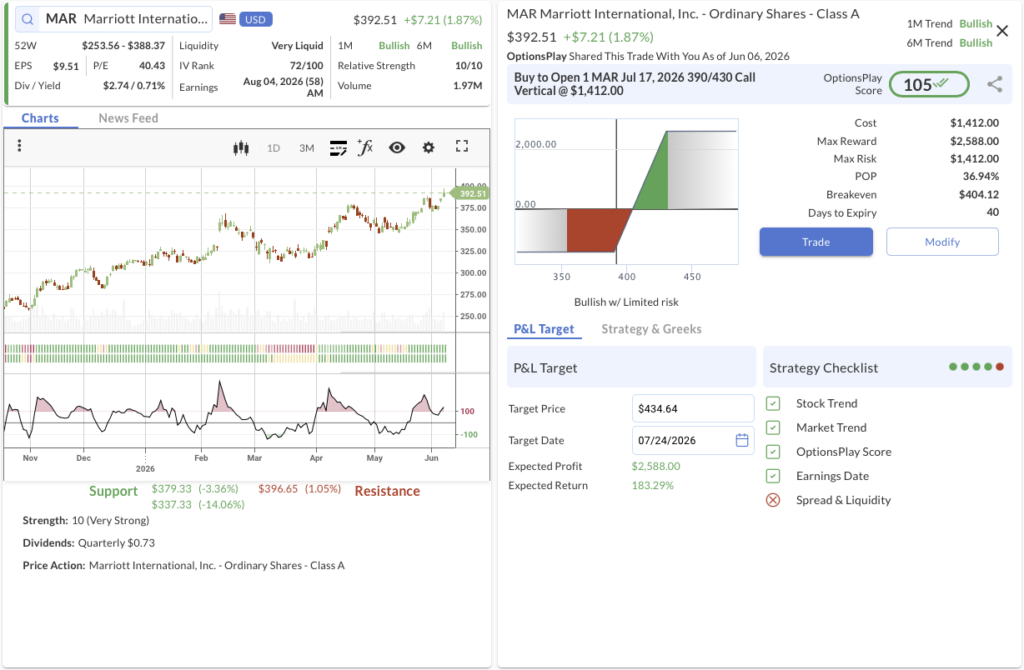
- We’re betting on: If Marriott captures sustained capital inflows from the rotational shift into non-tech names, this long call spread will expand rapidly toward its ultimate target.
- The Trade: Buy to Open the MAR Jul 17, 2026 390/430 Call Vertical @ $14.12 Debit.
- 🟢 BUY TO OPEN Jul 17, 2026 390 Call @ $17.70
- 🔴 SELL TO OPEN Jul 17, 2026 430 Call @ $3.58
- Trade Metrics: POP: 36.94% | Pay $1,412.00 per contract vs. a Max Reward of $2,588.00 (1.8:1).
- The Setup: Marriott International has officially broken out into new all-time high territory on a noticeable surge in relative volume. The stock commands a maximum 10/10 Relative Strength score, establishing it as a primary beneficiary of the institutional value rotation. While the premium consumer tape remains incredibly resilient, this call vertical allows us to buy the immediate breakout efficiently and structure a high-convexity play toward an elevated $430 upside target.
- Management:
- Stop Loss: Sell the spread at $7.06 (50% loss on premium).
- Take Profit: Sell the spread at $24.71 (75% gain on premium).
3. ELV ($415.53): Leaning Into Defensive Reacceleration

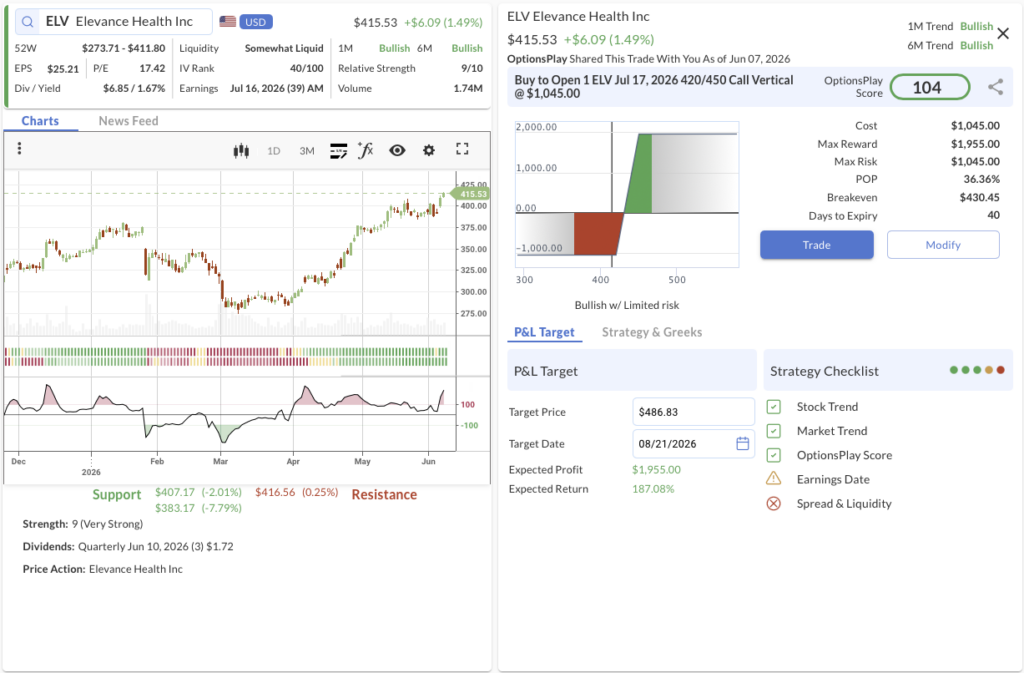
- We’re betting on: If the healthcare sector continues its long-awaited defensive rotation, Elevance will cleanly penetrate our upside strikes to accelerate out of its technical base.
- The Trade: Buy to Open the ELV Jul 17, 2026 420/450 Call Vertical @ $10.45 Debit.
- 🟢 BUY TO OPEN Jul 17, 2026 420 Call @ $18.05
- 🔴 SELL TO OPEN Jul 17, 2026 450 Call @ $7.60
- Trade Metrics: POP: 36.36% | Pay $1,045.00 per contract vs. a Max Reward of $1,955.00 (1.9:1).
- The Setup: Managed care is emerging as a premier defensive sanctuary as large-cap growth resets. Following a massive multi-month rally, Elevance Health spent three weeks carving out a tight consolidation base. As the high-beta AI trade began to lose steam late in the week, ELV cleanly reaccelerated to turn its near-term indicators bullish. With a strong 9/10 Relative Strength print and a robust structural base under it, we are positioning via a long call vertical to trade an initial move toward $440.
- Management:
- ⚠️ Warning: Earnings are scheduled for July 16, which requires active management prior to expiration.
- Stop Loss: Sell the spread at $5.23 (50% loss on premium).
- Take Profit: Sell the spread at $18.29 (75% gain on premium).
OptionsPlay DailyPlay Ideas Menu – June 5th, 2026
What’s Driving The Market
- Blowout Payrolls Detonate Rate Cut Narrative: The May employment report printed an extraordinary +172,000 nonfarm payrolls—more than double the consensus expectation of 80,000—while unemployment held at 4.3%. This definitive evidence of a reaccelerating labor market has abruptly crushed the soft-landing rate cut expectations that supported major equity benchmarks heading into June.
- Yields Surge to Multi-Week Highs: The fixed-income reaction to the strong employment metrics was swift and aggressive. The 10-year Treasury yield surged roughly 8 basis points on the session to cross the 4.50% threshold, settling near 4.54% as the market rapidly prices out probability for back-half policy easing, shifting the whisper toward zero cuts for the remainder of 2026.
- Equity Indices Bleed as Tech Air Pocket Reopens: Equity markets are aggressively unwinding yesterday’s rotation, with the Nasdaq sliding 1.6% and the S&P 500 shedding 1.0%. The damage is heavily concentrated across the chip complex as major names like Marvell, Micron, and Broadcom slide further, forcing the market to penalize both rate-cut bulls and overextended AI capex projections on the same tape.
- Corporate Earnings Reveal Deep Consumer Fault Lines: Single-stock reports highlighted diverging corporate realities under sticky inflation pressures. Lululemon plummeted 11% after slashing full-year revenue targets due to a sharp 410 basis point margin contraction and weak domestic product traction. Conversely, DocuSign caught a firm bid on solid AI-native contract platform expansion and aggressive share repurchases.
OptionsPlay Trade Ideas: The Daily Brief
💰 The Income Generators (High Probability, Cash Flow)
- No Positions Opened Today: Standing aside as the broader market indexes digest an aggressive macro reassessment of forward Fed policy.
🚀 The Growth Seekers (Higher Risk, Max Reward)
- No Positions Opened Today: Maintaining tactical capital preservation as volatile asset reallocation flows pressure tech and growth multipliers.
🛡️ The Portfolio Protectors (Hedges & Bearish Bets)
- No Positions Opened Today: Allowing the current yield and equity tape to find structural support before initiating fresh directional protection.
KKR, BA
OptionsPlay DailyPlay Ideas Menu – June 4th, 2026
💰 The Income Generators (High Probability, Cash Flow)
- KKR: Bearish Call Spread capitalizing on macro headwinds facing private equity as yields remain high and growth slows.
🚀 The Growth Seekers (Higher Risk, Max Reward)
- (No growth trades today)
🛡️ The Portfolio Protectors (Hedges & Bearish Bets)
- BA: Bearish Put Spread positioning for a technical breakdown below key support as structural momentum turns negative.
1. KKR ($90.53): Fading Private Equity Headwinds

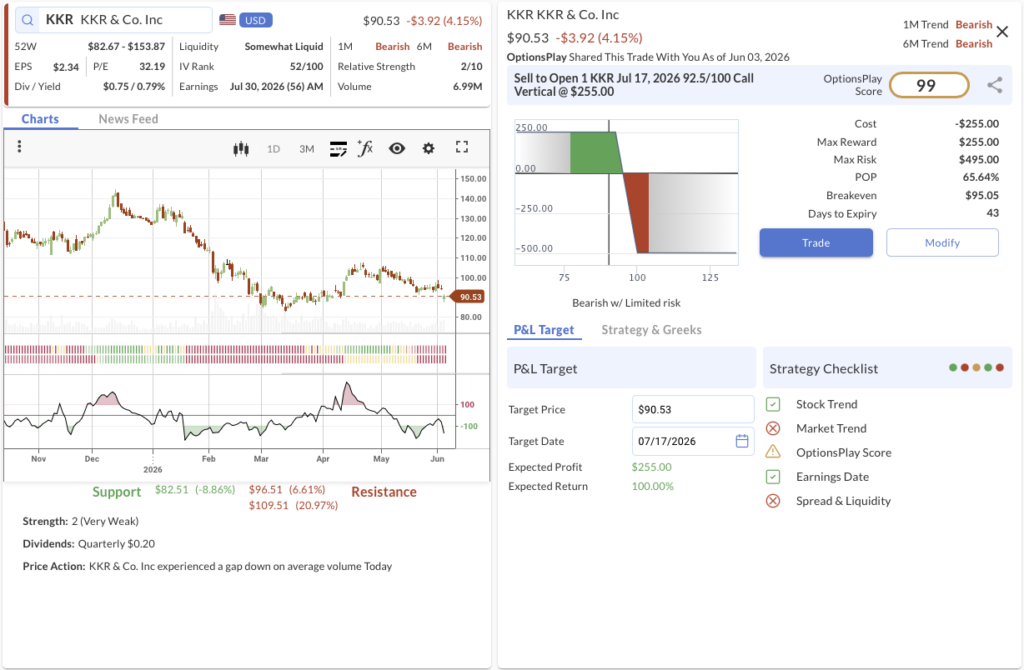
- We’re betting on: If high discount rates and sticky inflation continue to suppress private asset transaction velocity, KKR will struggle to break higher and fade beneath key overhead resistance.
- The Trade: Sell to Open the KKR Jul 17, 2026 92.5/100 Call Vertical @ $2.55 Credit.
- 🟢 BUY TO OPEN Jul 17, 2026 100 Call @ $2.00
- 🔴 SELL TO OPEN Jul 17, 2026 92.5 Call @ $4.55
- Trade Metrics: POP: 65.63% | Collect $255.00 per contract vs. a Max Risk of $495.00 (1.94:1).
- The Setup: With Treasury yields remaining sticky and macroeconomic inflation metrics printing hot, macro financing conditions for private equity operators remain deeply restrictive. KKR experienced a visible gap down on average volume and exhibits a Very Weak technical strength score of 2/10. The stock is pinned under a Bearish 1M and 6M moving average regime and looks vulnerable to breaking through its key horizontal support at $90 toward deeper targets at $80. Selling a call credit spread allows us to capture premium backed by high statistical probability while riding structural sector headwinds.
- Management:
- Stop Loss: Buy back the spread at $5.10 (100% of credit received).
- Take Profit: Buy back the spread at $1.28 (50% of max gain).
2. BA ($210.58): Trading the Momentum Breakdown

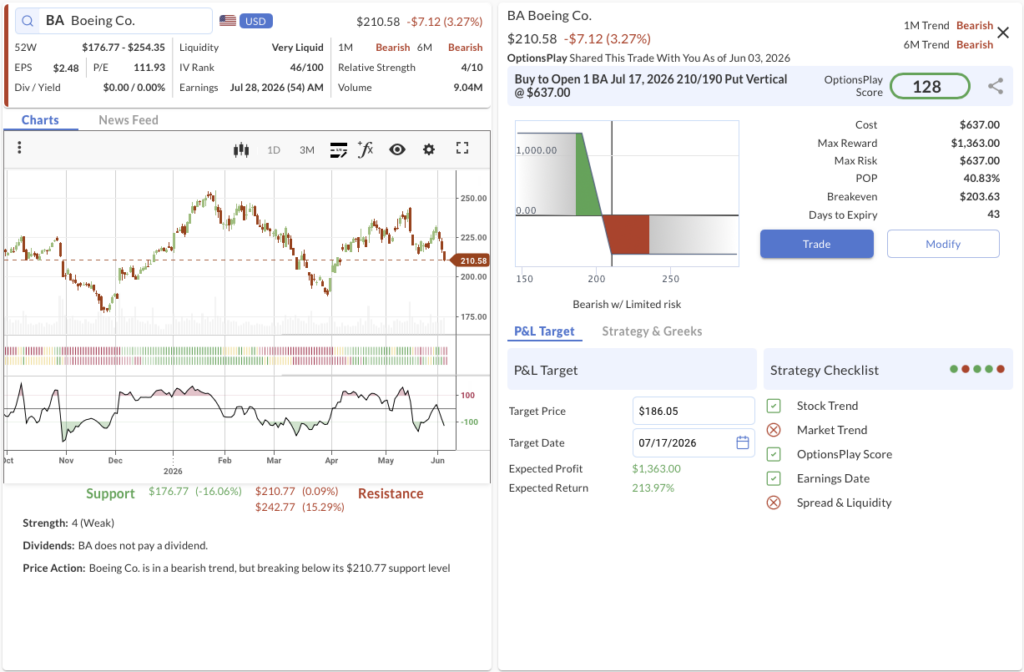
- We’re betting on: If Boeing’s relative strength and trend profile continue to deteriorate below technical support, the stock will roll over and accelerate toward our lower downside target.
- The Trade: Buy to Open the BA Jul 17, 2026 210/190 Put Vertical @ $6.37 Debit.
- 🔴 SELL TO OPEN Jul 17, 2026 190 Put @ $2.56
- 🟢 BUY TO OPEN Jul 17, 2026 210 Put @ $8.93
- Trade Metrics: POP: 40.82% | Pay $637.00 per contract vs. a Max Reward of $1,363.00 (2.1:1).
- The Setup: Boeing has experienced a steady erosion in its underlying technical trend, and short-term momentum has now shifted completely negative. Both the 1M and 6M trends are locked in a Bearish configuration. The stock is actively testing its multi-month support level and is at imminent risk of a clean technical break below $210.77. We are utilizing this structural breakdown to establish a long put vertical targeting $190 on the downside, picking up a very strong 2.1 to 1 potential risk-to-reward structure.
- Management:
- Stop Loss: Sell the spread at $3.19 (50% loss on premium).
- Take Profit: Sell the spread at $11.15 (75% gain on premium).
CMI, VRTX
OptionsPlay DailyPlay Ideas Menu – June 3rd, 2026
What’s Driving The Market
- Records Keep Falling Under Internal Dispersion: The S&P 500 ticked up 0.13% and the Dow Jones Industrial Average added 0.45% to secure fresh all-time highs. Meanwhile, the Nasdaq Composite closed essentially flat as a deep slide in Alphabet counterbalanced explosive moves across the semi and artificial intelligence infrastructure complexes. The small cap Russell 2000 gained 0.31%, pointing to mild underlying breadth improvement across the broader tape.
- The AI Build-Out Trade Broadens Beyond Nvidia: The defining story of the session revolved around significant rotation within technology ecosystems. Marvell Technology skyrocketed 33% following highly favorable public commentary from Nvidia leadership, sparking a broad rally across custom ASIC and AI accelerator peers. Simultaneously, Hewlett Packard Enterprise surged 19% on a clean earnings beat fueled by AI server demand, while Palo Alto Networks and Cisco firmed on expanding cybersecurity initiatives.
- Alphabet Under Pressure on Capital Expenditure Dilution: Alphabet shares fell roughly 4% after the company announced a massive $80 billion equity offering to finance its ongoing compute capex requirements. The package is structured between underwritten public offerings, an at-the-market program starting in the third quarter, and a private placement to Berkshire Hathaway. Market participants penalized the hyperscaler as the hefty capital expenditure bill lands as near term share dilution rather than immediate cash flow.
- Macro Labor Demand Surprises to the Upside: April JOLTS job openings unexpectedly surged to 7.6 million, marking an increase of more than 730,000 from the revised prior reading to hit a two-year high. While hires and total separations edged lower to keep the labor market in a low-hire, low-fire configuration, aggregate labor demand is clearly firming. Long end Treasury yields remained largely unmoved at 4.46%, though the data establishes a high bar for the upcoming employment prints.
- Crypto Suffers Selective Liquidation: Bitcoin broke down significantly, sliding roughly 6% to post its first daily close below the $70,000 threshold since April. With major equity benchmarks holding near historic highs, capital is displaying a clear preference for AI equity beta over crypto assets, demonstrating that speculative risk appetite is concentrating rather than broadening out.
💰 The Income Generators (High Probability, Cash Flow)
- CMI: Bullish Put Spread adding to a prior winning position as a fresh trend-following signal points to an extension toward our $715 target.
🚀 The Growth Seekers (Higher Risk, Max Reward)
- (No trades in this category today)
🛡️ The Portfolio Protectors (Hedges & Bearish Bets)
- VRTX: Bearish Put Spread positioning for a technical breakdown below critical support as chronic market underperformance intensifies.
1. CMI ($672.67): Compounding the Cyclical Trend


- We’re betting on: If Cummins maintains its structural bullish trajectory and capitalizes on industrial cyclical tailwinds, the stock will remain insulated well above our $660 short strike through mid-July.
- The Trade: Sell to Open the CMI Jul 17, 2026 660/630 Put Vertical @ $10.45 Credit.
- 🟢 BUY TO OPEN Jul 17, 2026 630 Put @ $18.80.
- 🔴 SELL TO OPEN Jul 17, 2026 660 Put @ $29.25.
- Trade Metrics: POP: 57.48% | Collect $1,045.00 per contract vs. a Max Risk of $1,955.00 (1.87:1).
- The Setup: Following up on a highly successful put spread sold on April 23rd, CMI is presenting a prime technical window to add exposure. The stock advanced 4.53% in the latest session, generating a clean bullish trend-following signal on our scanners after completing a shallow short-term pullback. CMI exhibits a strong 9/10 Relative Strength score and its long-term 6M trend is firmly Bullish. Deploying an at-the-money put credit spread allows us to capture rich premium while targeting our primary $715 upside objective.
- Management:
- Stop Loss: Buy back the spread at $20.90 (100% of credit received).
- Take Profit: Buy back the spread at $5.23 (50% of max gain).
2. VRTX ($425.09): Trading the Support Breakdown

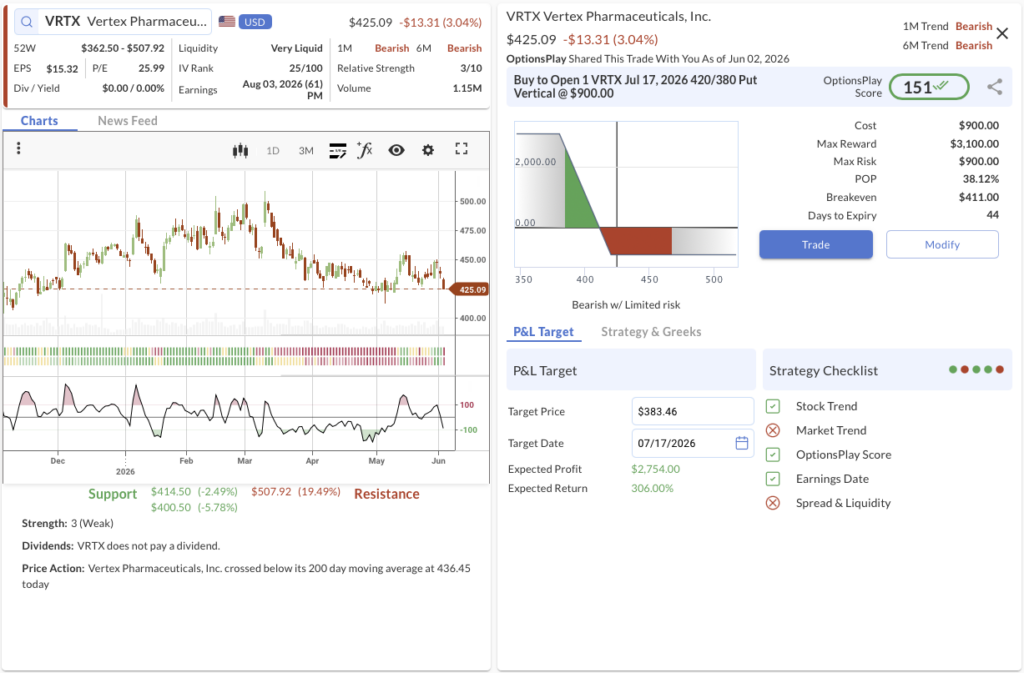
- We’re betting on: If structural underperformance persists and healthcare proxy flows remain weak, Vertex will violate its macro floor and accelerate toward our lower downside target.
- The Trade: Buy to Open the VRTX Jul 17, 2026 420/380 Put Vertical @ $9.00 Debit.
- 🔴 SELL TO OPEN Jul 17, 2026 380 Put @ $4.00.
- 🟢 BUY TO OPEN Jul 17, 2026 420 Put @ $13.00.
- Trade Metrics: POP: 38.11% | Pay $900.00 per contract vs. a Max Reward of $3,100.00 (3.4:1).
- The Setup: Vertex Pharmaceuticals has consistently underperformed the broader market, and the stock is now actively testing its major horizontal support level at $420. In the latest session, the stock fell over 3%, crossing cleanly below its 200-day moving average at $436.45 to shift both its 1M and 6M trends into a confirmed Bearish alignment. Given that it is at imminent risk of breaking lower, this long put vertical spread is optimally positioned to capture a flush toward the next major support zone near $380, offering an excellent 3.4 to 1 potential payoff.
- Management:
- Stop Loss: Sell the spread at $4.50 (50% loss on premium).
- Take Profit: Sell the spread at $15.75 (75% gain on premium).
GOOGL, AXON
OptionsPlay DailyPlay Ideas Menu – June 2nd, 2026
What’s Driving The Market
- Tech Overpowers Oil: The new week opened with an unusual tape as front-month WTI crude exploded 7.69% to $94.08 and Brent jumped 6.43% to $97.07 on reports that Iran has suspended US nuclear talks. Despite the expanding geopolitical supply premium, all three major US stock indexes pushed to fresh historical records, led by a 0.42% gain in the Nasdaq Composite to its first-ever close above the 27,000 threshold. However, market breadth was notably thin, with the Russell 2000 sliding 0.69% to close back below 2,900.
- NVIDIA Keynote Sparks Hardware Re-Rating: Jensen Huang’s Computex 2026 keynote in Taipei served as the primary bullish engine for mega-cap technology. NVIDIA unveiled the RTX Spark superchip co-designed with MediaTek, alongside confirmation that its data center Vera CPU is in full production with premier AI developers.The announcement pushed NVIDIA shares up over 5% to record territory and catalyzed massive rallies in PC OEM partners like Dell (+10%) and HP (+8%).
- Energy Rips on Geopolitical Threats: The energy sector led the S&P 500 as oil futures experienced their largest single-session advance in months. Iranian media confirmed the suspension of bilateral talks due to ongoing military friction in Lebanon. While official rhetoric suggests negotiations continue behind the scenes, the threat of an escalation in the Strait of Hormuz has successfully established a high geopolitical floor under the crude complex.
- Asset Divergence and Defensive Tells: The widening divergence between large-cap record highs and small-cap weakness provides a clear read on current market narrowness. As the 10-year Treasury yield ticked up 3 basis points to 4.47% on oil-driven inflation risks, small caps suffered from higher discount rates and weaker demand visibility. The heavily capitalized AI complex maintains the secular earnings growth cushion to absorb these shifting macro pressures, whereas the rest of the market does not.
💰 The Income Generators (High Probability, Cash Flow)
- GOOGL: Bullish Put Spread aggressively adding exposure to an existing winning position as a fresh trend-following signal confirms underlying momentum.
- AXON: Bullish Put Spread leveraging a clean high-volume breakout to generate income above key psychological support.
🚀 The Growth Seekers (Higher Risk, Max Reward)
- (No trades in this category today)
🛡️ The Portfolio Protectors (Hedges & Bearish Bets)
- (No trades in this category today)
1. GOOGL ($376.37): Adding to the Tech Leader

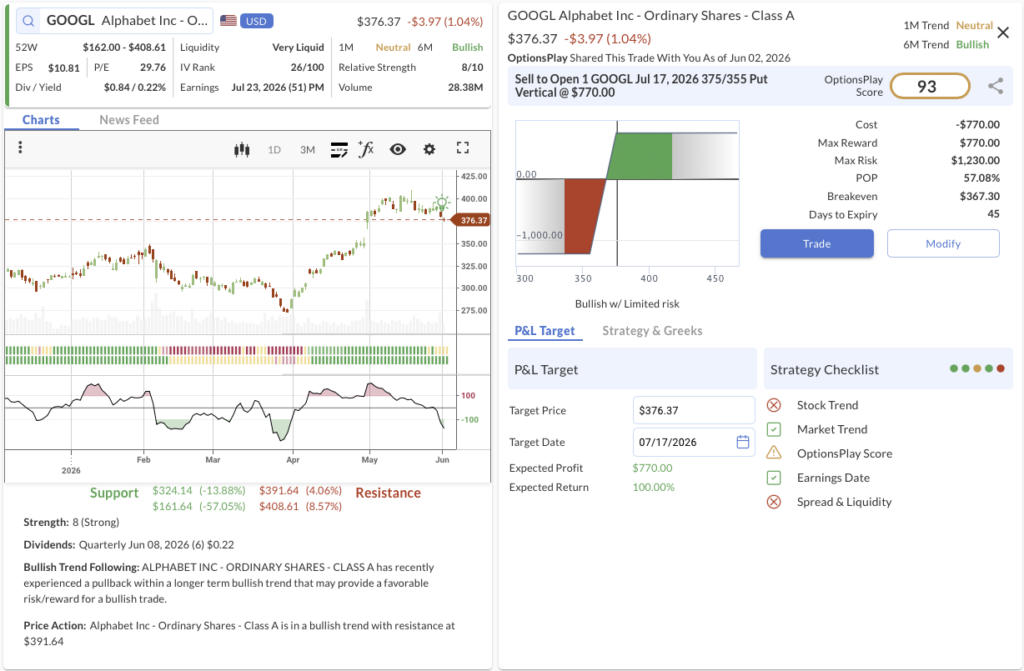
- We’re betting on: If Alphabet holds its long-term technical support and capitalizes on the broader mega-cap technology tailwinds, the stock will remain comfortably above our $375 short strike through mid-July.
- The Trade: Sell to Open the GOOGL Jul 17, 2026 375/355 Put Vertical @ $7.70 Credit.
- 🟢 BUY TO OPEN Jul 17, 2026 355 Put @ $6.95
- 🔴 SELL TO OPEN Jul 17, 2026 375 Put @ $14.65
- Trade Metrics: POP: 57.08% | Collect $770.00 per contract vs. a Max Risk of $1,230.00 (1.6:1).
- The Setup: We initially established a bullish position in GOOGL back on April 24th. Following a brief short-term retracement, the stock has generated a fresh trend-following buy signal on our indicators. This provides a textbook entry window to add exposure to an ongoing winner. Alphabet continues to trade in a highly secure 6M Bullish trend with an 8/10 Relative Strength score. Deploying an at-the-money put credit spread allows us to heavily monetize the elevated tech volatility premium while building out a core long position.
- Management:
- Stop Loss: Buy back the spread at $15.40 (100% of credit received).
- Take Profit: Buy back the spread at $3.85 (50% of max gain).
2. AXON ($476.88): The Defense Breakout


- We’re betting on: If Axon Enterprise maintains its multi-month breakout momentum, the stock will remain well clear of its structural support and short-term moving averages.
- The Trade: Sell to Open the AXON Jul 17, 2026 460/430 Put Vertical @ $12.70 Credit.
- 🟢 BUY TO OPEN Jul 17, 2026 430 Put @ $23.55
- 🔴 SELL TO OPEN Jul 17, 2026 460 Put @ $36.25
- Trade Metrics: POP: 55.06% | Collect $1,270.00 per contract vs. a Max Risk of $1,730.00 (1.36:1).
- The Setup: AXON recently triggered our early breakout scanning alerts as it decisively cleared its multi-month horizontal resistance floor at $450 on accelerating volume. The stock is exhibiting pristine 1M Bullish trend quality.With tech leading the headline tape, high-quality aerospace and defense names are catching a strong secondary structural bid. Now that old resistance has converted into key support, we are targeting an extension toward $500 and $525 on the upside. This short put vertical allows us to collect massive premium with a comfortable technical cushion.
- Management:
- Stop Loss: Buy back the spread at $25.40 (100% of credit received).
- Take Profit: Buy back the spread at $6.35 (50% of max gain).
ORCL, AVGO, DXCM
OptionsPlay DailyPlay Ideas Menu – June 1st, 2026
💰 The Income Generators (High Probability, Cash Flow)
- ORCL: Bullish Put Spread adding to a core winning position as the cloud infrastructure leader extends its major breakout toward our long term target.
- AVGO: Bullish Put Spread adding exposure to play a high volume breakout out of its prior trading range right ahead of its upcoming earnings catalyst.
🚀 The Growth Seekers (Higher Risk, Max Reward)
- DXCM: Bullish Call Spread positioning for a long term sector rotation into healthcare as market breadth continues to broaden out.
🛡️ The Portfolio Protectors (Hedges & Bearish Bets)
- (No trades in this category today)
1. AVGO ($446.77): The Pre-Earnings Breakout

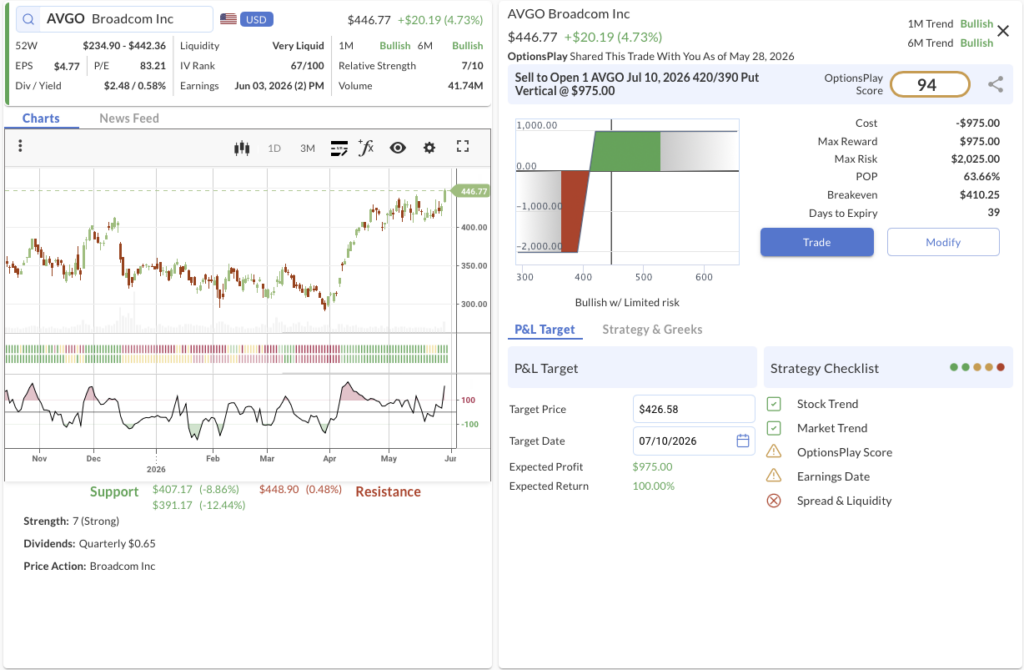
- We’re betting on: If Broadcom extends its powerful momentum past historical resistance, this long vertical call spread will rapidly expand to maximize gains over the coming weeks.
- The Trade: Sell to Open the AVGO Jul 10, 2026 420/390 Put Vertical @ $9.75 Credit.
- 🟢 BUY TO OPEN Jul 10, 2026 390 Put @ $10.15
- 🔴 SELL TO OPEN Jul 10, 2026 420 Put @ $19.90
- Trade Metrics: POP: 63.66% | Collect $975.00 per contract vs. a Max Reward of $2,025.00 (2.07:1).
- The Setup: Following up on our profitable positioning from May 29th, Broadcom has officially broken out above its heavy $440 trading range on high volume. The stock exhibits exceptional relative strength and rock solid fundamentals. With the corporate AI infrastructure buildout firmly back in focus, we are taking advantage of a prime opportunity to add further exposure to a company that is coiled to potentially explode higher on its upcoming financial release. This long call vertical offers a strong 2.3 to 1 payoff structure to trade the breakout.
- Management:
- ⚠️ Warning: Earnings are scheduled for June 3, which falls squarely within this cycle and guarantees an immediate binary volatility event.
- Stop Loss: Buy back the spread at $19.50 (100% of credit received).
- Take Profit: Buy back the spread at $4.88 (50% of max gain).
2. ORCL ($225.78): Compounding the Cloud Rebrand

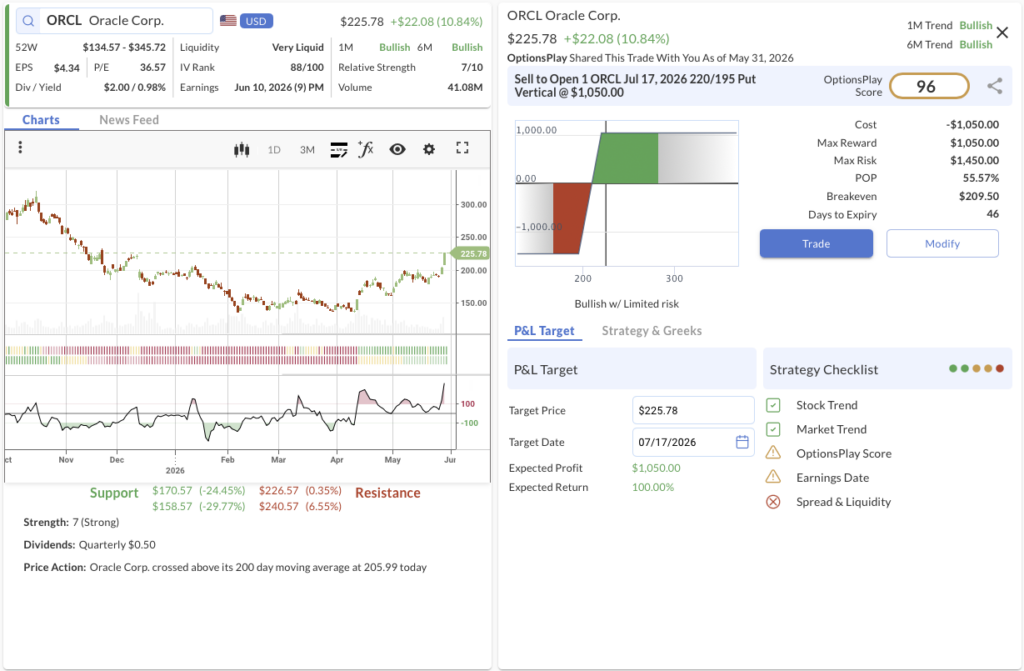
- We’re betting on: If Oracle holds its newly established support above major moving averages, this credit vertical will decay rapidly toward zero to deliver max cash flow.
- The Trade: Sell to Open the ORCL Jul 17, 2026 220/195 Put Vertical @ $10.50 Credit.
- 🟢 BUY TO OPEN Jul 17, 2026 195 Put @ $9.13
- 🔴 SELL TO OPEN Jul 17, 2026 220 Put @ $19.63
- Trade Metrics: POP: 55.57% | Collect $1,050.00 per contract vs. a Max Risk of $1,450.00 (1.38:1).
- The Setup: After successfully establishing three separate positions in Oracle over the past five weeks at the $175, $180, and $195 levels, the stock’s massive technical acceleration is offering us a pristine chance to add further to this trade. Oracle continues to cross above major historical technical levels on heavy volume and stellar relative strength. We are leaning heavily into this momentum to target our eventual $280 upside objective, utilizing a high credit put spread to optimize premium collection as the underlying structural cloud thesis plays out.
- Management:
- ⚠️ Warning: Earnings are scheduled for June 10, requiring active monitoring around the binary event.
- Stop Loss: Buy back the spread at $21.00 (100% of credit received).
- Take Profit: Buy back the spread at $5.25 (50% of max gain).
3. DXCM ($73.74): The Healthcare Rotation

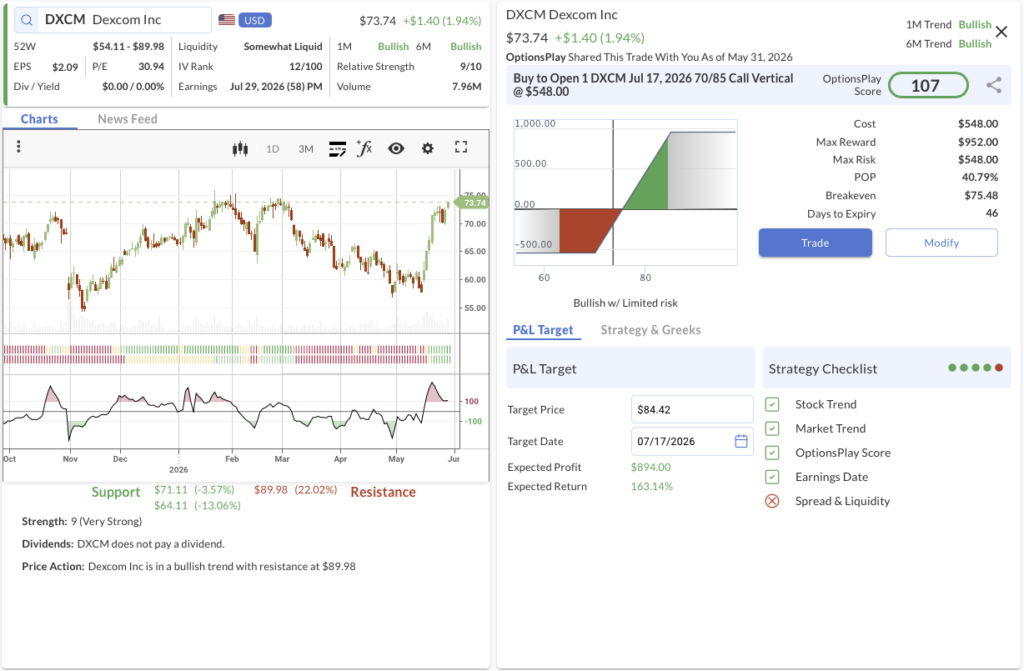
- We’re betting on: If capital continues to seek out high quality laggards outside of tech, Dexcom will bounce off its technical floor and rally toward major overhead objectives.
- The Trade: Buy to Open the DXCM Jul 17, 2026 70/85 Call Vertical @ $5.48 Debit.
- 🟢 BUY TO OPEN Jul 17, 2026 70 Call @ $6.50
- 🔴 SELL TO OPEN Jul 17, 2026 85 Call @ $1.02
- Trade Metrics: POP: 40.79% | Pay $548.00 per contract vs. a Max Reward of $952.00 (1.7:1).
- The Setup: As the broader equity market indices hover near record highs, we are observing early structural signs of rotation into defensive growth. Dexcom is a perfect vehicle to trade this theme as we diversify our tracking scans into healthcare. The stock has successfully carved out a solid technical base and is turning higher on building relative strength. This long call spread allows us to position cost efficiently for a long term upward reversal targeting a $130 long term objective.
- Management:
- Stop Loss: Sell the spread at $2.74 (50% loss on premium).
- Take Profit: Sell the spread at $9.59 (75% gain on premium).
AVGO, MAR, FNV
OptionsPlay DailyPlay Ideas Menu – May 29th, 2026
What’s Driving The Market
- Session Narrative: US equities punched to fresh record highs in a counterintuitive session, with the S&P 500 gaining 0.58% and the Nasdaq Composite rising 0.91% to close at all-time highs. This upmove occurred despite a hotter headline PCE print, a downward GDP revision, and an active geopolitical exchange in the Gulf. The Dow lagged slightly, gaining just 0.05%, which underscored a distinct internal market bifurcation between the surging AI complex and the broader cyclical mix.
- The Snowflake Catalyst: The primary driver overridriding macro headwinds was a stellar earnings print from Snowflake, which surged 36.5% on its best trading day ever. Product revenue topped expectations alongside an announced 5-year Graviton compute and AI commitment with AWS. This update single-handedly revived the thesis that the AI capex cycle remains entirely intact, lifting software and tech peers in sympathy.
- Hostile Macro Data: April headline PCE arrived hot at +3.8% y/y, driven significantly by a 5.5% monthly rip in gasoline as the regional energy shock bleeds into consumer metrics. Core PCE offered some comfort by printing below consensus at +0.2% m/m. Meanwhile, the personal saving rate dropped to 2.6%, its lowest level since mid-2022, indicating that consumers are drawing down savings to absorb elevated costs rather than reducing consumption volumes. Additionally, Q1 GDP was revised lower to +1.6% annualized.
- Geopolitics and Yields: Long-end yields faced upward pressure as the 10-year Treasury yield punched back above 4.50%. This followed fresh military friction near Bandar Abbas and a ballistic missile interception over Kuwait, which pushed Brent crude higher to $96.63 and WTI back above $90. Remarkably, the VIX compressed 4% to close at 16.33, signaling that equity markets view these macro and geopolitical pressures as tradeable risks rather than fundamental regime breaks.
💰 The Income Generators (High Probability, Cash Flow)
- AVGO: Bullish Put Spread adding exposure to a highly profitable existing position as secular AI network architecture tailwinds accelerate.
🚀 The Growth Seekers (Higher Risk, Max Reward)
- MAR: Bullish Call Spread capitalizing on a high-volume technical breakout fueled by a resilient consumer traveling through premium channels.
🛡️ The Portfolio Protectors (Hedges & Bearish Bets)
- FNV: Bearish Put Spread positioning for a breakdown below major support as gold miners continue to suffer from chronic relative underperformance.
1. AVGO ($426.58): Compounding the AI Winner

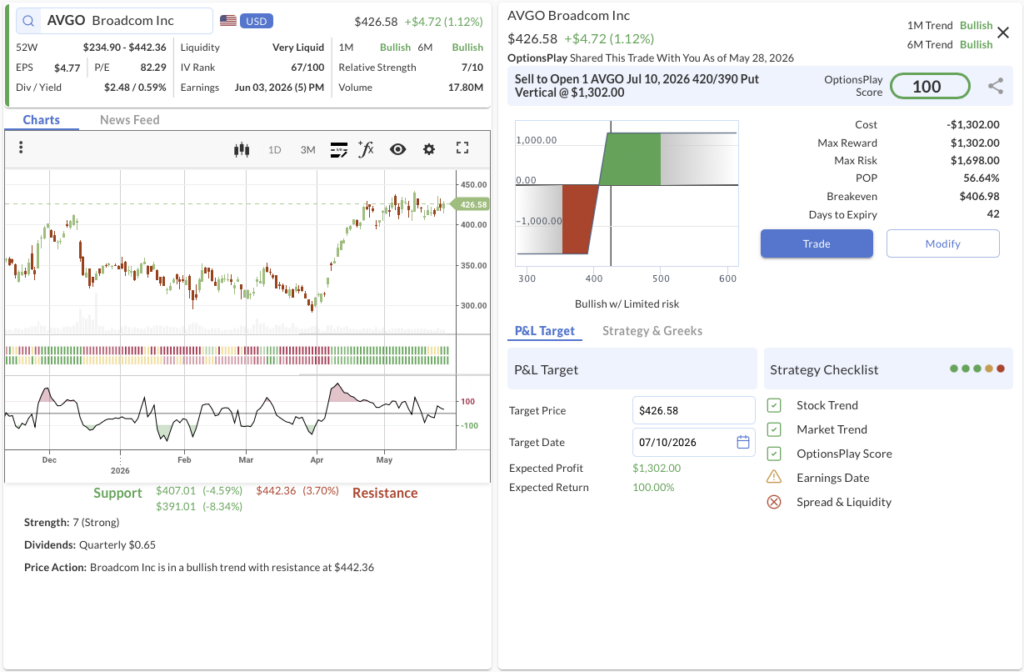
- We’re betting on: If Broadcom maintains its structural bullish trend and continues to dominate custom ASIC and high-speed networking switch markets, the stock will remain insulated well above our short strike through early July.
- The Trade: Sell to Open the AVGO Jul 10, 2026 420/390 Put Vertical @ $13.02 Credit.
- 🟢 BUY TO OPEN Jul 10, 2026 390 Put @ $13.58
- 🔴 SELL TO OPEN Jul 10, 2026 420 Put @ $26.60
- Trade Metrics: POP: 56.64% | Collect $1,302.00 per contract vs. a Max Risk of $1,698.00 (1.3:1).
- The Setup: We established a highly profitable trade back on May 1st in AVGO, and the stock’s persistent structural strength is giving us a pristine technical opportunity to add further exposure. Broadcom is locked in a confirmed 1M and 6M Bullish trend, showing clear signs of support stepping in right at its short-term moving average. As cloud hyperscalers aggressively expand their infrastructure networks to connect multi-thousand GPU clusters, Broadcom’s hardware layer is capturing immense monetization. This high-premium credit spread allows us to generate cash flow while targeting a $450 upside target.
- Management:
- ⚠️ Warning: Earnings are scheduled for Jun 03, which falls squarely within this cycle and guarantees an immediate volatility event.
- Stop Loss: Buy back the spread at $26.04 (100% of credit received).
- Take Profit: Buy back the spread at $6.51 (50% of max gain).
2. MAR ($385.76): The Premium Travel Breakout

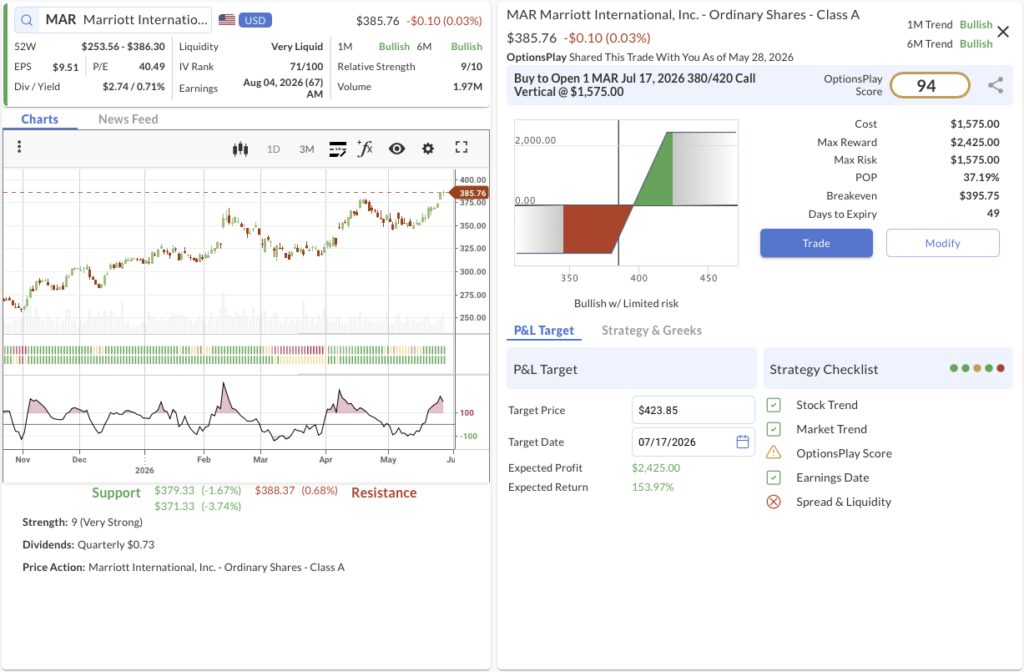
- We’re betting on: If Marriott continues its high-volume breakout and capitalizes on strong leisure demand, the stock will push rapidly toward our initial $420 upside objective.
- The Trade: Buy to Open the MAR Jul 17, 2026 380/420 Call Vertical @ $15.75 Debit.
- 🟢 BUY TO OPEN Jul 17, 2026 380 Call @ $20.60
- 🔴 SELL TO OPEN Jul 17, 2026 420 Call @ $4.85
- Trade Metrics: POP: 37.19% | Pay $1,575.00 per contract vs. a Max Reward of $2,425.00 (1.5:1).
- The Setup: Marriott just staged a clean technical breakout above major $375 resistance on strong relative strength and above-average volume, triggering our systematic breakout signal. The stock is exhibiting a perfect 9/10 Relative Strength score. While parts of the mass-market retail consumer are beginning to show modest signs of flinching, the premium hospitality and business travel landscape continues to experience secular tailwinds and resilient room pricing power. This long vertical call spread offers an incredibly efficient structure to catch a multi-week momentum extension.
- Management:
- Stop Loss: Sell the spread at $7.87 (50% loss on premium).
- Take Profit: Sell the spread at $27.56 (75% gain on premium).
3. FNV ($225.56): Fading Gold Miner Underperformance

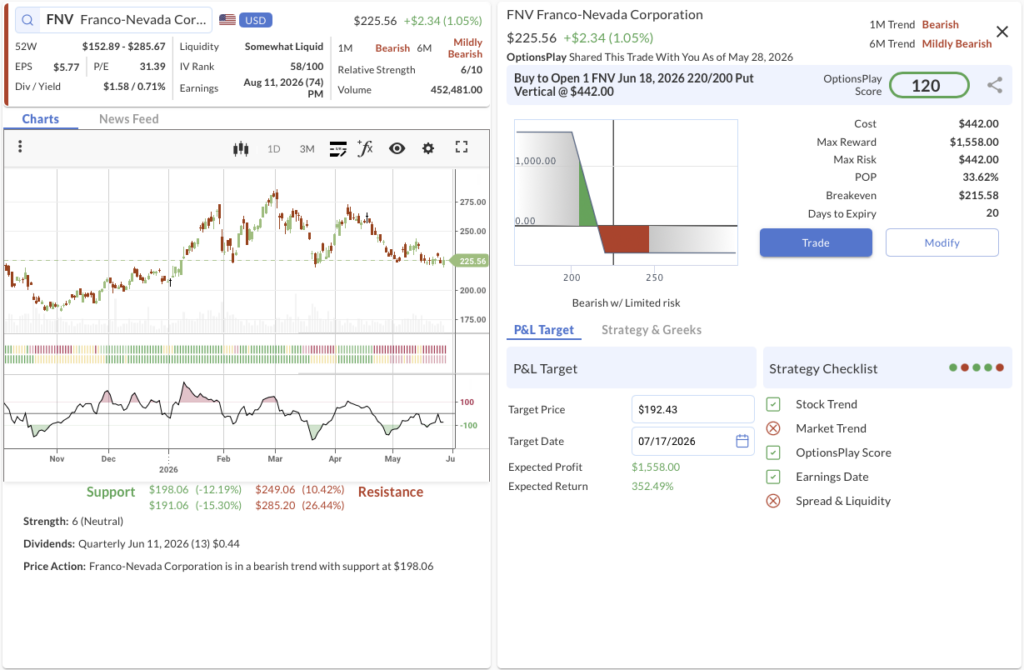
- We’re betting on: If Franco-Nevada cracks below its major horizontal floor on chronic relative weakness, the stock will roll over to test deep support.
- The Trade: Buy to Open the FNV Jun 18, 2026 220/200 Put Vertical @ $4.42 Debit.
- 🔴 SELL TO OPEN Jun 18, 2026 200 Put @ $1.23
- 🟢 BUY TO OPEN Jun 18, 2026 220 Put @ $5.65
- Trade Metrics: POP: 33.62% | Pay $442.00 per contract vs. a Max Reward of $1,558.00 (3.5:1).
- The Setup: Gold miners as an asset class have significantly underperformed physical bullion, and Franco-Nevada (FNV) is emerging as a primary short candidate. FNV has been testing its heavy $220 support level since mid-February with exceptionally poor relative strength. The stock is locked in a confirmed 1M Bearish and 6M Mildly Bearish posture. Given the repeated tests of this breakdown zone on rising volume, the risk of a technical flush lower toward our $200 target is elevated. This long put spread provides an aggressive portfolio hedge with an outsized 3.5 to 1 payoff ratio.
- Management:
- Stop Loss: Sell the spread at $2.21 (50% loss on premium).
- Take Profit: Sell the spread at $7.73 (75% gain on premium).
GE, APP, ABNB
OptionsPlay DailyPlay Ideas Menu – May 28th, 2026
What’s Driving The Market
- Oil Breaks Decisively Lower: Front month WTI crude fell 5.55% to settle at $88.68 per barrel and Brent lost more than 5% to settle at $94.29 per barrel, keeping Brent beneath the $95 price gate for a second consecutive session. This downward shift followed diplomatic statements from Iranian state television committing to restore commercial shipping through the Strait of Hormuz within one month of a US and Iran agreement, alongside progress updates from Secretary of State Rubio. With roughly 20% of the world’s seaborne oil moving through the region under normal conditions, the prospect of a reopening extracted a significant portion of the geopolitical risk premium from crude.
- Equity Rotation Broadens the Tape: While all three major indices printed technical records, the overall composition flipped from prior sessions. The Dow Jones Industrial Average led the way by climbing 182.60 points to a record 50,644.28 as old economy, value, transportation, and consumer names caught the oil relief bid. The S&P 500 and Nasdaq Composite finished nearly unchanged as funds rotated out of the crowded AI and memory complex, with NVIDIA pulling back 2.37% on profit taking and Micron cooling after its rapid surge to a $1 trillion valuation.
- Risk-On Signal Across Asset Classes: The 10-year Treasury yield eased to about 4.484% as lower crude prices reinforced the market’s disinflation narrative. Concurrently, gold gave back roughly 1.2% to trade near $4,456 per ounce as safe haven demand faded, while Bitcoin slipped 1.94% toward $74,966 with risk appetite concentrating primarily in equities. Volatility stayed contained with the VIX little changed near 16.70, while national average gas prices remained pinned near a four-year high around $4.46 per gallon.
💰 The Income Generators (High Probability, Cash Flow)
- GE: Bullish Put Spread capitalizing on a structural shift into industrials as improving trend quality supports an upward trajectory toward $340.
🚀 The Growth Seekers (Higher Risk, Max Reward)
- APP: Bullish Call Spread targeting a massive early breakout signal as strong technical momentum looks to extend toward the $730 target.
🛡️ The Portfolio Protectors (Hedges & Bearish Bets)
- ABNB: Bearish Put Spread positioning for a technical breakdown as the stock underperforms and risks a deeper slide to key support.
1. GE ($317.21): The Aerospace Rotation

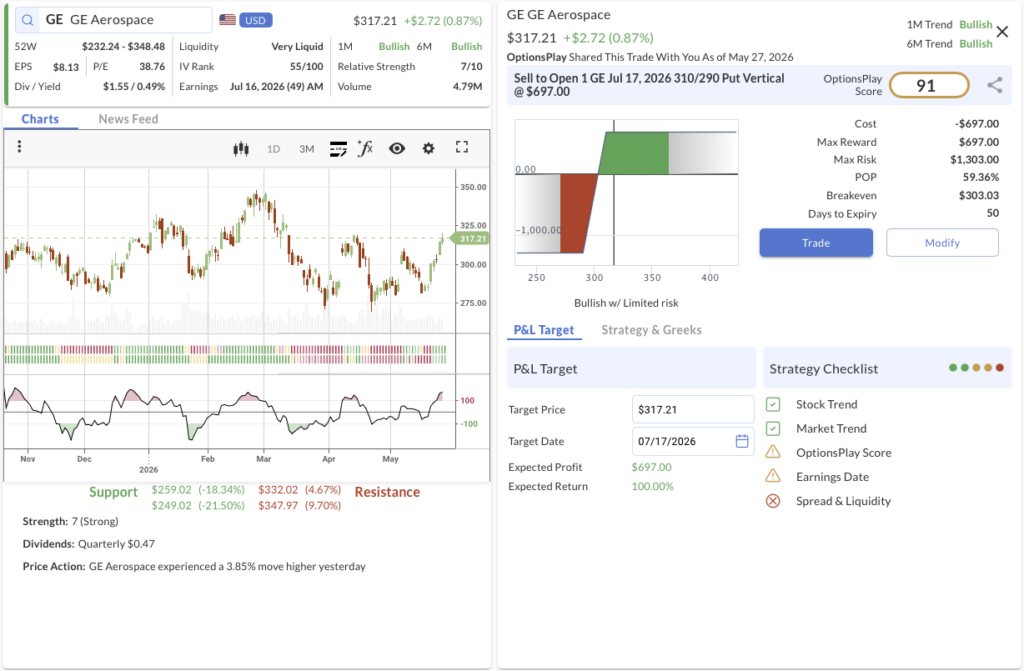
- We’re betting on: If GE Aerospace sustains its steady upward momentum amid institutional sector rotation, the stock will remain well insulated above our $310 short strike through mid-July.
- The Trade: Sell to Open the GE Jul 17, 2026 310/290 Put Vertical @ $6.97 Credit.
- 🟢 BUY TO OPEN Jul 17, 2026 290 Put @ $7.58
- 🔴 SELL TO OPEN Jul 17, 2026 310 Put @ $14.55
- Trade Metrics: POP: 59.37% | Collect $697.00 per contract vs. a Max Risk of $1,303.00 (1.9:1).
- The Setup: We are tracking a silent but distinct asset rotation into the aerospace industry. GE is demonstrating notable relative strength and a consistently improving trend quality, building on a 3.85% move higher yesterday. Both 1M and 6M trends are firmly locked in Bullish territory. Deploying a high-probability short put vertical allows us to collect attractive yield while leaning on a robust technical floor as the stock works toward its $340 upside target.
- Management:
- ⚠️Warning: Earnings are scheduled for July 16, which requires active management prior to expiration.
- Stop Loss: Buy back the spread at $13.94 (100% of credit received).
- Take Profit: Buy back the spread at $3.48 (50% of max gain).
2. APP ($567.83): The Parabolic Rebound

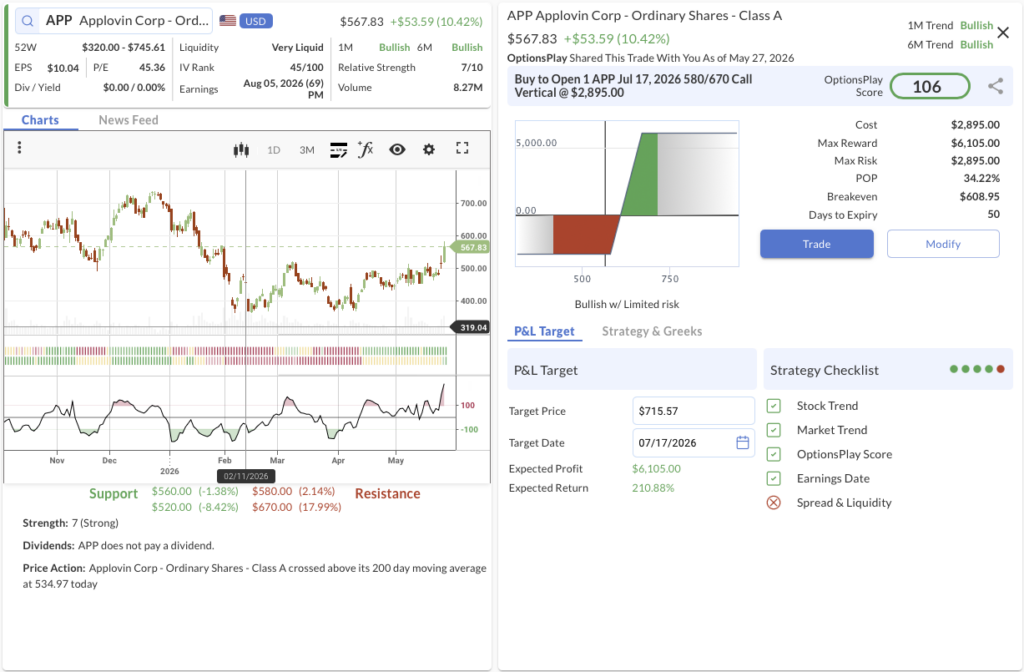
- We’re betting on: If AppLovin continues to validate its parabolic momentum breakout, the stock will comfortably push past our vertical strikes to maximize the value of this long spread.
- The Trade: Buy to Open the APP Jul 17, 2026 580/670 Call Vertical @ $28.95 Debit.
- 🟢 BUY TO OPEN Jul 17, 2026 580 Call @ $56.35
- 🔴 SELL TO OPEN Jul 17, 2026 670 Call @ $27.40
- Trade Metrics: POP: 34.22% | Pay $2,895.00 per contract vs. a Max Reward of $6,105.00 (2.1:1).
- The Setup: AppLovin generated a strong bullish early breakout signal covered in our equity research publication today. The stock surged over 10% in the latest session, cleanly crossing above its 200-day moving average at $534.97 to flip both its 1M and 6M trends into a confirmed Bullish alignment. Having cleared the initial $510 resistance level, the path of least resistance is higher toward our $730 upside objective. This long vertical call spread offers an optimal vehicle to leverage a continued momentum run.
- Management:
- Stop Loss: Sell the spread at $14.48 (50% loss on premium).
- Take Profit: Sell the spread at $50.66 (75% gain on premium).
3. ABNB ($132.10): The Underperformance Hedge

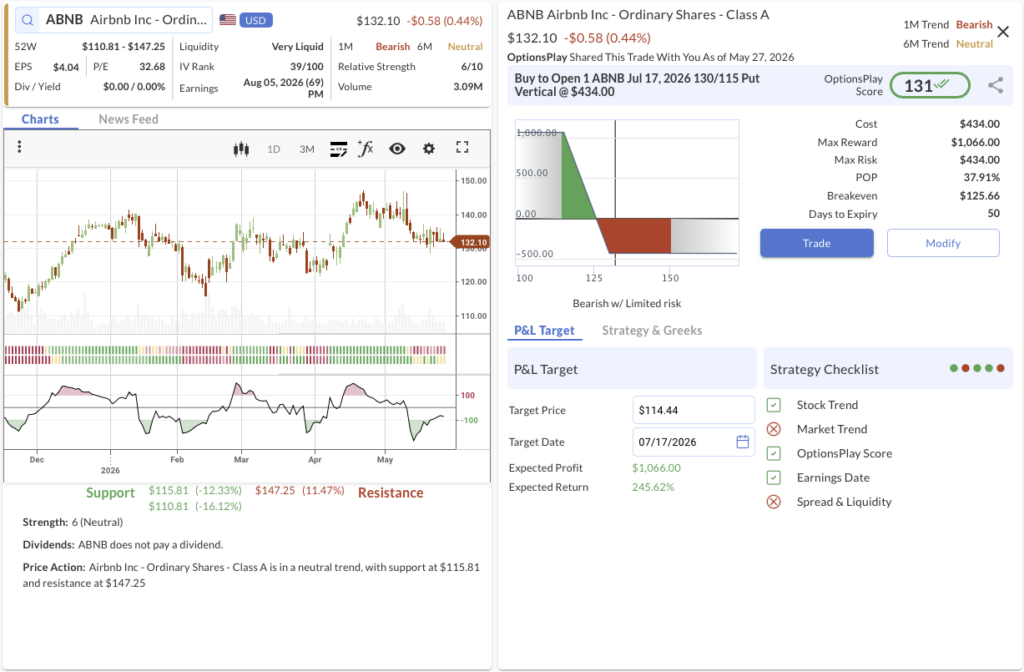
- We’re betting on: If consumer discretionary fatigue persists and Airbnb fails to maintain its short-term bounce, the stock will roll over to test its major macro support.
- The Trade: Buy to Open the ABNB Jul 17, 2026 130/115 Put Vertical @ $4.34 Debit.
- 🔴 SELL TO OPEN Jul 17, 2026 115 Put @ $1.39
- 🟢 BUY TO OPEN Jul 17, 2026 130 Put @ $5.73
- Trade Metrics: POP: 37.90% | Pay $434.00 per contract vs. a Max Reward of $1,066.00 (2.5:1).
- The Setup: Airbnb has officially entered our confirmed underperformed category on a 1M Bearish trend. While the broader market indices hover near historical highs, ABNB is showing distinct relative weakness, slipping lower even during flat tape sessions. The technical structure indicates that the stock is highly vulnerable to a pullback toward its major $115 support level. This long put spread provides an excellent portfolio hedge with a rewarding 2.5 to 1 payoff structure to trade the breakdown.
- Management:
- Stop Loss: Sell the spread at $2.17 (50% loss on premium).
- Take Profit: Sell the spread at $7.60 (75% gain on premium).
RKLB, NTES
OptionsPlay DailyPlay Ideas Menu – May 27th, 2026
What’s Driving the Market
- Stocks Made Records, But Options Paid Up: The tell was the VIX rising even as the S&P, Nasdaq, and Russell 2000 all printed all-time highs. Equity traders chose to look through the Gulf escalation, betting a Hormuz deal is still the base case, while desks quietly bid volatility and hedged the melt-up. The calm is rented, not owned, and Wednesday’s Camp David Cabinet meeting is the binary event that prices it.
- A Rotating Cast Carried The Records: The advance was led by Micron’s surge to $1 trillion and a rate-sensitive small-cap rally, while Nvidia, Microsoft, and Amazon all finished lower. Records made on a rotating handful rather than broad megacap participation are structurally narrower than the headline suggests. The question into Friday’s earnings wave is whether Micron’s breakout signals broad semiconductor and AI strength or a narrow melt-up.
- The Consumer Is Starting To Flinch: Case-Shiller posted its first monthly home-price decline in eight months. Consumer Confidence softened even on a headline beat, with the Conference Board blaming war-driven inflation, AutoZone missed on revenue, and gas sits at a four-year high. These are the first cracks ahead of a dense retail-earnings gauntlet that will gauge how hard the squeeze is biting.
- PCE Lands Under An Untested Fed: The April PCE and core PCE deflators are the marquee print, and for the first time, the market will judge inflation through newly sworn-in Fed Chair Kevin Warsh’s lens. With crude re-firming on the strikes and gas at four-year highs, how the Fed is expected to respond is as decisive as the number itself.
💰 The Income Generators (High Probability, Cash Flow)
- RKLB: Bullish Put Spread leaning into a proven, accelerating breakout to capture outsized income as the space infrastructure leader continues to validate our bullish thesis.
🚀 The Growth Seekers (Higher Risk, Max Reward)
- NTES: Bullish Call Spread targeting a powerful volume-driven breakout from a multi-month base as sellers exhaust themselves.
🛡️ The Portfolio Protectors (Hedges & Bearish Bets)
- (No trades in this category today)
1. RKLB ($143.20): Hitting the Home Run

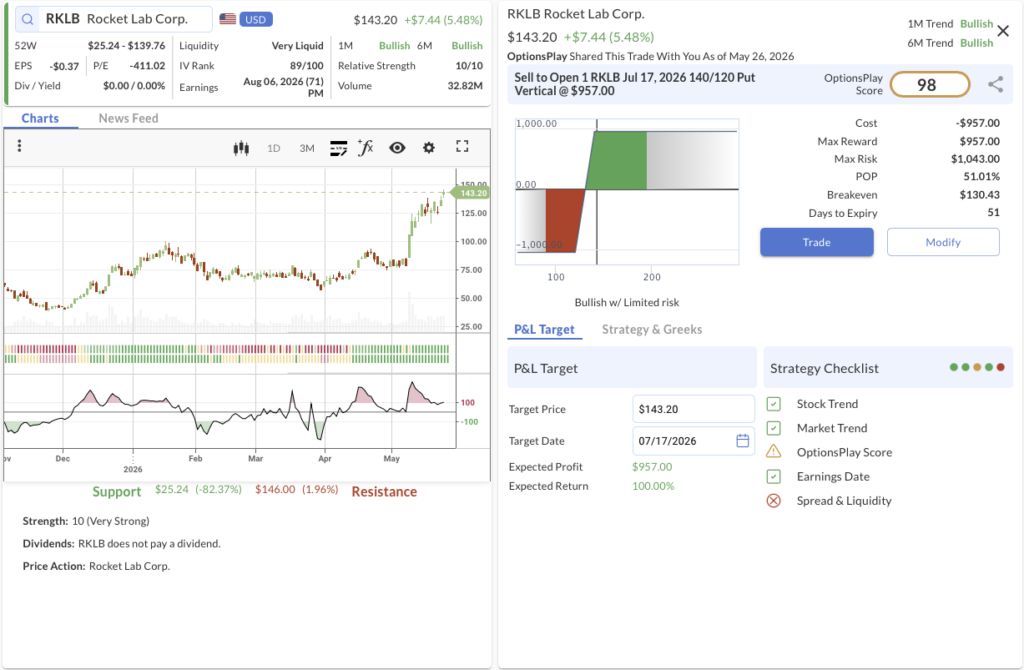
- We’re betting on: If Rocket Lab continues its relentless momentum and holds its structurally higher support levels, this aggressive credit spread will generate high-yield income through mid-July.
- The Trade: Sell to Open the RKLB Jul 17, 2026 140/120 Put Vertical @ $9.57 Credit.
- 🟢 BUY TO OPEN Jul 17, 2026 120 Put @ $10.20
- 🔴 SELL TO OPEN Jul 17, 2026 140 Put @ $19.77
- Trade Metrics: POP: 51.02% | Collect $957.00 per contract vs. a Max Risk of $1,043.00 (0.9:1).
- The Setup: After a highly successful trade on May 11th, and then again on May 19th, Rocket Lab has generated a brand new buy signal. The stock boasts a perfect 10/10 Relative Strength score and is in a confirmed bullish trend across all timeframes. We are taking this opportunity to sell a credit spread that offers a nearly 1 to 1 risk-to-reward ratio. This is a prime example of hitting home runs and compounding returns when the market definitively proves your thesis to be correct.
- Management:
- Stop Loss: Buy back the spread at $19.14 (100% of credit received).
- Take Profit: Buy back the spread at $4.78 (50% of max gain).
2. NTES ($123.34): The Exhaustion Breakout

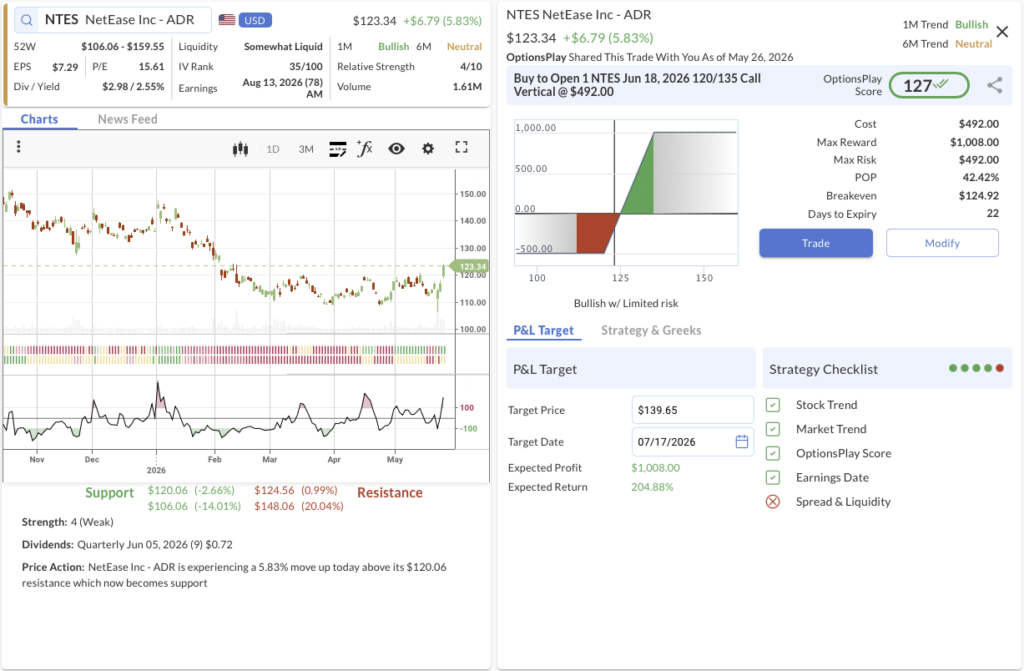
- We’re betting on: If NetEase sustains its high-volume breakout and capitalizes on seller exhaustion, the stock will aggressively target $135 and rapidly expand the value of this debit spread.
- The Trade: Buy to Open the NTES Jun 18, 2026 120/135 Call Vertical @ $4.92 Debit.
- 🟢 BUY TO OPEN Jun 18, 2026 120 Call @ $6.00
- 🔴 SELL TO OPEN Jun 18, 2026 135 Call @ $1.08
- Trade Metrics: POP: 42.43% | Pay $492.00 per contract vs. a Max Reward of $1,008.00 (2.0:1).
- The Setup: NetEase is an emerging Chinese Internet stock that has been heavily basing since mid-February. The chart just experienced a severe washout a few days ago where sellers were completely exhausted. Now, the stock has staged a sharp technical breakout above its key $120 resistance level on strong relative strength and volume. We are targeting a move to $135 on the upside. This long call spread offers a fantastic 2 to 1 risk-to-reward ratio to play the technical reversal.
- Management:
- Stop Loss: Sell the spread at $2.46 (50% loss on premium).
- Take Profit: Sell the spread at $8.61 (75% gain on premium).
MRK, HON
OptionsPlay DailyPlay Ideas Menu – May 26th, 2026
💰 The Income Generators (High Probability, Cash Flow)
- MRK: Bullish Put Spread capitalizing on a high-volume breakout and strong relative strength fueled by positive clinical trial developments.
🚀 The Growth Seekers (Higher Risk, Max Reward)
- HON: Bullish Call Spread targeting a technical breakout and robust relative strength as the company approaches a major aerospace spinoff.
🛡️ The Portfolio Protectors (Hedges & Bearish Bets)
- (No trades in this category today)
1. MRK ($122.41): The Clinical Breakout

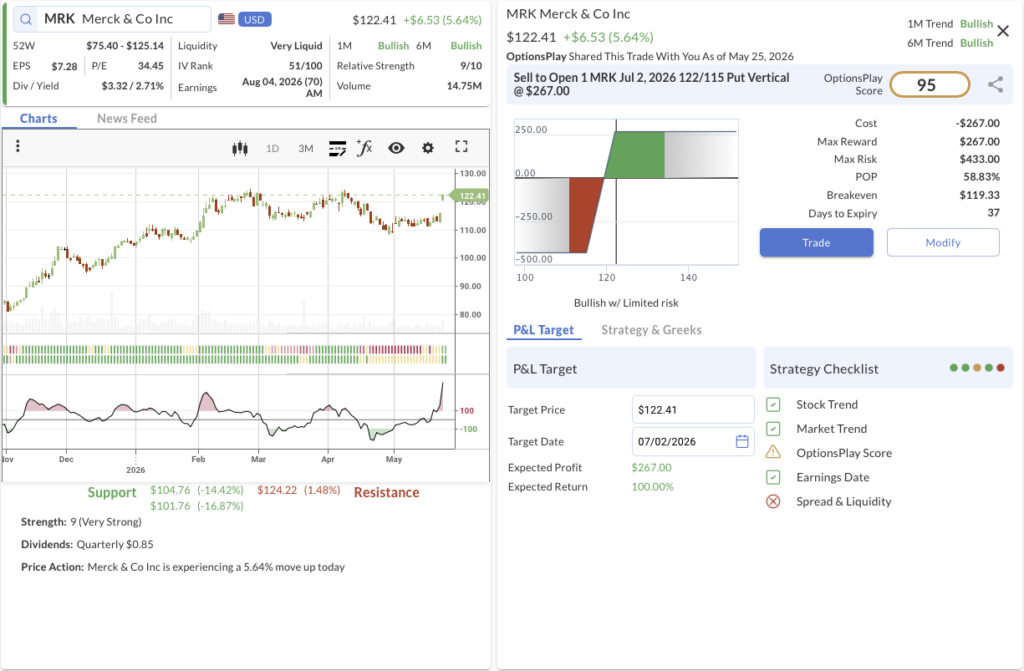
- We’re betting on: If Merck maintains its newly established support and structural momentum following positive pipeline developments, this spread will reliably decay to zero through early July.
- The Trade: Sell to Open the MRK Jul 02, 2026 122/115 Put Vertical @ $2.67 Credit.
- 🟢 BUY TO OPEN Jul 02, 2026 115 Put @ $2.05
- 🔴 SELL TO OPEN Jul 02, 2026 122 Put @ $4.72
- Trade Metrics: POP: 58.86% | Collect $267.00 per contract vs. a Max Risk of $433.00 (0.6:1).
- The Setup: Merck recently staged a decisive breakout above the $120 level on strong volume, placing it in a pristine technical position to run toward our $140 upside target. Fundamentally, this move is anchored by highly positive developments in clinical trials for two separate cancer treatments, which substantially de-risks the company’s forward revenue pipeline. The stock holds a phenomenal 9/10 Relative Strength score. Selling an at-the-money put spread allows us to generate a solid yield while leaning on this newly fortified support base.
- Management:
- Stop Loss: Buy back the spread at $5.34 (100% of credit received).
- Take Profit: Buy back the spread at $1.33 (50% of max gain).
2. HON ($227.92): The Aerospace Catalyst

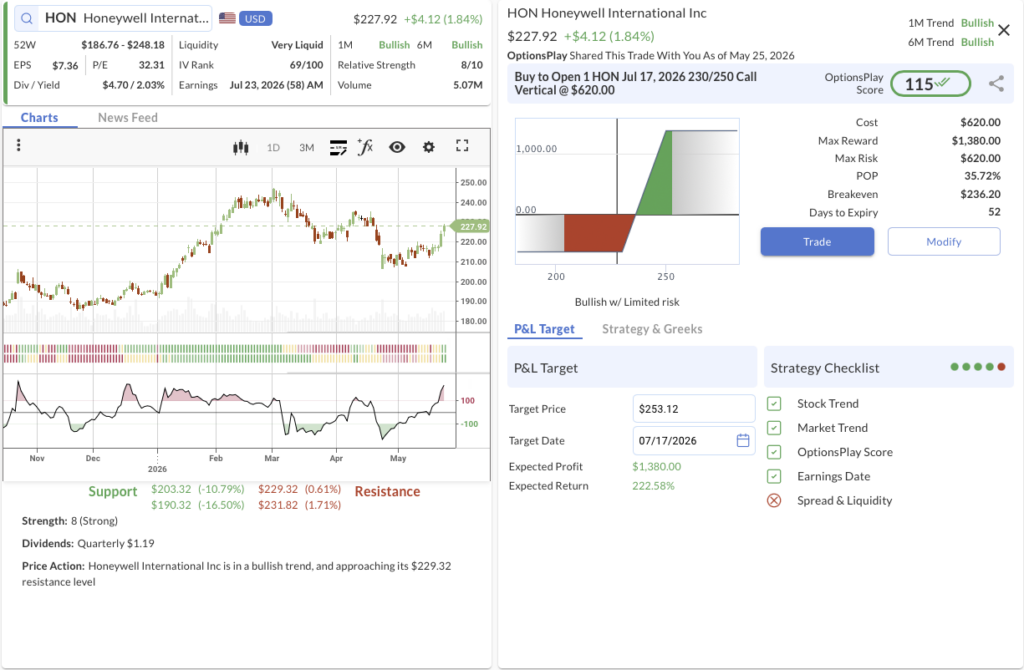
- We’re betting on: If Honeywell continues to flex its relative strength and rides the momentum of its upcoming corporate restructuring, the stock will push aggressively toward our $245 objective.
- The Trade: Buy to Open the HON Jul 17, 2026 230/250 Call Vertical @ $6.20 Debit.
- 🟢 BUY TO OPEN Jul 17, 2026 230 Call @ $9.60
- 🔴 SELL TO OPEN Jul 17, 2026 250 Call @ $3.40
- Trade Metrics: POP: 35.75% | Pay $620.00 per contract vs. a Max Reward of $1,380.00 (2.2:1).
- The Setup: Honeywell has officially broken out above its heavy $220 resistance line on strong Relative Strength (8/10), triggering a highly actionable technical setup. The chart is now clearly targeting $245 on the upside. Fundamentally, the market is aggressively bidding the stock up as we head toward its highly anticipated Aerospace spinoff. This strategic restructuring is expected to unlock significant shareholder value and streamline the core business. This long call spread offers an excellent 2.2 to 1 risk-to-reward ratio to capitalize on the multi-week breakout.
- Management:
- Stop Loss: Sell the spread at $3.10 (50% loss on premium).
- Take Profit: Sell the spread at $10.85 (75% gain on premium).