DailyPlay – Adjusting Trade (GS) & Closing Trade (FSLR, CRWD) – August 08, 2025
Closing Trade GS Bullish Trade Adjustment Signal...
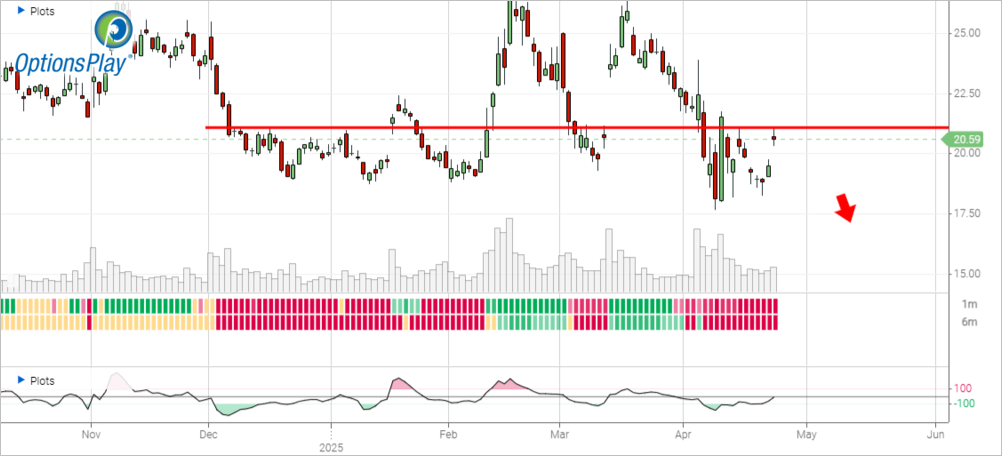
Read MoreIntel Corporation (INTC) faces mounting challenges ahead of its earnings report, with investor confidence eroding amid continued delays in execution and intensifying competitive threats across key business lines. While the stock has experienced occasional short-term rallies, the prevailing trend remains decisively bearish. Persistent margin erosion, lackluster growth prospects, and underwhelming strategic visibility continue to weigh on sentiment. With shares recently bouncing into overhead resistance and options pricing suggesting only modest implied volatility, the setup favors a tactically bearish stance into earnings as the market recalibrates expectations.
Intel’s stock price, currently at $20.59, trades below all key moving averages: the 20-day at $22.29, the 50-day at $20.74, and the 200-day at $22.76—all of which are trending lower. This alignment confirms a sustained downtrend. Since peaking near $35 in mid-2023, INTC has established a consistent pattern of lower highs and lower lows, signaling a clear deterioration in price structure. Additionally, volume spikes on down days underscore aggressive distribution, further validating bearish momentum. With no meaningful signs of technical reversal, the chart reflects continued weakness and supports a cautious, downside-biased view into earnings.
Intel remains fundamentally challenged as it navigates a highly competitive environment while attempting to pivot through a complex and capital-intensive turnaround. Execution risk in its foundry ambitions, lagging AI exposure, and cyclical softness in the PC market all present hurdles. Valuation and profitability metrics highlight its disadvantage versus peers, with negative margins and muted growth expectations.
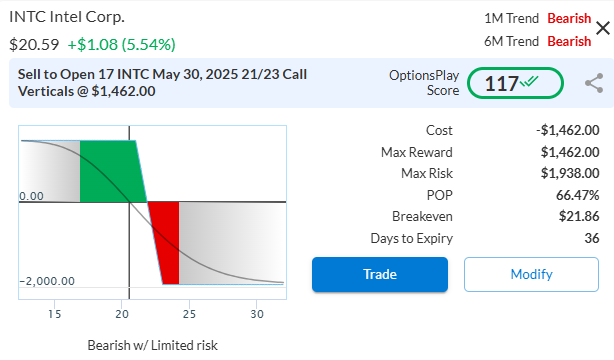
Strategy: Short Call Vertical Spread
Direction: Bearish Credit Spread
Details: Sell to Open 17 Contracts INTC May 30 $21/$23 Call Vertical Spreads @ $0.86 Credit per Contract.
Total Risk: This trade has a max risk of $1,938 (17 Contracts x $114) based on a hypothetical $100k portfolio risking 2%. We suggest risking only 2% of the value of your portfolio and divide it by $114 to select the # contracts for your portfolio.
Trend Continuation Signal: This is a bearish trade on a stock that is expected to continue lower over the duration of the trade.
1M/6M Trends: Bearish/Bearish
Relative Strength: 3/10
OptionsPlay Score: 117
Stop Loss: @ $1.72 (100% loss to value of premium)
Use the following details to enter the trade on your trading platform. Please note that whenever there is a multi-leg option strategy, it should be entered as a single trade.
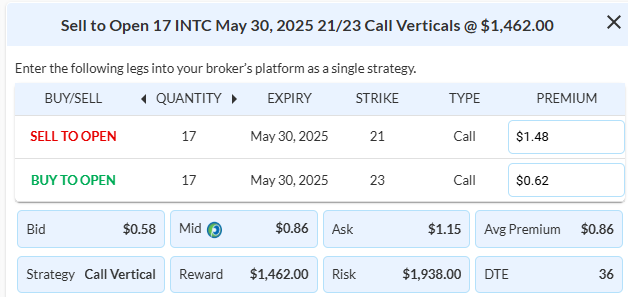
PLEASE NOTE that these prices are based on Wednesday’s closing prices. Should the underlying move significantly during the pre-market hours, we will likely adjust the strikes and prices to reflect a more accurate trade entry.
Closing Trade GS Bullish Trade Adjustment Signal...
Read MoreXYZ Bullish Opening Trade Signal Investment Rationale...
Read MoreCRWD Bearish Opening Trade Signal Investment Rationale...
Read MoreClosing Trade PINS Bullish Opening Trade Signal Investment...
Read More

Share this on