DailyPlay – Opening Trade (COST) – September 25, 2025
COST Bearish Opening Trade Signal
Investment Rationale
Investment Thesis
Costco (COST) has been highlighted in this week’s Earnings Navigator as a stock to watch ahead of its fiscal fourth-quarter results, set to be released after today’s close. While the company’s long-term fundamentals remain strong and analysts argue that its results are sustainable, investors should be mindful of the near-term risks. Growth metrics earlier this year hinted at deceleration, and with Costco trading at an elevated valuation relative to its peers, the stock could be vulnerable to downside pressure if earnings disappoint. This setup creates an opportunity to position bearishly into earnings volatility with a defined-risk options strategy.
Technical Analysis
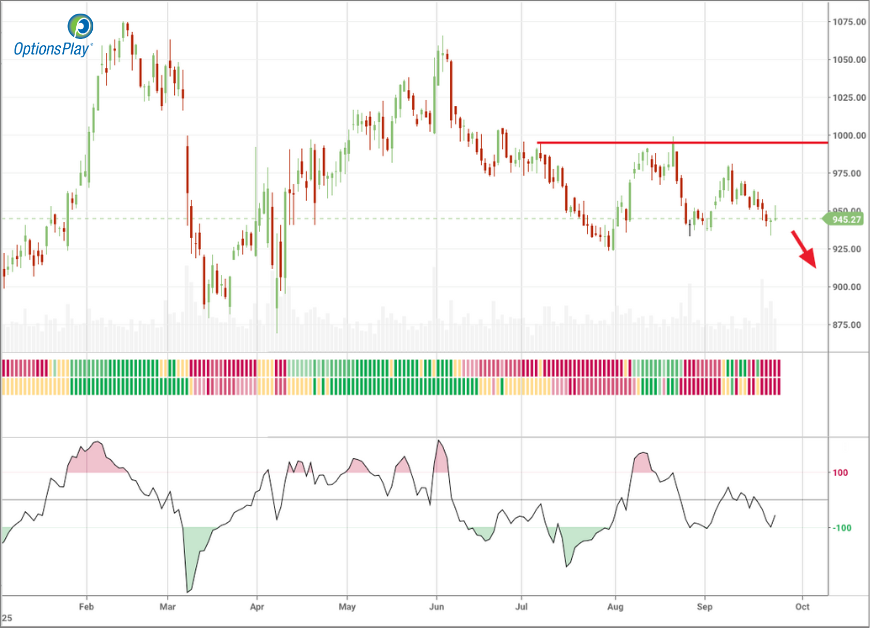
COST shares are trading near $945, stuck below key resistance levels with clear signs of weakening momentum. The stock remains just below the 20-day moving average and the 50-day moving average, both of which are trending lower. Meanwhile, the longer-term 200-day moving average at $975 continues to act as overhead resistance, reinforcing the bearish bias. In August, the 50-day moving average crossed below the 200-day moving average, forming a death cross, a bearish technical signal that often confirms a trend of sustained weakness. More recently, the stock rallied back to the 200-day moving average but failed to break out, and since that rejection has been carving a series of lower highs and lower lows. The RSI sits at 43.77, in neutral-to-weak territory, leaving room for additional downside pressure if earnings fail to provide a catalyst.
Fundamental Analysis
Costco’s premium valuation reflects investor confidence, but it also leaves little margin for error should earnings come in light of expectations. Relative to industry benchmarks, Costco trades at significantly higher multiples, which may amplify downside in the event of weaker guidance.
- Forward PE Ratio: 47.12x vs. Industry Median 18.43x
- Expected EPS Growth: 10.27% vs. Industry Median 10.27%
- Expected Revenue Growth: 7.61% vs. Industry Median 5.16%
- Net Margins: 2.92% vs. Industry Median 2.25%
Options Trade
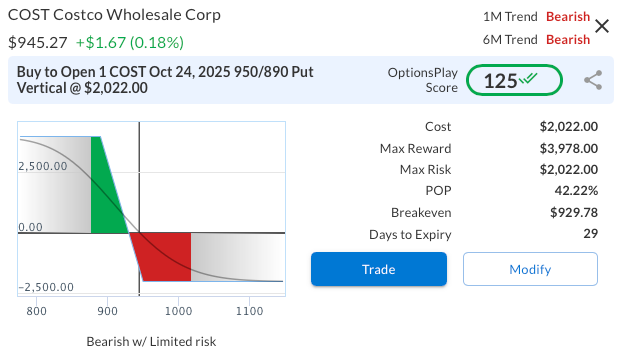
To position for potential downside while maintaining defined risk, we recommend a 950/890 Bear Put Vertical Spread expiring Oct 24, 2025, entered at a net debit of $20.22 ($2,022 total). The trade risks $2,022 to achieve a maximum potential reward of $3,978 if shares close below $890 at expiry. Structuring the trade this way allows for a favorable risk/reward profile (nearly 2:1) while avoiding the high implied volatility premiums of outright long puts. This spread benefits from a decisive move lower following earnings but limits losses should Costco surprise to the upside.
COST – Daily
Trade Details
Strategy Details
Strategy: Long Put Vertical Spread
Direction: Bearish Debit Spread
Details: Buy to Open 1 COST Oct 24 $950/$890 Put Vertical Spreads @ $20.22 Debit per Contract.
Total Risk: This trade has a max risk of $2,022 (1 Contract x $2,022) based on a hypothetical $100k portfolio risking 2%. We suggest risking only 2% of the value of your portfolio and divide it by $2,022 to select the # contracts for your portfolio.
Trend Continuation Signal: This is a bearish trade on a stock that is expected to continue lower over the duration of this trade.
1M/6M Trends: Bearish/Bearish
Relative Strength: 3/10
OptionsPlay Score: 125
Stop Loss: @ $10.11 (50% loss of premium)
View COST Trade
Entering the Trade
Use the following details to enter the trade on your trading platform. Please note that whenever there is a multi-leg option strategy, it should be entered as a single trade.
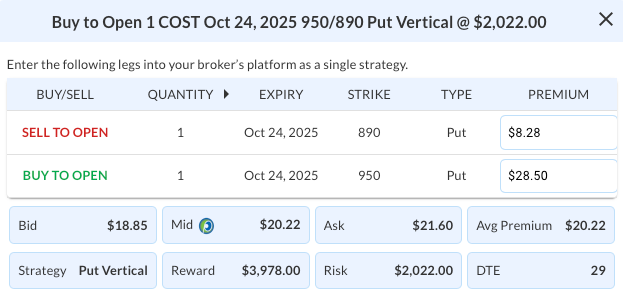
PLEASE NOTE that these prices are based on Wednesday’s closing prices. Should the underlying move significantly during the pre-market hours, we will likely adjust the strikes and prices to reflect a more accurate trade entry.
View COST Trade
More DailyPlay
DailyPlay – Opening Trade (SPY) & Closing Trade (C) – October 15, 2025
Closing Trade SPY Bearish Opening Trade Signal Investment...
Read MoreDailyPlay – Opening Trade (SPOT) – October 14, 2025
SPOT Bearish Opening Trade Signal Investment Rationale...
Read More


Share this on