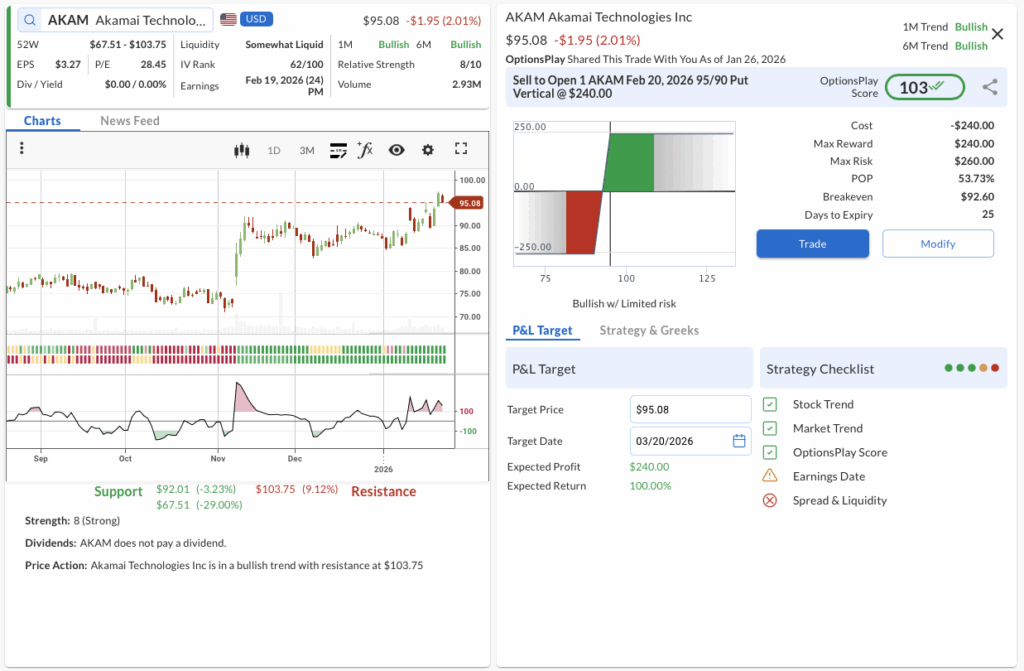
The Trade:Sell to Open the AKAM Feb 20 2026 95/90 Put Vertical @ $2.40 Credit.
🔴 SELL TO OPEN Feb 20 2026 95 Put @ $5.45
🟢 BUY TO OPEN Feb 20 2026 90 Put @ $3.05
Trade Metrics: POP: 54% | Collect $240 per contract vs. a Max Risk of $260 (1.08:1).
The Why: While AKAM is not expected to grow as fast as its peers, its superior profitability suggests that there remains significant upside embedded in its discounted valuation.
The Technicals: AKAM recently broke out above its $85 resistance level while outperforming the S&P 500, and its recent behavior confirms this level as support, providing a foundation for a move toward the $102 target.
Management:⚠️ Warning: Earnings is scheduled for Feb 19, 2026, which may require active management.
Stop Loss:Buy to Close the trade at $4.80 (200% of credit received).
Take Profit:Buy to Close the trade at $1.20 (50% gain).
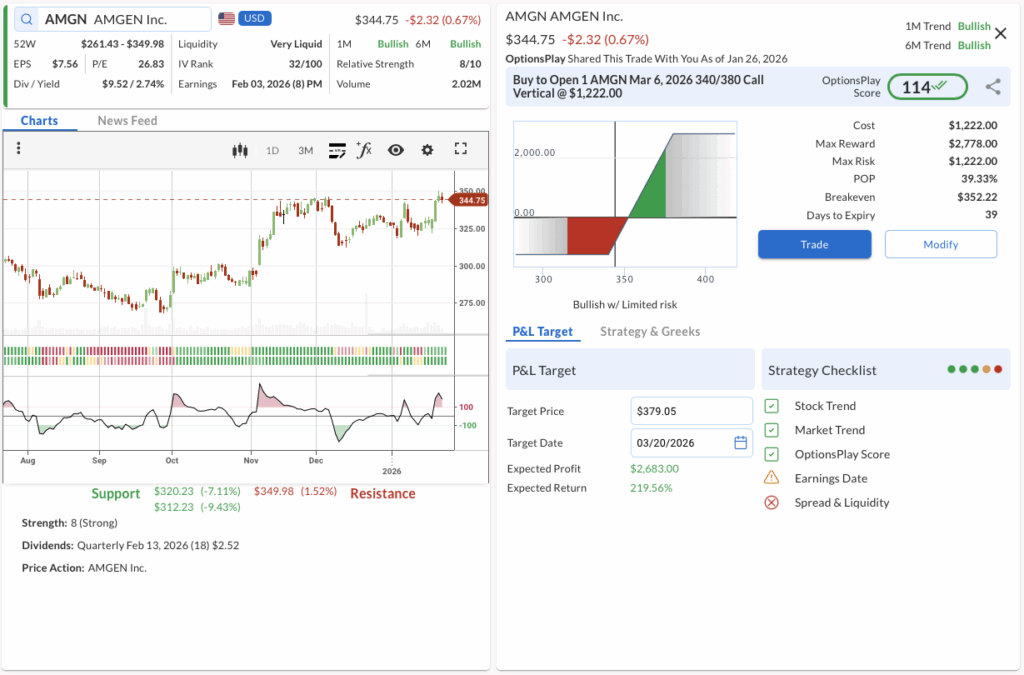
The Trade:Buy to Open the AMGN Mar 6 2026 340/380 Call Vertical @ $12.22 Debit.
🟢 BUY TO OPEN Mar 06 2026 340 Call @ $14.48
🔴 SELL TO OPEN Mar 06 2026 380 Call @ $2.26
Trade Metrics: POP: 39% | Pay $1,222 per contract vs. a Max Reward of $2,778 (2.27:1).
The Why: With a robust pipeline and strong cash flows, Amgen remains a defensive growth favorite, offering resilience and upside potential in the current market environment.
The Technicals: The stock has established a strong uptrend, breaking above the $325 level and holding support, with the price action consolidating near highs ($344.75), signaling potential for a continuation run toward the $380 strike.
Management:⚠️ Warning: Earnings is scheduled for Feb 03, 2026, which may require active management.
Stop Loss:Sell to Close the trade at $6.11 (50% loss).
Take Profit:Sell to Close the trade at $21.39 (175% gain).
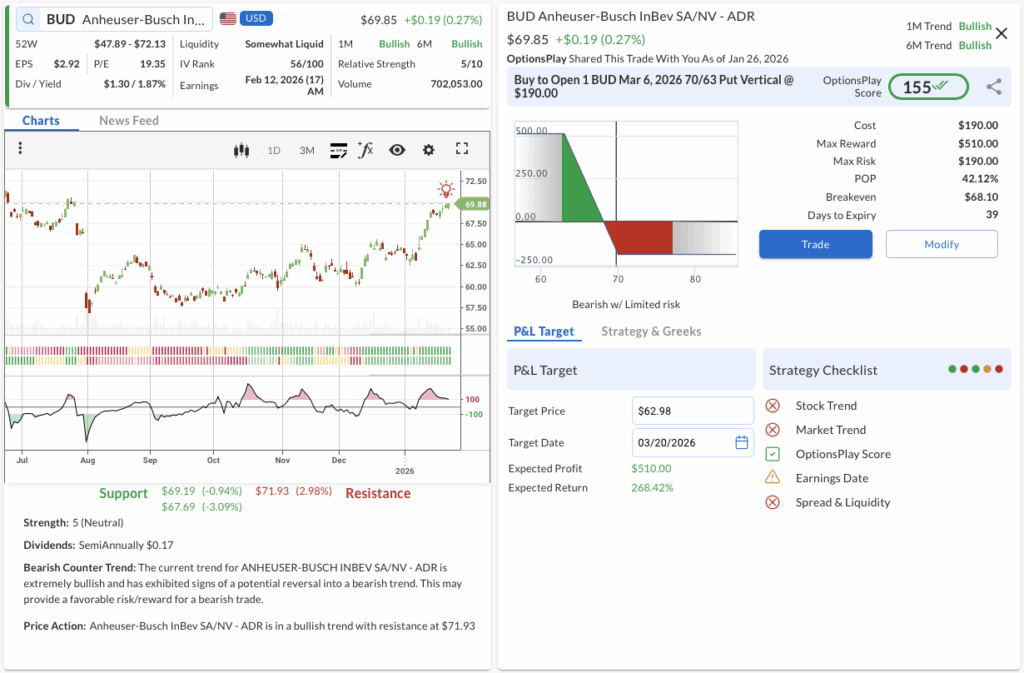
The Trade:Buy to Open the BUD Mar 6 2026 70/63 Put Vertical @ $1.90 Debit.
🟢 BUY TO OPEN Mar 06 2026 70 Put @ $2.60
🔴 SELL TO OPEN Mar 06 2026 63 Put @ $0.70
Trade Metrics: POP: 42% | Pay $190 per contract vs. a Max Reward of $510 (2.68:1).
The Why: Valuation headwinds and slowing volume growth suggest the recent rally is overextended, creating a compelling fundamental setup for a mean-reversion trade.
The Technicals: BUD price action is stalling near the $71.93 resistance level, and with the “Bearish Counter Trend” signal active, the failure to break higher suggests a likely pullback toward the $63 support zone.
Management:⚠️ Warning: Earnings is scheduled for Feb 12, 2026, which may require active management.
Stop Loss:Sell to Close the trade at $0.95 (50% loss).
Take Profit:Sell to Close the trade at $3.33 (175% gain).


Share this on