
$NEM

DailyPlay – Opening Trade (NEM) Closing Trades (UBER, VRTX) Partial Closing Trade (CRM) – August 10, 2022
Closing Trades
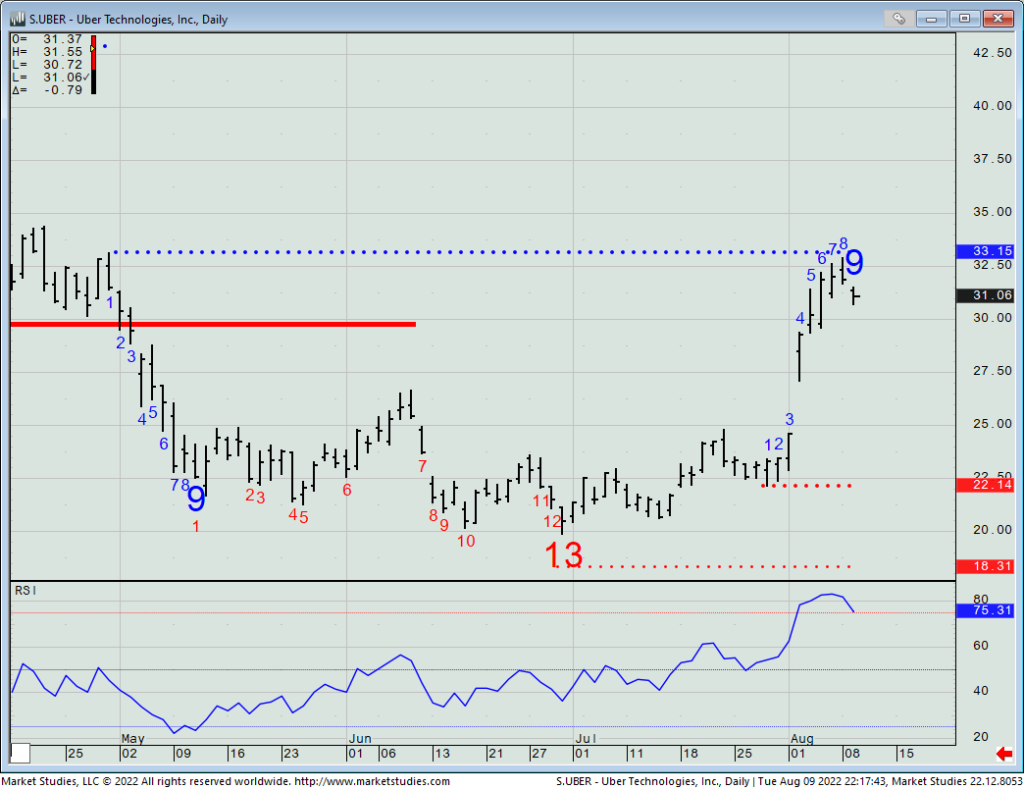
- UBER – 98.39% Gain: Buy to Close 1 Contract Aug 19, 2022 $22.50 Put @ $0.02 Debit. DailyPlay Portfolio: By closing 1 Contract, we will be paying $2. Initially, we only opened 1 Contract, which we are now closing.
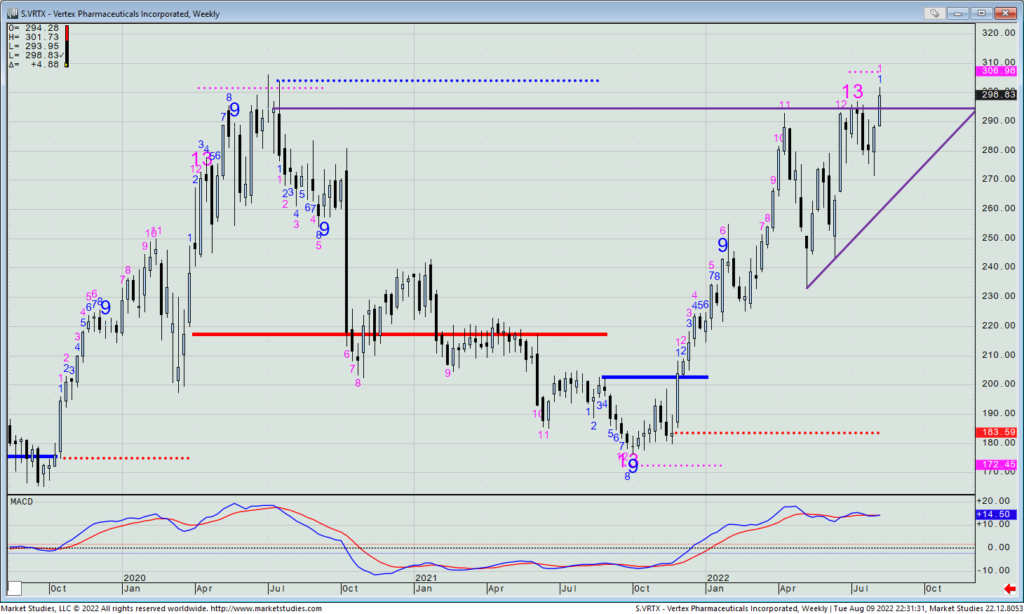
- VRTX – 24.61% Loss: Buy to Close 1 Contract Aug 19, 2022 $290/$310 Call Verticals @ $9.47 Debit. DailyPlay Portfolio: By closing the remaining 1 of 2 Contracts, we will be paying $947. We took partial profits for this trade on August 2 at a $2.73 Debit. Therefore, the average gain on this trade is 23.55 % and the average cost basis to exit this trade is $5.81 Debit.
Partial Closing Trade
- CRM -18.49% Gain: Buy to Close 1 Contract Sept 2, 2022 $175/$160 Put Verticals @ $3.57 Debit. DailyPlay Portfolio: By closing 1 of the 2 Contracts, we will be paying $357.
Bullish Opening Trade Signal
Strategy Details
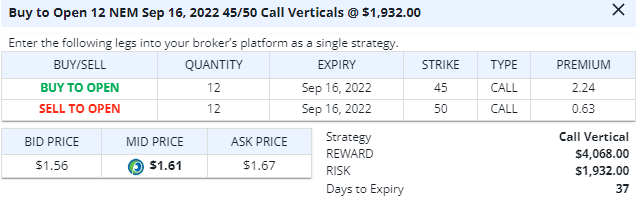
Strategy: Long Call Vertical Spread
Direction: Bullish
Details: Buy to Open 12 Contracts Sept 16, 2022 $45/$50 Call Verticals @ $1.61 Debit.
Total Risk: This trade has a max risk of $1,932 (12 Contracts x $161 per contract).
Counter Trend Signal: This is a Bullish trade on a stock that is experiencing a bearish trend.
1M/6M Trends: Bearish/Bearish
Technical Score: 2/10
OptionsPlay Score: 118
Entering the Trade
Use the following details to enter the trade on your trading platform. Please note that if there is a multi-leg option strategy, it should be entered as a single trade.
Please note these prices are based on the previous day’s closing prices. Should the underlying move significantly during the pre-market hours, we will likely adjust the strikes and prices to reflect a more accurate trade entry. This will be reflected in the Portfolio tab within the OptionsPlay platform.
Investment Rationale
Stocks took a minor breather yesterday as tech names were hit hardest after Micron disappointed investors. The SPX is still up against general resistance in the 4150 neighborhood, and less bullish traders are taking some profits on recent purchases.
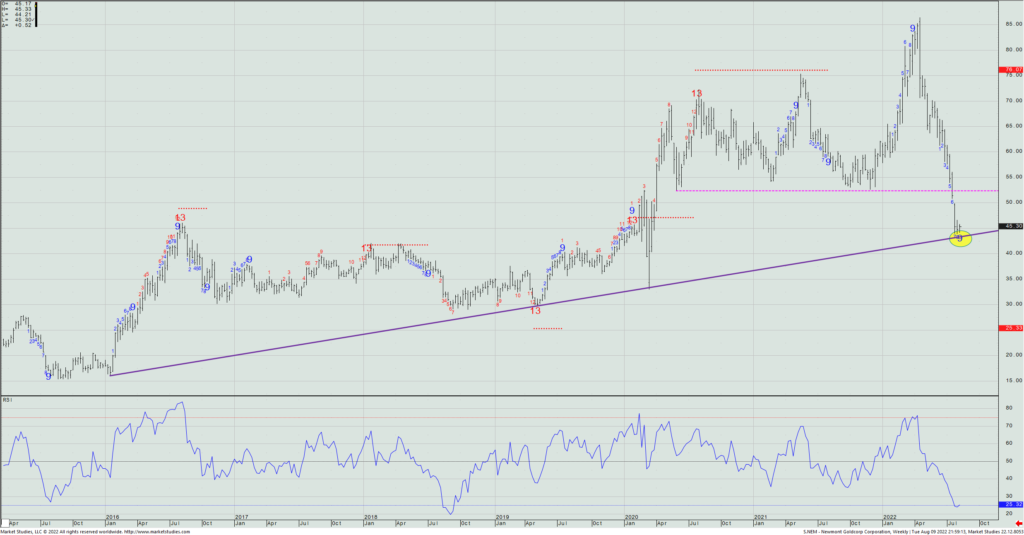
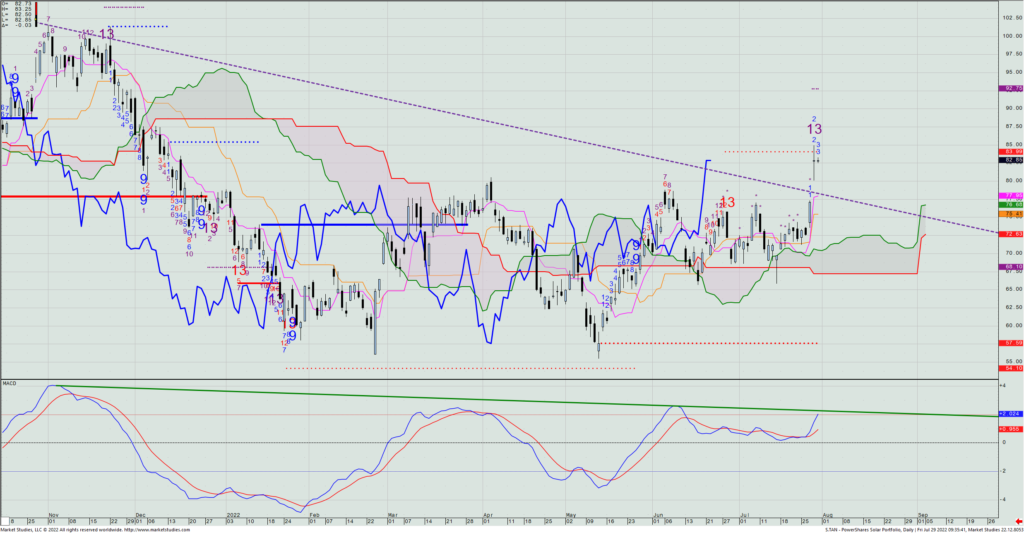
For today’s DP, I noticed that Newmont Goldcorp (NEM) now has a weekly Setup -9 count that is also in the vicinity of its 6-yr. uptrend line from the secular lows in late-2015. As such, and with the VIX near its lows for most of this year, we’ll look to buy a NEM Sept. 16th $45/$50 call spread. Yesterday, this went out at $1.92, and has a very reasonable cost of just 26% of the strike differential.
If the VIX had been nearer 30 (than the current sub-22), I’d really prefer to play this by selling a $45/$37.5 put spread, but there’s just no juice in selling most options right now.
NEM – Weekly
We’re also short two CRM Sept. 2nd $175/$160 put spreads. The stock has stalled right at resistance and yesterday broke beneath its near-term uptrend line. Let’s remove one of those two contracts today.
CRM – Daily

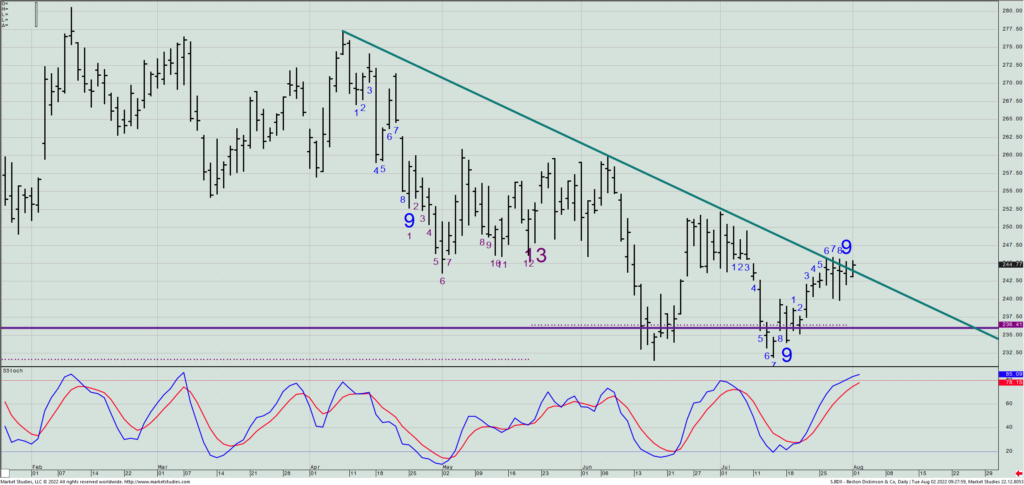
Let’s also close out our short UBER August 19th $22.5 put. We’ve taken out almost the entire value of what we collected (~98%) and with a Setup +9 count against prior TDST resistance, there’s just no reason not to run with what we already have made.
UBER – Daily
Lastly, let’s close out of our short 1 contract of the VRTX August 19th $290/$310 call spread. We’re down about 25%, but with it having reported earnings last week and beaten estimates, we run the risk that this goes up to that $310 area. (When I can, I like taking small losses.)
VRTX – Weekly
$USO, $KR

DailyPlay – Partial Closing Trades (USO, KR) – August 9, 2022
Partial Closing Trades
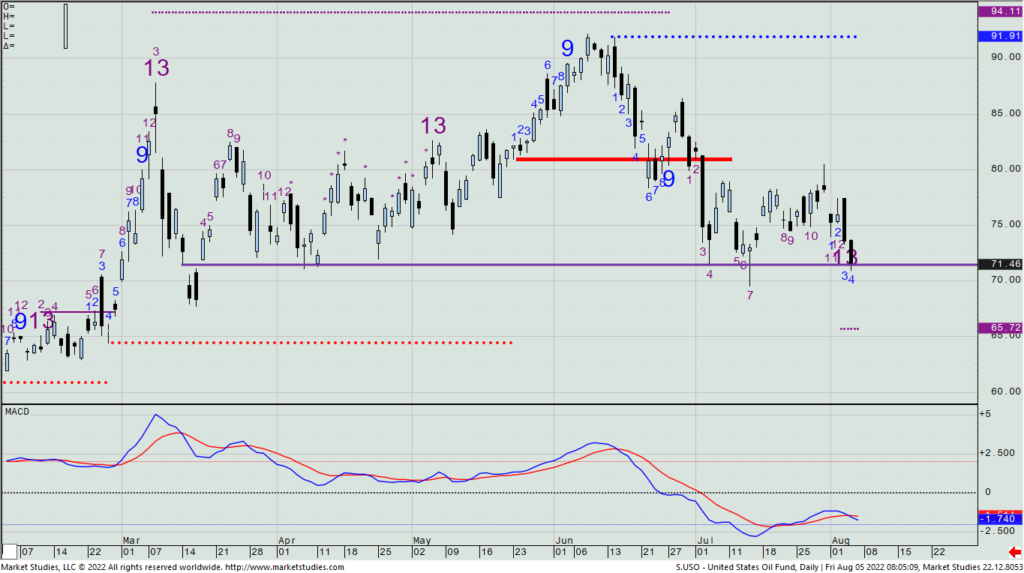
- USO – 44.26% Gain: Buy to Close 1 Contract Aug 12, 2022 $73/$83 Call Verticals @ $1.70 Debit. DailyPlay Portfolio: By closing 1 of the 3 Contracts, we will be paying $170. We closed the 1st of 3 contracts on August 5th and have 1 contract remaining.
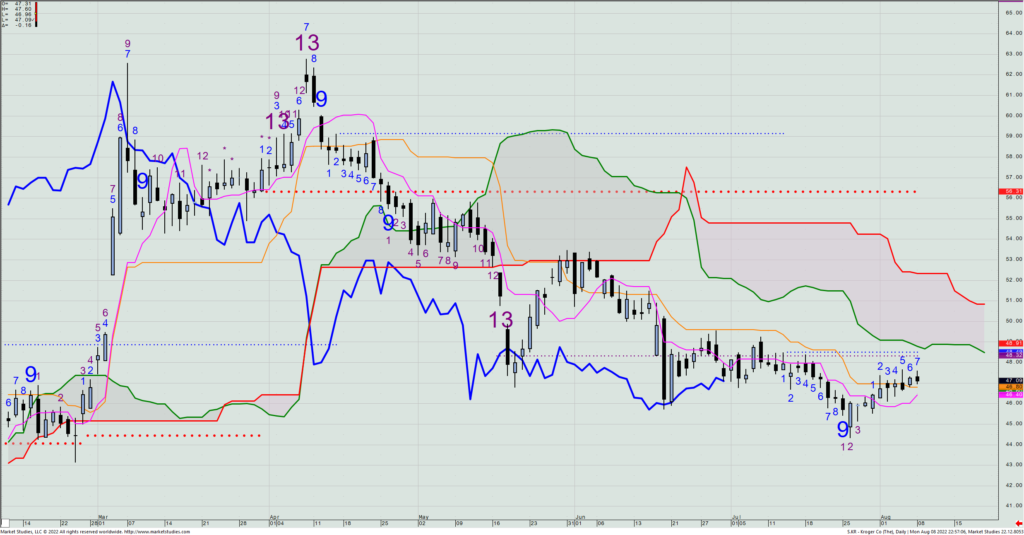
- KR – 83.87% Gain: Buy to Close 28 Contracts Aug 12, 2022 $45/$44 Put Verticals @ $0.05 Debit. DailyPlay Portfolio: By closing all 28 Contracts, we will be paying $140.
Investment Rationale
Monday saw but a 12 bps. loss for the SPX, despite some lousy earnings reports out that, could have made for a far worse loss than the 5 pt. drop. So, again, we are seeing a market get bearish news, but not sell-off. That usually means that there is still more upside room to go, as trapped shorts from lower levels are simply not given a chance to get out anything near breakeven. Short squeezes can be and are often vicious.
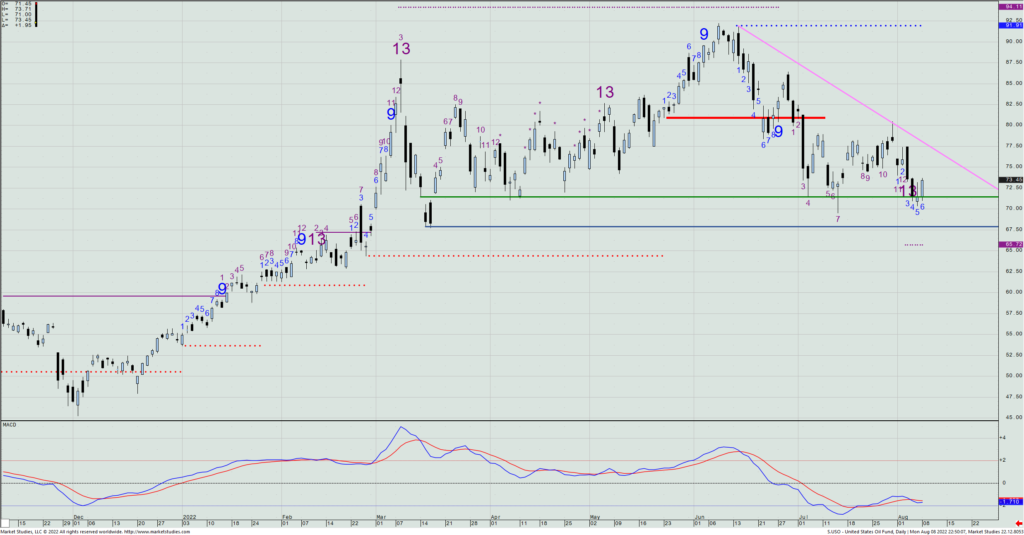
Today we will take off one of the two remaining USO short $73/$83 spread contracts we have that expire this Friday. Last week we took off the first of three, and with the USO going out on Monday at $73.54, it’s just too close to the $73 strike to do much else with it. (As a reminder, every Wednesday at 10:30am ET the oil market gets the weekly API inventory report. It’s basically the biggest news driver for the oil market each week.) So, tomorrow’s number will determine if that last contract we have on will be a winner or loser. (If you are not comfortable in taking that “gamble” to play that news, then feel free to exit the trade today. We’ve made money in it.)
USO – Daily
We’re also short an August 5th XLC $55/$61 call spread, so we’re running out of time for this to work. The We also have a short KR $45/$44 put spread that expires Friday, with 28 contracts on. With that position up 84% with just a few days to go, let’s take off 10 of the contracts today.
KR – Daily
$INTC
DailyPlay – Opening Trade (INTC) – August 8, 2022
Bullish Opening Trade Signal
Strategy Details
Strategy: Long Call Diagonal Spread
Direction: Bullish
Details: Buy to Open 3 Contracts (Buy Jan 20, 2023 $35) / (Sell Sept 9, 2022 $38) Call Diagonals @ $3.10 Debit.
Total Risk: This trade has a max risk of $1,866 (3 Contracts x $622 per contract).
Counter Trend Signal: This is a Bullish trade on a stock that is experiencing a bearish trend.
1M/6M Trends: Bearish/Bearish
Technical Score: 2/10
OptionsPlay Score: 112
Entering the Trade
Use the following details to enter the trade on your trading platform. Please note that if there is a multi-leg option strategy, it should be entered as a single trade.
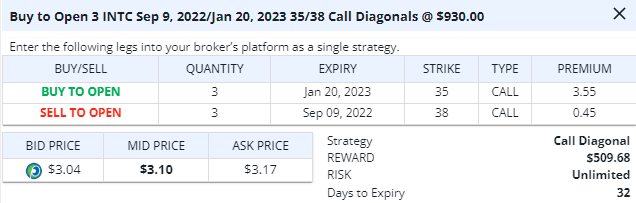
Please note these prices are based on the previous day’s closing prices. Should the underlying move significantly during the pre-market hours, we will likely adjust the strikes and prices to reflect a more accurate trade entry. This will be reflected in the Portfolio tab within the OptionsPlay platform. Finally, the Risk for this trade is not Unlimited, but $622 per contract.
Investment Rationale
With INTC currently trading at a long-term support level of $35, we expect some market memory to come into play here. This is the price level from where INTC broke higher in 2017, and has now retraced towards. With regards to the sentiment on this stock, 26% of analysts have a BUY rating, they don’t expect EPS and revenue growth until 2024 and they have reached peak bearish sentiment. Therefore, the sentiment on the street is seen as overly bearish which leads us to take a contrarian stand on this stock. We will therefore be taking some Long exposure.
INTC – Daily


DailyPlay Update – August 5, 2022
It’s another summer Friday. Boy, do they come quickly. But to most of us, we’re glad to see the rally last that started last Wednesday when the Fed again raised rates. Despite several Fed governors telling us earlier this week that they were not done tightening – the very opposite of the supposed reason behind the equity market’s rally – they’ve continued to edge higher.
So, when you think it through, there clearly was some other reason that stocks have not sold off after the clarification of the Fed still needs to push yields higher. If it’s as simple as I suggested yesterday – that the bearish positioning was so strong that two weeks ago’s rally is pushing to a five-week high and also seeing price extend up above the weekly Conversion Line – then this rally is more than halfway done. (Bear market rallies can be vicious.) However, if it’s the real McCoy (i.e. If this is real buying largely fueled by new money coming into the market (rather than shorts bidding up stocks to cover bad positions) then any pullback to support needs to be bought.
I’m definitely in the camp of the former and think that when we see most convinced that new 2022 highs will come later this year – then, and only then, will I really play for a down move that potentially comes lethally and swiftly – for there will be few to no shorts left to cushion the decline, and few buyers to bid for stocks they already bought higher.
In the meantime, the SPX has reached an obvious resistance level in the 4150 +/- 1% area where we saw it previously break down from. Let’s see what today brings with oil still tailing off and whether there will be continued enthusiasm that inflation has peaked.
And lastly, start planning on what you will do if the market continues higher. Buy more? Thankfully sell? Or just hold (and deal with the future ups and downs at a later time)?
Though oil has finally gone our way with just a week to go before the expiration of our short Aug. 12th USO $73/$83 call spread, let’s take off one of the three contracts we have on to lock some profit. The daily chart posted a Sequential -13 on Wednesday, so better safe than sorry.
USO – Daily
Enjoy your weekend.
– Rick Bensignor
Chief Market Strategist
$T
DailyPlay – Opening Trade (T) – August 4, 2022
Bullish Opening Trade Signal
Strategy Details
Strategy: Short Put Vertical Spread
Direction: Bullish
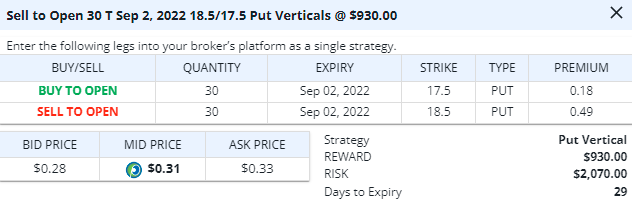
Details: Sell to Open 30 Contracts Sept 2, 2022 $18.50/$17.50 Put Verticals @ $0.31 Credit.
Total Risk: This trade has a max risk of $2,070 (30 Contracts x $69 per contract).
Counter Trend Signal: This is a Bullish trade on a stock that is experiencing a bearish trend.
1M/6M Trends: Bearish/Bearish
Technical Score: 5/10
OptionsPlay Score: 80
Entering the Trade
Use the following details to enter the trade on your trading platform. Please note that if there is a multi-leg option strategy, it should be entered as a single trade.
Investment Rationale
Bulls and squeezed bears continue to push stocks higher, even with Fed officials contradicting investors’ beliefs that they were “pivoting” to a more dovish view. (I told you immediately after last week’s Powell press conference that they were not, and that the Street had that interpretation wrong.) Nonetheless, the market continues to rip, and has significantly gained since the FOMC rate adjustment last Wednesday.
Something is amiss, given that the “No, we’re not done” statements didn’t undo the rally. In theory, it should have more than Tuesday’s one-day decline. Which means one very important thing to me: Bearish positioning was so strong that not even bad news can get the market down enough to give the shorts an out, leading me to think that we still need to do more upside squeezing before the market can actually fall again
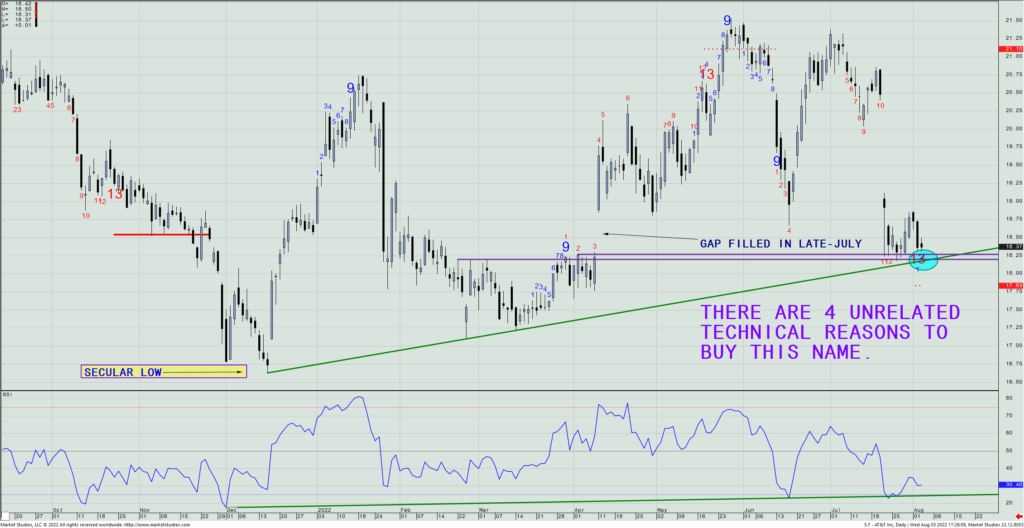
Today, I’m looking at putting on a bullish play in a beaten down, unloved name: AT&T (T). Its weekly chart shows it still holding above its uptrend line; support from prior highs; and, by chance, now also shows its first daily Sequential -13 downside exhaustion signal of the year.
- You could simply choose to buy the stock outright.
- You could choose to buy a call spread.
- You could choose to sell an at-the-money or slightly in-the-money put
- You could choose to sell a put spread.
I’m not going to lay out each and every one of those idea’s trade parameters, but I’ll simply lay out selling a September 2nd $18.50/$17.50 put spread for what yesterday closed at $0.305. You’re collecting ~31% of the strike differential, and if exercised you’re essentially buying the stock at about $18.20, a bit lower than it is now.
T – Daily
$TLT

DailyPlay – Opening Trade (TLT) – August 3, 2022
Bearish Opening Trade Signal
Strategy Details
Strategy: Long Put Vertical Spread
Direction: Bearish
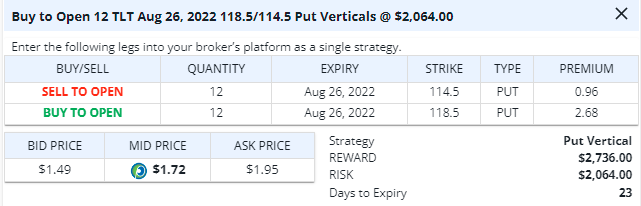
Details: Buy to Open 12 Contracts Aug 26, 2022 $118.50/$114.50 Put Verticals @ $1.72 Debit.
Total Risk: This trade has a max risk of $2,064 (12 Contracts x $172 per contract).
Counter Trend Signal: This is a Bearish trade on a stock that is experiencing a bullish trend.
1M/6M Trends: Bullish/Neutral
Technical Score: 4/10
OptionsPlay Score: 107
Entering the Trade
Use the following details to enter the trade on your trading platform. Please note that if there is a multi-leg option strategy, it should be entered as a single trade.
Please Note that this is a CONDITIONAL TRADE. See the Condition below. The strike prices, premiums, and OptionsPlay Score will therefore be slightly different when the condition is met, and we enter this trade.
Investment Rationale
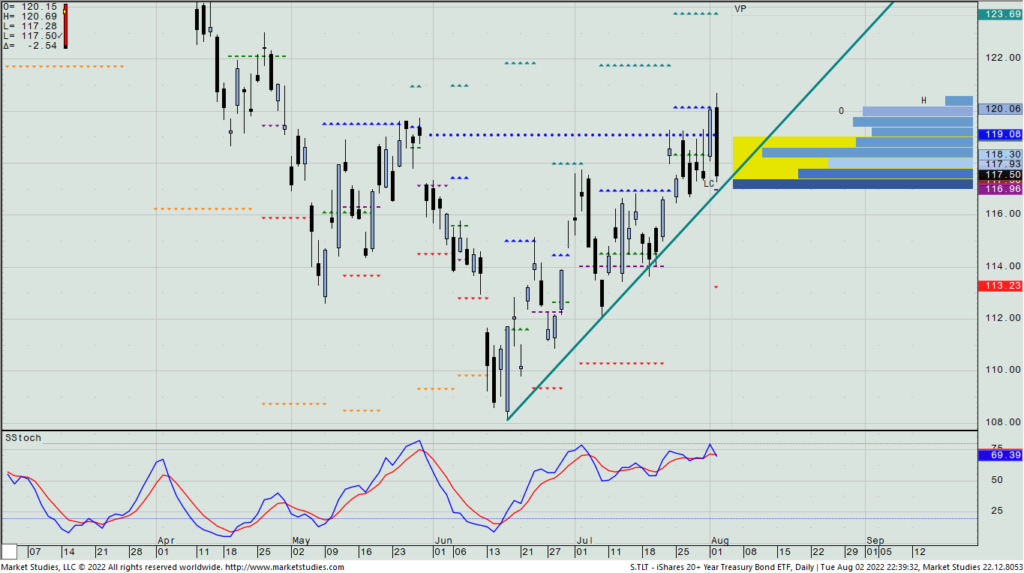
I’ve recently been telling you that the TLT needs to get Friday closes above $119.42 to potentially create a bigger breakout to $130+. But yesterday’s multiple Fed governor statements that the Fed is “not” done raising rates – something I’ve been saying since last week – along with the UST 10yr. bouncing on the weekly Base Line at 2.58% (to yesterday’s close at 2.74%), makes me think that rates will actually head towards 3% in the near term. If so, we will look to fade the 6-week-long TLT rally.
THE CONDITIONAL TRADE: IF the TLT trades (anytime today or during the rest of this week) up to $118.50 to $119.00, we’ll then look to buy an August 26th $118.50/$114.50 put vertical at the then current mid-price of the spread, playing for the TLT to lose value to break its uptrend line and sell down into the $114 area.
TLT – Daily
$BDX, $VRTX, $ADI, $DAL, $XLC
DailyPlay – Partial Closing Trades (BDX, VRTX, ADI) Closing Trades (DAL, XLC) – August 2, 2022
Partial Closing Trades
- BDX – 57.41% Gain: Buy to Close 2 Contracts Aug 5, 2022 $237.5/$230 Put Verticals @ $1.15 Debit. DailyPlay Portfolio: By closing 2 of 4 Contracts, we will be paying $230.
- VRTX – 71.71% Gain: Buy to Close 1 Contract Aug 19, 2022 $290/$310 Call Verticals @ $2.15 Debit. DailyPlay Portfolio: By closing 1 of 2 Contracts, we will be paying $215.
- ADI – 61.54% Loss: Buy to Close 2 Contracts Aug 26, 2022 $165/$175 Call Verticals @ $6.30 Debit. DailyPlay Portfolio: By closing 2 of 3 Contracts, we will be paying $1,260.
Closing Trades
- DAL – 53.46% Gain: Sell to Close 6 Contracts Aug 19, 2022 $30/$35 Call Verticals @ $2.44 Credit. DailyPlay Portfolio: By closing the remaining 6 of the 12 Contracts, we will be receiving $2,928. We took partial profits for this trade on July 21 at a $2.73 Credit. Therefore, the average gain on this trade was 62.58 % and the average cost basis to exit this trade is $2.59 Credit.
- XLC – 31.67% Loss: Buy to Close 5 Contracts Aug 5, 2022 $55/$61 Call Verticals @ $2.37 Debit. DailyPlay Portfolio: By closing all of the 15 Contracts, we will be paying $1,185. Note: this was a conditional trade that was closed for a profit at 10am this morning, when the condition described below was met.
Investment Rationale
Equities saw a mild sell-off yesterday, and not something unexpected by me given that Friday’s rally closed right on resistance levels in both the SPY and QQQ. Was this but a one-day decline, or will we see some more? I suspect we’ll see a bit more before another more significant rally occurs over the coming weeks leading into the Jackson Hole meeting that investors will keenly focus on later this month. Between now and then, earnings and interest rates will most likely be the day-to-day driving force behind the market’s moves.
With just 4 trading days to go to expiration of our short August 5th BDX $237.50/$230 put spread, and the stock has closed at $244.71 yesterday, I see a daily Setup +9 count that also shows an overbought MACD move, along with the past 5 days in a row of roughly the same high. That is surely enough for me to take off 2 of the 4 contracts we have on this morning (generally, I don’t usually trade options before 9:50am ET earliest to get past less savvy retail investors’ orders). Moreover, should today also head into the last 20 mins. of trading at a price beneath Friday’s low of $242.02, then we’ll also kick out the remaining 2 contracts by the close.
BDX – Daily
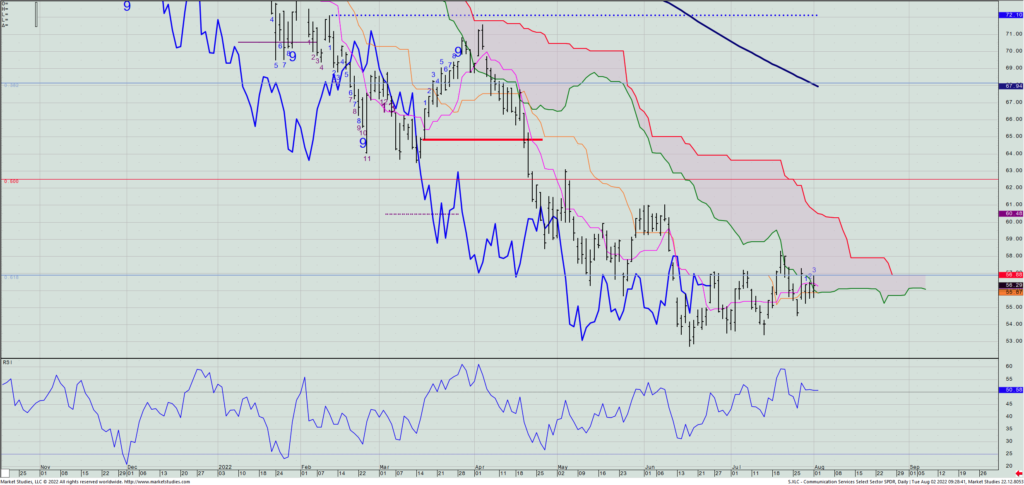
We’re also short an August 5th XLC $55/$61 call spread, so we’re running out of time for this to work. The stock closed yesterday at $56.29, so we’re well within striking distance of the $55 becoming out of the money for the call buyer by then. But with little time left, let’s put a bid in at the same $1.80 we originally shorted it for to potentially wash the trade in the next day or two. If we don’t get filled, we’ll exit on Thursday to avoid being exercised.
XLC – Daily
$UBER
DailyPlay – Opening Trade (UBER) – August 1, 2022
Bullish Opening Trade Signal
Strategy Deta
Strategy: Short Put
Direction: Bullish
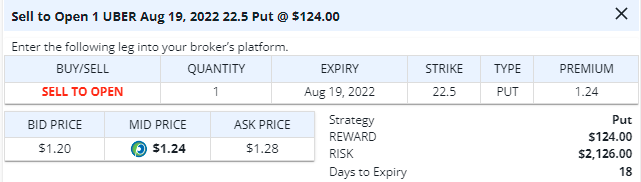
Details: Sell to Open 1 Contract Aug 19, 2022 $22.50 Put @ $124 Credit.
Total Risk: This trade has a max risk of $2,130 (1 Contract x $2,130 per contract).
Trend Continuation Signal: This is a Bullish trade on a stock that is experiencing a bullish trend.
1M/6M Trends: Bullish/Neutral
Technical Score: 2/10
OptionsPlay Score: N/A
Entering the Trade
Use the following details to enter the trade on your trading platform. Please note that if there is a multi-leg option strategy, it should be entered as a single trade.
Investment Rationale
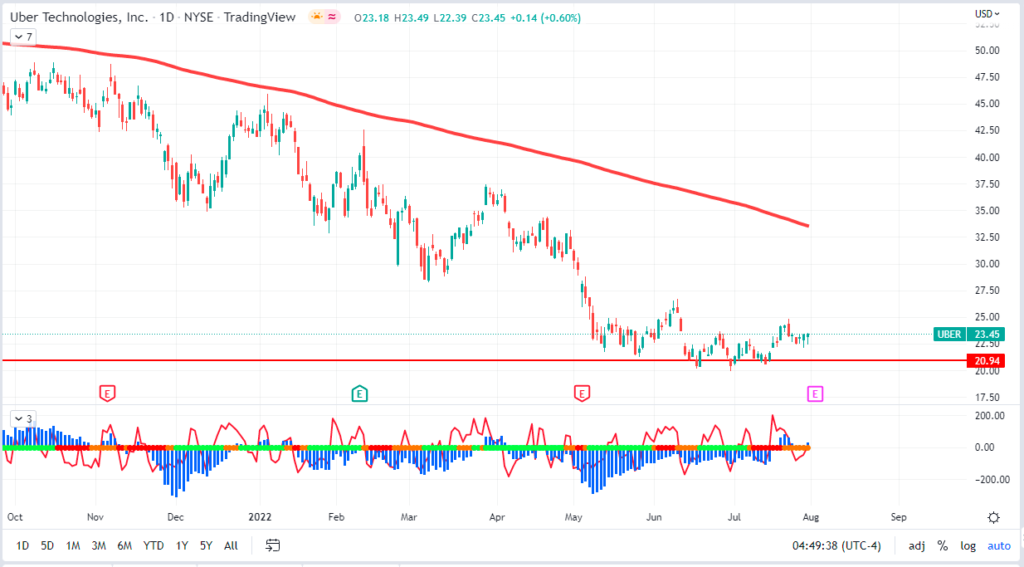
By looking at the UBER chart, we can see a primary downtrend since February 2021. Over the last few months, we saw a bottom coming in as an inverted head-and-shoulders formed, and this targets about $28 to the upside which we could see on the earnings catalyst. Another factor to consider for a bullish trade is the comparison between UBER and its biggest rival, LYFT. LYFT’s revenue growth has been half of what we see in UBER. More interesting is the rich Implied Volatility as we are going into earnings. Right now the market is implying a +- 12% move versus the historical average of only +- 5.3% over the last 8 quarters. What we will be doing is to harvest this Implied Volatility by Selling a naked Put option.
UBER Daily
$TAN, $DE
DailyPlay Partial Closing Trade (TAN) Closing Trade (DE) July 29, 2022
Partial Closing Trade
- TAN -69.31% Gain: Buy to Close 1 Contract Aug 5, 2022 $70.50/$61 Put Verticals @ $0.85 Debit. DailyPlay Portfolio: By closing 1 of 3 Contracts, we will be paying $85.
Closing Trade
- DE -99.46% Loss: Buy to Close 2 Contracts Aug 12, 2022 $295/$315 Call Verticals @ $18.35 Debit. DailyPlay Portfolio: By closing 2 of the 2 Contracts, we will be paying $3,670.
Investment Rationale
We’ve just reviewed all open DP positions in our morning webinar. Two charts make me want to adjust positioning:
We are short 3 TAN Aug. 12th $70.5/$61 put spread. With the stock now on a daily +13 and against the stop-out level from a prior +13, let’s take one of the three spreads off today to lock in a 90% profit on that contract.
TAN – Daily
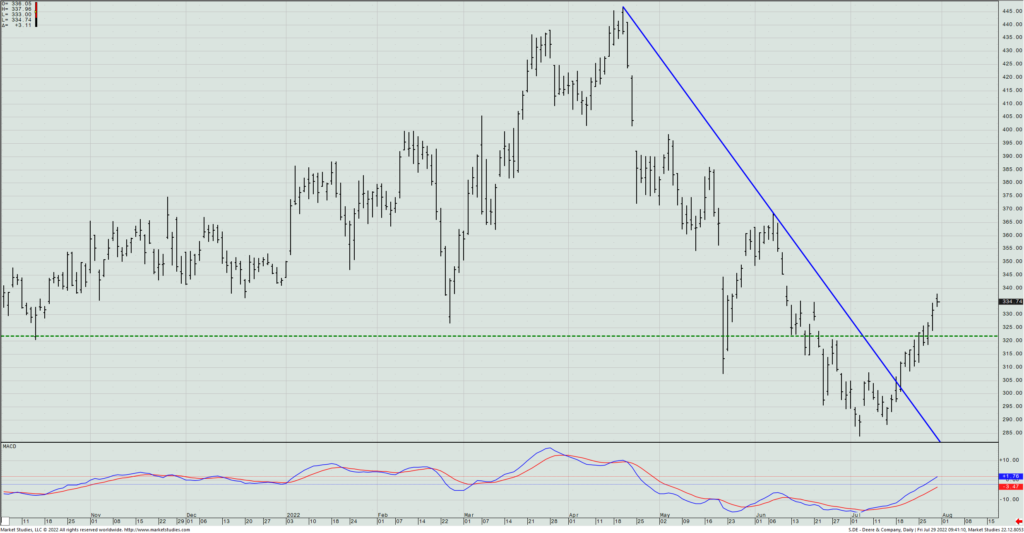
We are short 2 Aug. 12th DE $295/$315 call spread. We’ve lost the same amount equal to the premium we collected, and there’s less than a 10% chance this comes back to work out. Thus, let’s just take our loss before it gets worse and exit this spread today.
DE – Daily
DailyPlay Update – July 29, 2022
Investors have looked extremely favorably at Fed Chair Powell’s remarks from his press conference earlier this week, and have continued on a rampant buying spree to add a 1.2% SPX gain yesterday onto Wednesday’s over 2% gain. With Amazon and Apple providing good numbers after yesterday’s close, I see S&P futures already up near 4100 as I write this Thursday evening. That’s some 450 pts. (or about 12.5%) higher than the intraday low marked just six weeks ago.
Though I strongly believe that this rally will lead to an upcoming solid selling opportunity, for now, it’s another summer Friday and let’s look to see if today finishes strong or sees profit-taking.
Enjoy your weekend.
– Rick Bensignor
Chief Market Strategist