$USO, $INTC

DailyPlay – Closing Trade (USO) Trade Adjustment (INTC) – September 8, 2022
Closing Trade
- USO – 89.57% Loss: Sell to Close 8 Contracts Sept 16, 2022 $75/$81 Call Verticals @ $0.24 Credit. DailyPlay Portfolio: By Closing all 8 Contracts, we will be receiving $192.
Trade Adjustment
- INTC – 64.19% Unrealized Loss. Roll the Sept 9 $38 Call to the Oct $35 Call @ $0.24 Credit
- Buy to close Sep 9, $38 Call @ $0.01 Debit (originally opened at $0.45 credit)
- Sell to open Oct 21, $35 Call @ $0.25 Credit
- This results in a reduced premium for the INTC Long Call Diagonal Trade to $2.86 ($3.10 – $0.24)
Investment Rationale
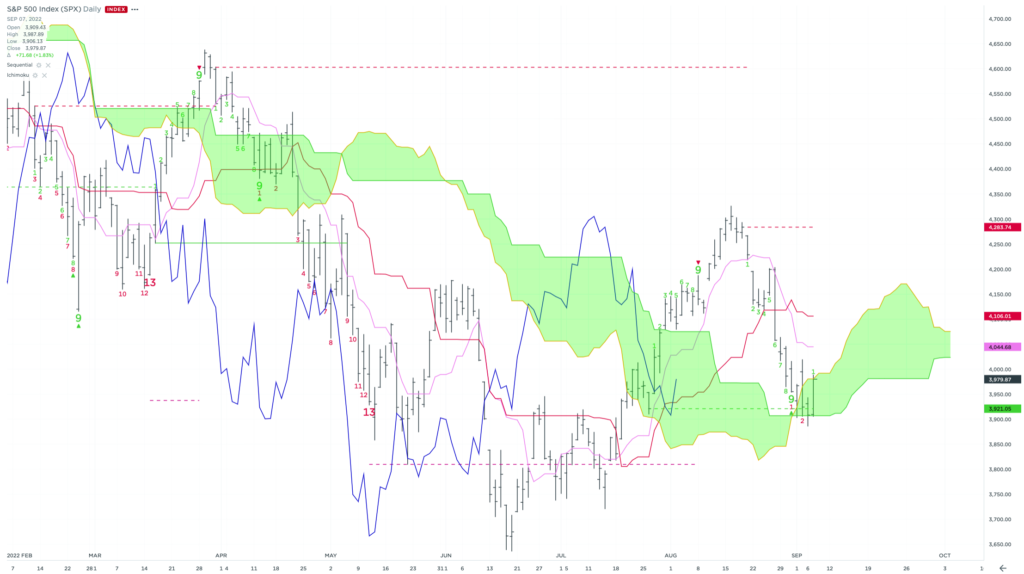
Bulls managed to muster the most strength that we’ve seen in a few weeks yesterday. We closed just above the top of the Daily Cloud and we will see bulls can push higher today into the 4050-4100 resistance area (conversion and base line), otherwise, we could see a retest of the 3900 support (cloud bottom) and a potential break towards 3700. Any further strength would be an opportunity to seek additional bearish exposure. Until then we will take this opportunity to reduce some of our long exposure in USO on weakening demand outlook and adjusting our INTC diagonal as we approach the expiration of the short strike.
Close the Full USO Position @ $0.24 Debit
Roll the Sept 9 $38 Call to the Oct $35 Call @ $0.24 Credit
S&P500 Index
$XOM

DailyPlay – Opening Trade (XOM) – September 7, 2022
View XOM Trade
Strategy Details
Strategy: Short Call Vertical Spread
Direction: Bearish
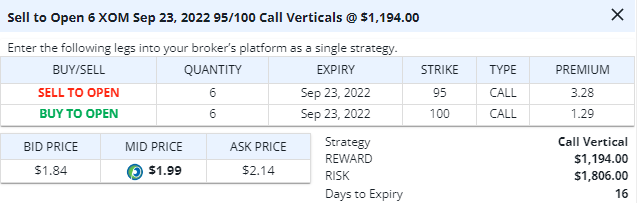
Details: Sell to Open 6 Contracts September 23, 2022 $95/$100 Call Vertical Spreads @ $1.99 Credit.
Total Risk: This trade has a max risk of $1,806 (6 Contracts x $301).
Counter Trend Signal: This is a Bearish trade on a stock that is experiencing a bullish trend.
1M/6M Trends: Bullish/Bullish
Technical Score: 1010
OptionsPlay Score: 103
Entering the Trade
Use the following details to enter the trade on your trading platform. Please note that if there is a multi-leg option strategy, it should be entered as a single trade.
Please note these prices are based on the previous day’s closing prices. Should the underlying move significantly during the pre-market hours, we will likely adjust the strikes and prices to reflect a more accurate trade entry. This will be reflected in the Portfolio tab within the OptionsPlay platform.
Investment Rationale
After what appeared to be a day that we could have seen upward prices from how futures traded overnight, yesterday saw those gains evaporate to close lower on the day. Again, we’re getting a sense that the market can’t hold rallies, and in many ways, it’s acting the opposite of how the SPX traded in 2021, when it could barely hold losses.
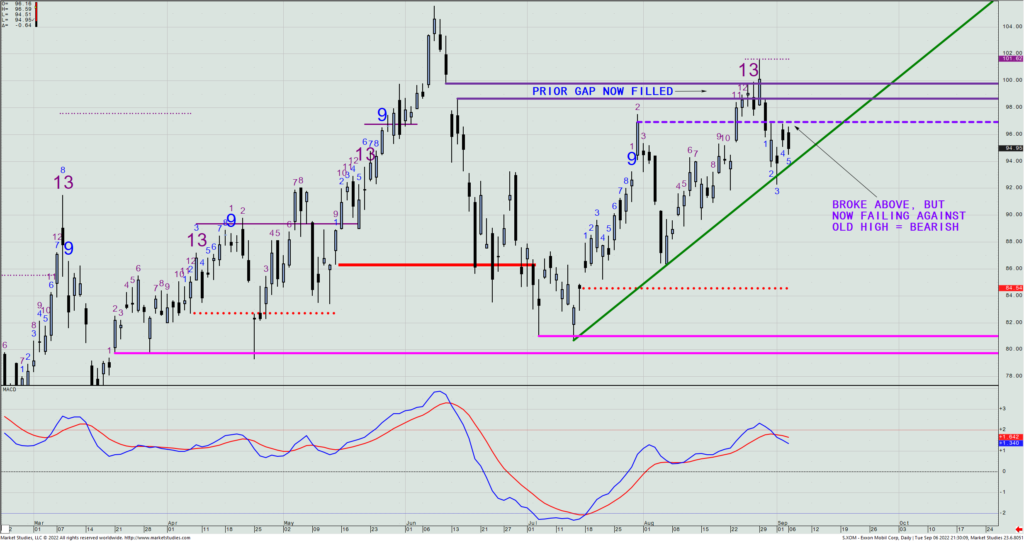
With crude oil looking more and more like its weekly cloud is going to pose overhead resistance going forward, let’s look to short a XOM Sept. 23nrd $95/$100 call spread for what closed yesterday at $2.07 mid. (The higher “hedge” strike would be at a new closing high for the post-July rally.)
XOM – Daily
As a reminder, today is my last OP activity until I return from vacation on Monday, Sept. 18th. Tony will handle all the Daily Plays and webinars for me until then.
$NEM
DailyPlay – Partial Closing Trade (NEM) – September 2, 2022
Partial Closing Trade
- NEM -91.30% Loss: Sell to Close 6 Contracts Sept 16, 2022 $45/$50 Call Verticals @ $0.14 Credit. DailyPlay Portfolio: By Closing 6 of the 12 Contracts, we will be receiving $84.
Investment Rationale
Stocks made a midday rebound and were able to hold on with a day-ending rally to finish Thursday with a gain for the SPX, NDX and DIA. The SPX bounced on its uptrend line from the June low, as well as a TDST Line at 3921. Given the recent rejection of the downtrend line from all-time highs and the bounce today on the uptrend line from the 2022 low, perhaps we get a little reprieve today and next week. However, I do believe that rallies are still meant to sell into, as nothing new has yet changed the bigger macro fundamentals that are not in favor of a general bull market.
Today is the last Friday of the true summer season, and with markets closed in the US on Monday, I’m not apt to want to buy an option today, and not willing to be a seller down here, either. So, it’s like most summer Fridays where we watch and make little tweaks as needed to our overall portfolios.
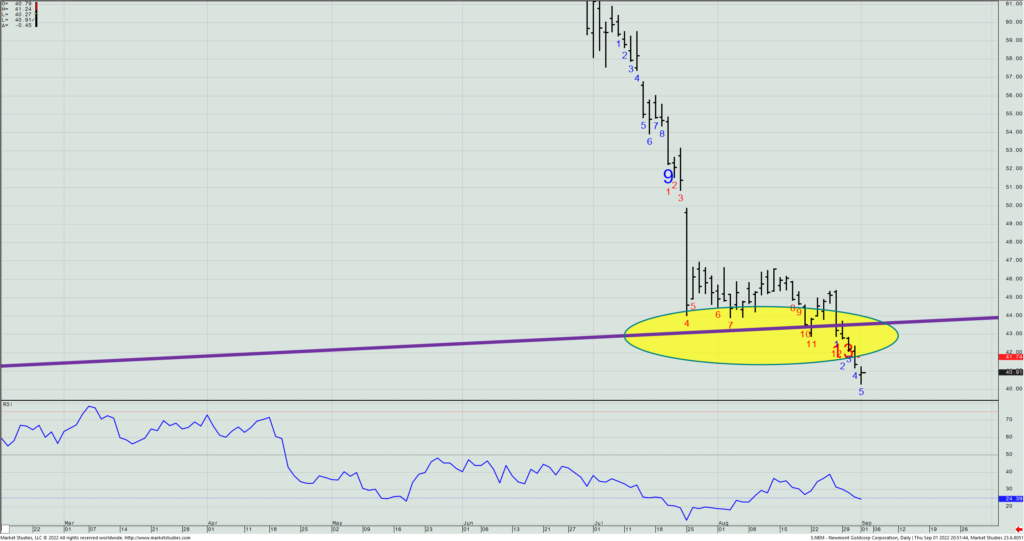
I do think that we need lighten up on our long NEM Sept. 16th $45/$50 call spread. I’ve held off reducing until now because of the daily chart marking a -13 signal on Tuesday, but with price falling beneath NEM’s uptrend line on breakout dollar strength, gold and gold-related names are under deep pressure. Let’s take half off today.
NEM – Daily
$ICLN
DailyPlay – Opening Trade (ICLN) – September 1, 2022
Bearish Opening Trade Signal
Strategy Details
Strategy: Long Put Vertical Spread
Direction: Bearish
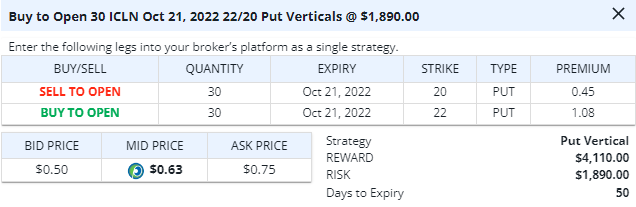
Details: Buy to Open 30 Contracts October 21, 2022 $22/$20 Put Vertical Spreads @ $0.63 Debit.
Total Risk: This trade has a max risk of $1,890 (30 Contracts x $63).
Counter Trend Signal: This is a Bearish trade on a stock that is experiencing a neutral to bullish trend.
1M/6M Trends: Neutral/Bullish
Technical Score: 10/10
OptionsPlay Score: 135
Entering the Trade
Use the following details to enter the trade on your trading platform. Please note that if there is a multi-leg option strategy, it should be entered as a single trade.
Please note these prices are based on the previous day’s closing prices. Should the underlying move significantly during the pre-market hours, we will likely adjust the strikes and prices to reflect a more accurate trade entry. This will be reflected in the Portfolio tab within the OptionsPlay platform.
Investment Rationale
Equities are failing to hold any attempt of gains. In fact, I am seeing a pattern along these lines:
- Asia rallies
- The US tries to hold those gains on the NY open
- Europe closes (11:30 NY time) and then it’s sell, sell, sell
That’s not atypical for a bearish market mode.
S&P futures are down some 20 pts. (3936) as I write this Wednesday evening. The bounce I was hoping to see from SPX 4050/4023 has not materialized. The goal was to again be a seller – this time anything near 4125. It’s looking less and less like that’s in the cards.
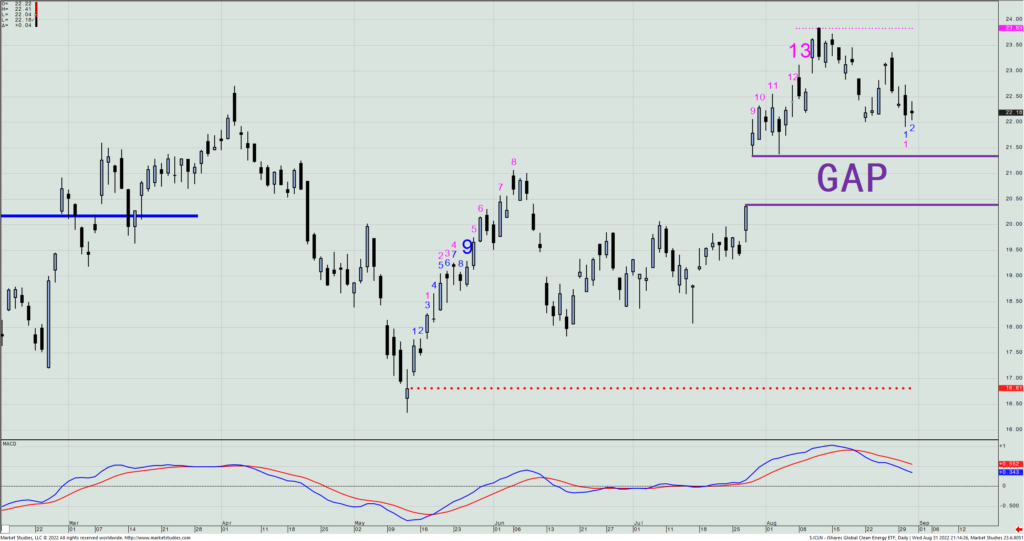
Looking for stocks/ETFs that are showing failing rallies, I see the iShares Global Clean Energy ETF (ICLN) potentially fitting the bill. It topped right at the Risk Level ($23.83) from the daily +13 Combo upside exhaustion signal, and has traded off since then. Given the large unfilled gap that this could easily fill on continued market weakness, let’s look to buy a ICLN October 21st $22/$20 put spread for what closed yesterday at $0.625 mid. That represents 31% of the spread differential, making for a possible max. profit of $1.375.
ICLN – Daily
$VALE
DailyPlay Update – August 31, 2022
Investment Rationale
Stocks got hit yesterday, seeing all overnight gains in futures disappear, as housing data came in weaker than expected, and the Consumer Confidence and JOLT jobs number came in better than expected – the latter two looked at bearishly by investors as it helps show the Fed that they can continue to slow the economy by raising rates further. After the second session of seeing early futures markets rally fade, I sold out of my S&P futures long at the same price (4024) I got in at on Monday. And I’m glad I did, because it saved me today’s downdraft.
Today is the last trading day of August, and Friday – for all practical purposes – the last trading day of the summer. We can still see some increased volatility from both of those “endings”, and with this week the heavily vacationed one it is, don’t be surprised to see some big intraday swings, too.
Today the SPX and SPY will more than likely post daily Setup -9 count s– always a possible trading bounce point. (The NDX and QQQ marked the -9 count yesterday.) Both of these two major US indexes are also near their respective weekly support levels I laid out on Monday (so maybe by Friday’s close those weekly support levels hold for a trading bounce?) However, I still think the big picture is a negative one, and that rallies should be sold into to lighten overall equity market exposure. (It would take a substantial change in known fundamentals to alter my view.)
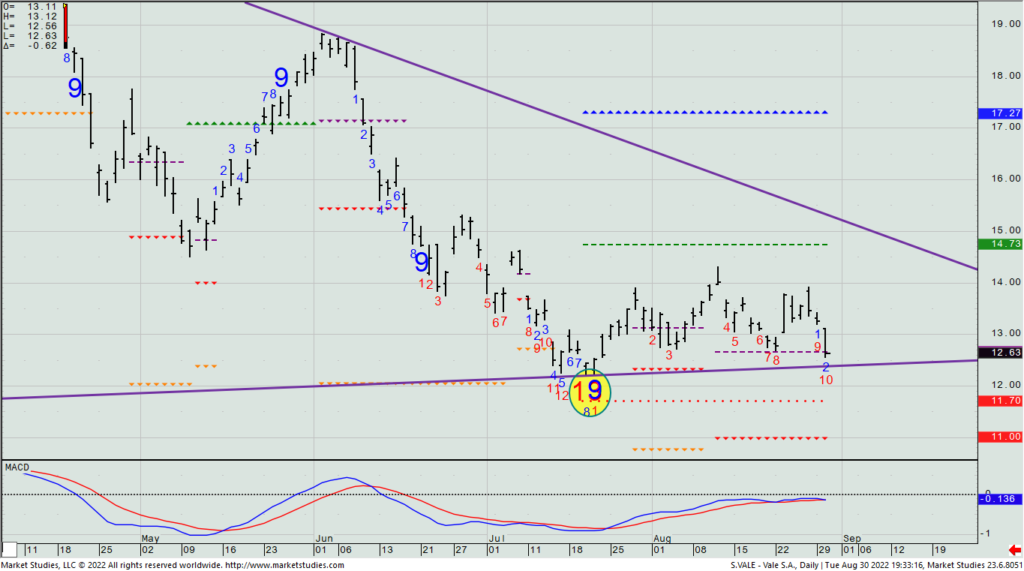
In the meantime, we still have to deal with this Friday’s expiration in our long VALE $13.5/$14.5 call spread. Yesterday, we sold out of 15 of the 45 we still had on, and today we will sell out of the remaining 30. (Until yesterday, price hadn’t materially moved against us, but Tuesday’s 4.7% loss makes it very unlikely for price to get back above $13.50 by Friday’s close. It’s up to you, as always, should you wish to hold off and hope for Friday to get that upmove for you to then exercise the call to buy the stock.)
VALE – Daily
A reminder that we have educational webinars today at 4:15pm ET with Jess, Tony, and me, and then Friday morning a Members Only open Q&A session with me at 8:45am ET.
$T, $VALE, $INTC, $BEAM
DailyPlay – Closing Trade (T) Partial Closing Trades (VALE, INTC, BEAM) – August 30, 2022
Closing Trade
- T -109.68% Loss: Buy to Close 30 Contracts Sept 2, 2022 $18.50/$17.50 Put Verticals @ $0.65 Debit. DailyPlay Portfolio: By Closing all 30 Contracts, we will be paying $1,950.
Partial Closing Trades
- VALE – 48.15% Loss: Sell to Close 15 Contracts Sept 2, 2022 $13.50/$14.50 Call Verticals @ $0.14 Credit. DailyPlay Portfolio: By Closing 15 Contracts, we will be receiving $210. We Partially Closed this trade on August 23 at $0.13 Credit, when we Closed 25 of the 70 Contracts, leaving us with 30 Open Contracts.
- INTC – 34.52% Loss: Sell to Close 1 Contract (Buy Jan 20, 2023 $35) / (Sell Sept 9, 2022 $38) Call Diagonals @ $2.03 Credit. DailyPlay Portfolio: By Closing 1 of the 3 Contracts, we will be receiving $203.
- BEAM – 113.06% Gain: Sell to Close 2 Contracts Sept 16, 2022 $60/$50 Put Verticals @ $5.22 Credit. DailyPlay Portfolio: By Closing the remaining 2 Contracts, we will be receiving $1,044. We took Partial Profit on this trade on August 18 at $4.30 Credit, when we Closed 4 of the 8 Contracts, and then again, on August 23 at $6.47 Credit, when we closed 2 of the remaining 4 Contracts. Therefore, the average gain on this trade is 107.04% and the average cost basis to exit this trade is $5.07 Credit.
Investment Rationale
The SPX reached my near-term tactical support zone (4032/4023, where three unrelated technical indicators came together) and was the projected initial down move target from when I turned bearish north of 4270. I can’t make much out of yesterday’s action other than there was clearly some buying in there to offset selling from those stuck long from higher levels. Yesterday I bought some S&P futures in the fund I trade for at 4024. I’m gonna keep a tight sell stop on them but still think we could see a trading bounce this week from the confluence of three unrelated indicators (all near 4030) I explained in Monday’s OP webinar.
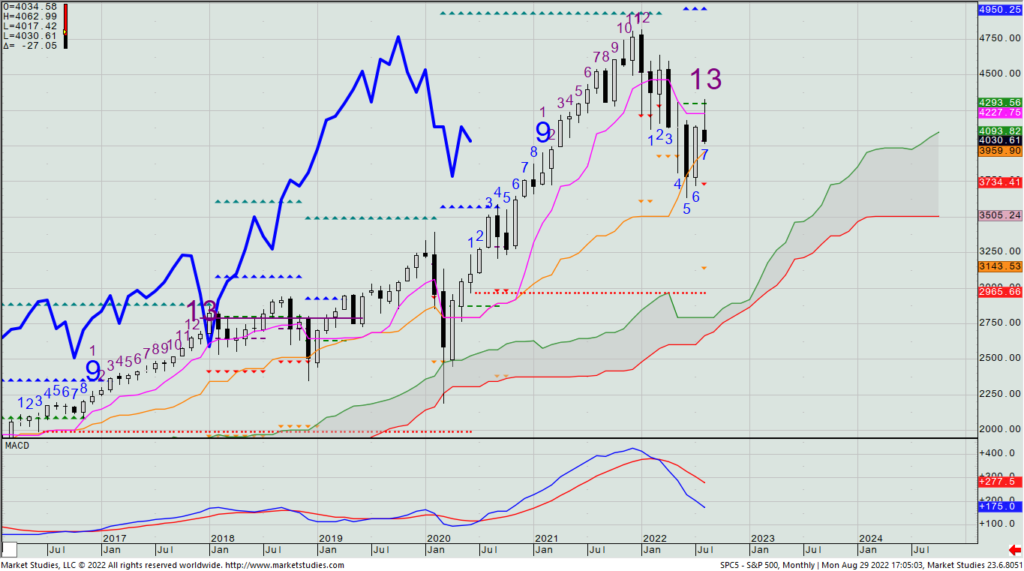
We see the market on a daily Setup -7 count coming into today, so we may very well see a terminal -9 count by Wednesday, but the bigger picture is what really matters. And we may get a better clue into that depending upon where Wednesday closes because the monthly chart (below) has a new look to it with the +13 count that came in because of where the August rally had reached. Closing beneath the Base Line (3960) is potentially another negative, while closing above 4132 would kill the down count and potentially make the picture less negative.
SPX – Monthly
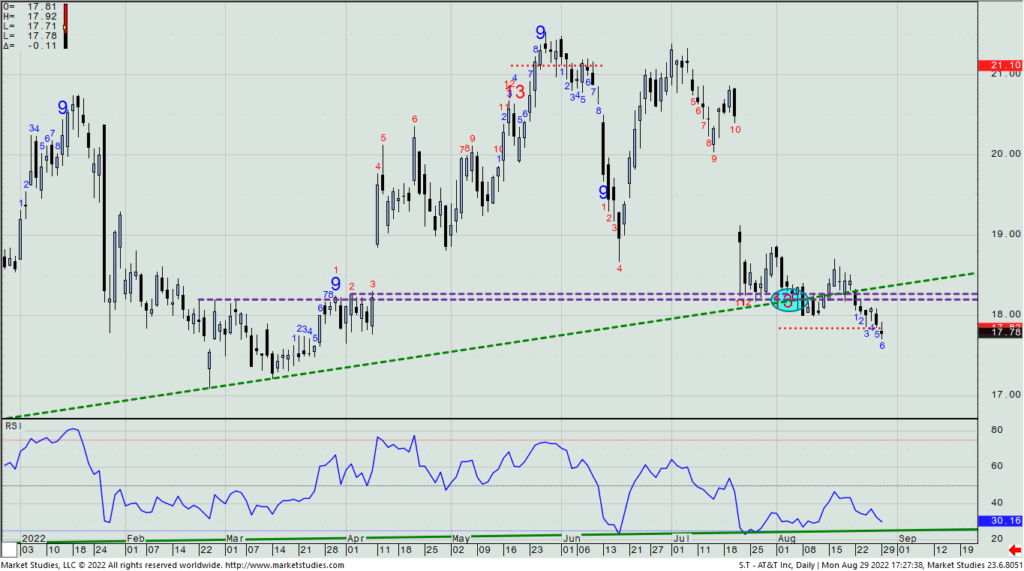
As far as our Daily Play portfolio, let’s look at the short T Sept. 2nd $18.50/$17.50 put spread we have on. We are down 110% of what we collected, and with support having given way the past few days and yesterday also gapping lower and then closing beneath the -13’s Risk Level ($17.83), let’s cover our put spread today – half this morning and half nearing today’s close.
T – Daily
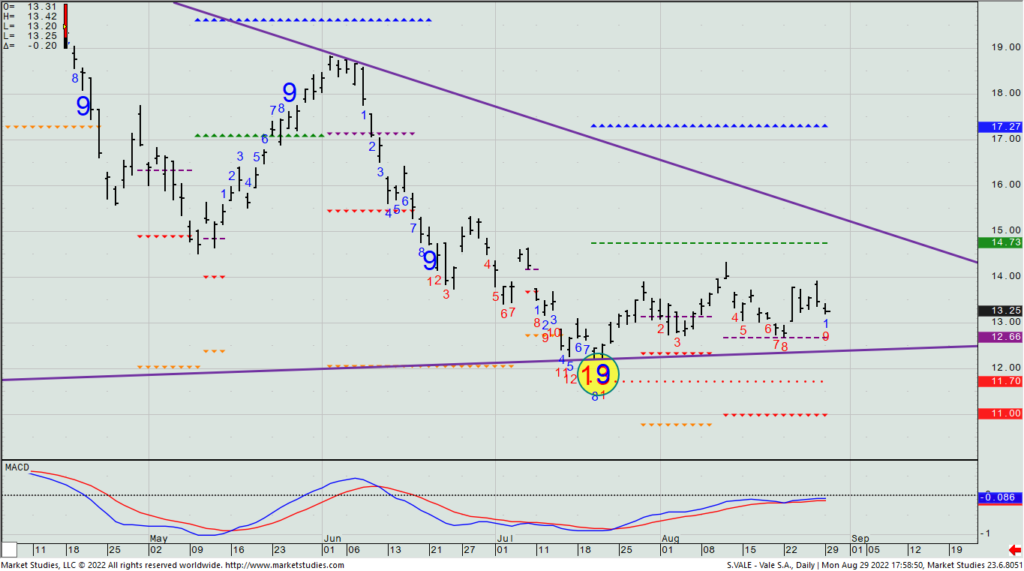
We’re long 45 VALE Sept. 2nd $13.5/$14.5 call spreads. The market hasn’t really gone against us on this one, but time has. We’ve only got four days for this to work. Let’s exit another 15 of the spreads today.
VALE – Daily
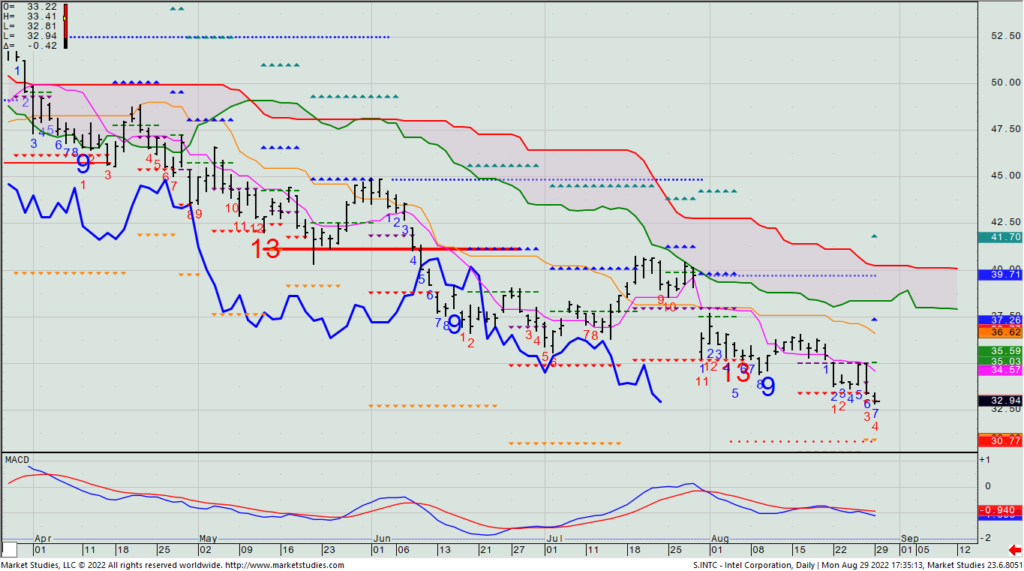
We are also long three INTC Sept. 9th $35 calls vs. short 3 Jan. 20th $38 calls. The Sept. calls expire in 11 days, and we’re down about 35% on the position, so let’s remove 1 of the three spreads we have on now.
INTC – Daily
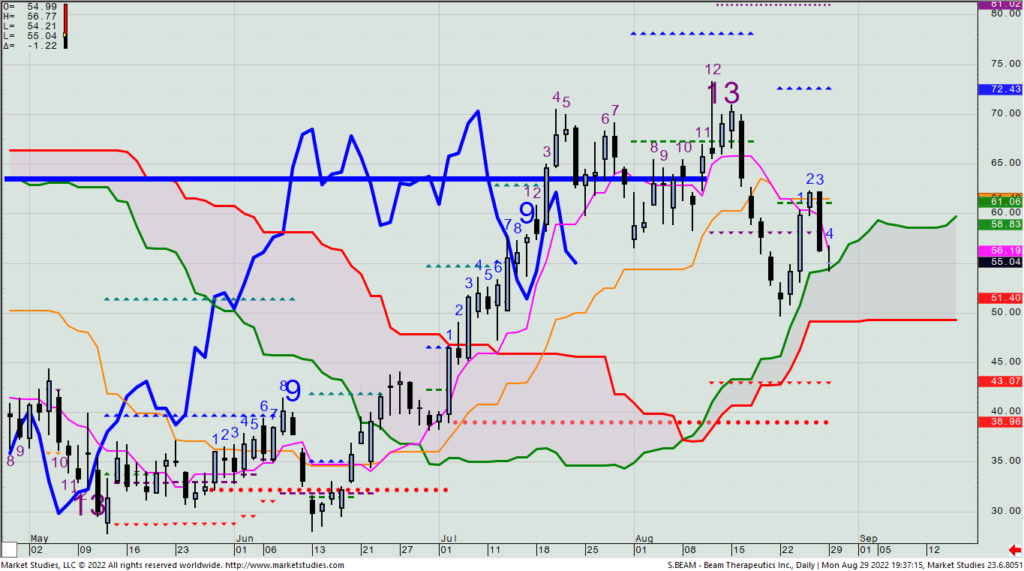
Lastly, we have the remaining two long BEAM $60/$50 put spreads expiring Sept. 16th. This was a recent large winner. With price against the cloud top, and my thoughts that we may still get a general market trading bounce, let’s take off the last two to lock in what was a 113% winner as of yesterday.
BEAM – Daily
$HSY
DailyPlay – Opening Trade (HSY) – August 29, 2022
Bearish Opening Trade Signal
Strategy Details
Strategy: Short Call Vertical Spread
Direction: Bearish
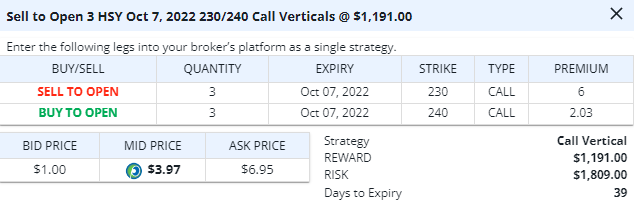
Details: Sell to Open 3 Contracts October 7, 2022 $230/$240 Call Vertical Spreads @ $3.97 Credit.
Total Risk: This trade has a max risk of $1,809 (3 Contracts x $603).
Counter Trend Signal: This is a Bearish trade on a stock that is experiencing a neutral to bullish trend.
1M/6M Trends: Bullish/Bullish
Technical Score: 9/10
OptionsPlay Score: 106
Entering the Trade
Use the following details to enter the trade on your trading platform. Please note that if there is a multi-leg option strategy, it should be entered as a single trade.
Please note these prices are based on the previous day’s closing prices. Should the underlying move significantly during the pre-market hours, we will likely adjust the strikes and prices to reflect a more accurate trade entry. This will be reflected in the Portfolio tab within the OptionsPlay platform.
Investment Rationale
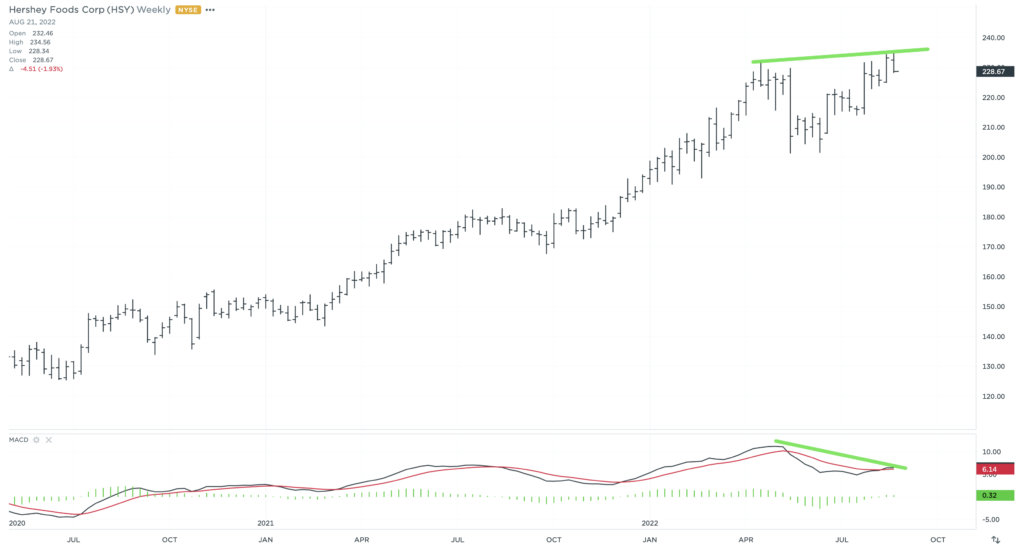
As HSY fails to break higher above its $230 prior all-time highs and starts to show some signs of exhaustion, this warns us of a potential pullback. It is hard to bet against a stock with such strong relative strength and an uncanny ability to navigate the supply chain issues, but it is not immune to a slowdown in consumer spending. Currently trading above 28x next year’s earnings, it is at a substantial premium to its peers despite only expecting 12% EPS growth for next year. I see this valuation at risk of multiple contraction as we’ve seen across the entire market.
HSY – Daily

DailyPlay Updates – August 26, 2022
Today’s the day that investors have been waiting for since, well, the last time Fed Chairman Powell did his press conference in July. That one helped goose the market higher; this one the world awaits his every word (and more so, his tone). Bulls drove stocks higher yesterday, with their belief that he won’t be quite as hawkish as was thought he’d be just 5-10 days ago. Go figure…
Maybe, he says nothing that neither zooms or plunks the market, but says enough not to make either bull or bear particularly happy, suspending us all into stock market purgatory until the September inflation numbers get released in a few weeks. That may be his message, as the bulls and bears have been fighting it out the last few weeks with neither camp feeling quite satisfied right now.
Monday starts the 2nd most vacationed week of the year (only behind Christmas week), so it can bring exaggerated market moves (as far less players are around to provide liquidity). Through Labor Day, take that into consideration as you either play for targets to be met or how you choose your stop-out levels.
I, myself, will finally be taking a long-awaited true vacation with my wife from September 7-18 (meaning I will not be working in any capacity during that time). It will be pure joy for us to tour Florence, Italy and the surrounding Tuscan Valley, and then end our stay by sitting in the sands of the Italian Rivera while sipping Prosecco. During that time you will be very well taken care of by our very own rockstar, CNBC Contributor and OptionsPlay Chief Strategy Officer, Tony Zhang.
Lastly, we had a great trade on in having previously bought a BEAM Sept. 16 $60/$50 put which we have scaled out of almost the entire position with substantial gains. We have two contracts left, and with the large gain the stock put in this week, we will exit the remaining two contracts today should the stock be positive on the day going into today’s close.
As a reminder, make sure you have closed out of the TLT long put trade that expires today.
Enjoy the last August weekend of the summer.
Rick Bensignor
Chief Strategist
$TLT
DailyPlay – Closing Trade (TLT) – August 25, 2022
Closing Trade
- TLT – 210.61% Gain: Sell to Close 3 Contracts Aug 26, 2022 $118.50/$114.50 Put Verticals @ $4.10 Credit. DailyPlay Portfolio: By Closing the remaining 3 Contracts, we will be receiving $1,230. We took Partial Profit on this trade on August 12 at $2.77 Credit, when we Closed 6 of the 12 Contracts, and then again, on August 19 at $2.74 Credit, when we closed 3 of the remaining 6 Contracts. Therefore, the average gain on this trade is 134.47% and the average cost basis to exit this trade is $3.10 Credit.
Investment Rationale
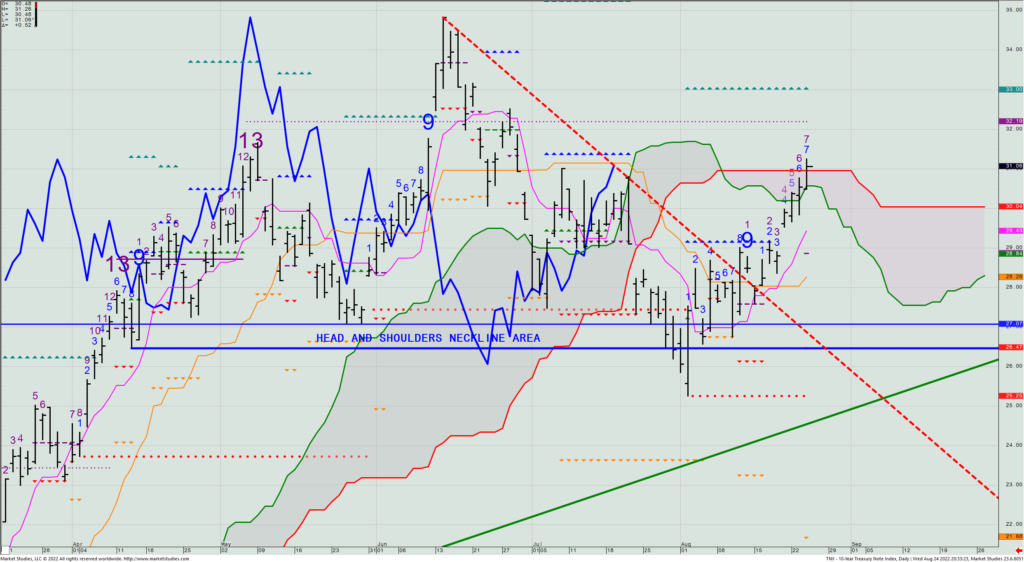
The SPX ended a 3-day slide yesterday with a gain of about 30 bps. as traders are starting to square some books before Fed Chair Powell’s statement on Friday from the Jackson Hole symposium. Bond yields pushed up to 3.11% (testing resistance from here to 3.14%), and then potentially as high as 3.30% if Powell’s words are taken even more hawkishly (this is not an official English word, but I’m fine using it) than expected.
TNX – Daily
We have one option spread that expires on Friday, so make sure you are out of them before then. This is the last 3 TLT long Aug. 26th $118.5/$114.5 put spreads that we are up 211% on.)
Yesterday, I recommended a conditional long USO Sept. 16th $75/$81 call spread ONLY if the USO trades down to $75 or lower. I will extend that idea through Friday’s close, most especially with oil having traded to over $95 on Wednesday. (I want to buy it into the unfilled gap made this week if it gets a spike move down.)
$USO

DailyPlay – Opening Trade (USO) – August 24, 2022
USO Bullish Conditional Trade Signal
Strategy Details
Strategy: Long Call Vertical Spread
Direction: Bullish
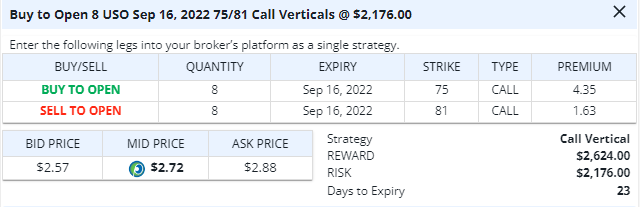
Details: Buy to Open 8 Contracts Sept 16, 2022 $75/$81 Call Verticals @ $2.72 Debit.
Total Risk: This trade has a max risk of $2,176 (8 Contracts x $272 per contract).
Trend Continuation Signal: This is a Bullish trade on a stock that is experiencing a bullish trend.
1M/6M Trends: Mildly Bullish/Neutral
Technical Score: 9/10
OptionsPlay Score: 95
Entering the Trade
Use the following details to enter the trade on your trading platform. Please note that if there is a multi-leg option strategy, it should be entered as a single trade.
Please Note that this is a CONDITIONAL TRADE. See the Condition below. The strike prices, premiums, and OptionsPlay Score will therefore be slightly different when the condition is met, and we enter this trade.
Investment Rationale
Not much of a day for the equity market yesterday, though the thrust in energy-related names continued as oil surged another few dollars after Monday’s headlines that OPEC may reduce output in coming months. The dollar also fell, giving metals a decent lift, while natgas got hit for 5% after posting a daily Sequential +13 on Monday.
As we get closer to this Friday’s Fed statement from Jackson Hole, you’re going to want to make any portfolio changes you deem necessary before that 10am ET announcement, for it can surely send the market sharply-lower or higher, depending upon how hawkish – or not – Chair Powell comes across on his inflation-fighting agenda. (If for some reason between now and then the SPX finds itself nearing 4050, I’d be more apt to be a buyer there, as the reward to risk ratio is preferable (i.e., I could risk, say 50-75 SPX points vs. possibly making 200 quickly).
For today’s Daily Play, I want to stay away from a “pure stock”- type idea, because none of us has any clue as to what/how Powell is going to say on Friday. So, rather than putting on something that has a 50/50 chance of still being right after he speaks then, let’s at least go into the commodity world, as the price of oil should not be as much affected by what he says, than, let’s say, MSFT or JPM might be.
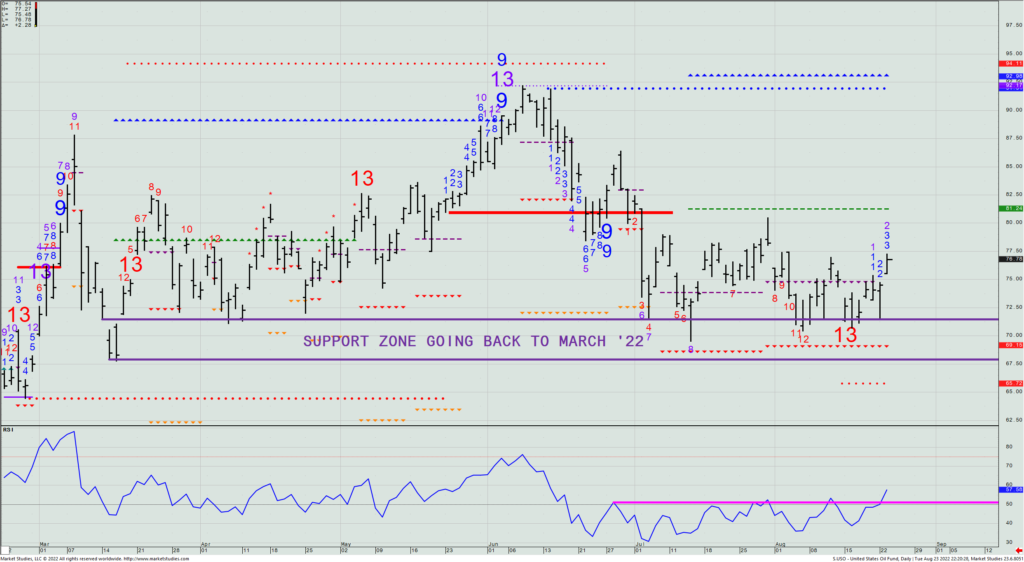
With oil having rallied sharply the last two days – and the weekly oil inventory report coming out today at 10:30am ET – let’s look to buy a pullback in the US Oil Fund ETF (USO), as the daily chart posted a recent Sequential -13 “downside exhaustion” signal, and price appears to be headed higher. So, should we see the USO trade down to $75 or lower, then let’s look to buy a September 16th $75/$81 call spread at the then mid-price level. THIS IS A CONDITIONAL TRADE. If it doesn’t get down to $75 or lower today or tomorrow, we’re not putting the trade on.
USO – Daily