
$RSP

DailyPay – Opening Trade (RSP) – May 30, 2023
RSP Bullish Opening Trade Signal
View RSP Trade
Strategy Details
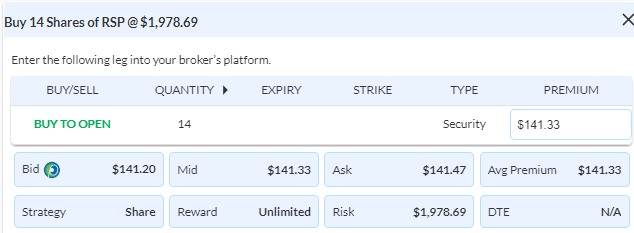
Strategy: Long Stock
Direction: Bearish
Details: Buy 14 RSP @ $141.33 Debit per Share.
Total Risk: This trade has a max risk of $1,978.62 (14 Shares x $141.33) based on a hypothetical $100,000 portfolio risking 2%. We suggest using 2% of your portfolio value and divide it by $141.33 to select the # shares for your portfolio.
Counter Trend Signal: This stock has respected support and is expected to continue higher.
1M/6M Trends: Bearish/Bearish
Technical Score: 4/10
OptionsPlay Score: 109
Entering the Trade
Use the following details to enter the trade on your trading platform. Please note that whenever there is a multi-leg option strategy, it should be entered as a single trade.
Please note that these prices are based on Friday’s closing prices. Should the underlying move significantly during the pre-market hours, we will likely adjust the strikes and prices to reflect a more accurate trade entry.
Investment Rationale
The major stock indexes moved higher again on Friday, though don’t be fooled by those headlines: The equal-weighted SPX (RSP) closed on its third lowest Friday close of the year. There is no particular “market” this year, but several different ones.
RSP – Weekly
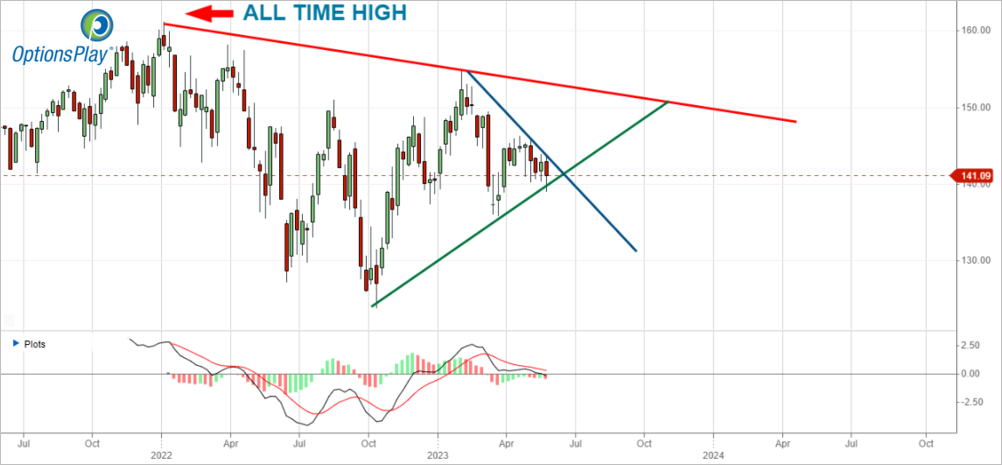
Frankly, when I look at the above chart, my eyes see a new small risk long play with a far greater potential upside to reach the downtrend line then I need to risk to a new 2023 Friday closing low (beneath $138.03 from mid-March).
However, selling a $141/$138 put spread yields just 30% of the strike differential – a definite “no go” in my book. A July 21st $141/$151 call spread costs 43% of the strike differential – also a “not a chance I’m going to lay that out”. So once again, the obvious bullish option trades make no sense to put on. So, my suggestion: simply buy the ETF shares in an appropriate dollar amount you are willing to risk for a share-holding position. On a theoretical $100K account, I’d risk no more than 3-5% on an un-leveraged idea like this, but stick with what you are comfortable with. Your sell-stop is that aforementioned Friday close beneath $138.03.
$CAH

DailyPlay – Opening Trade (CAH) – May 26, 2023
CAH Bearish Opening Trade Signal
View CAH Trade
Strategy Details
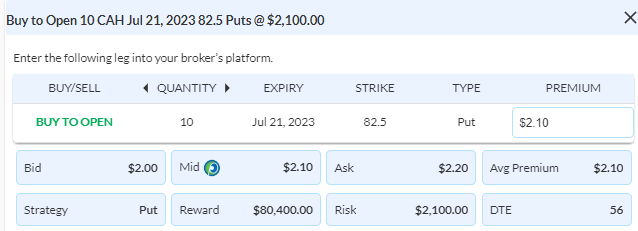
Strategy: Long Put
Direction: Bearish
Details: Buy to Open 10 Contracts July 21st $82.50 Puts @ $2.10 Debit per contract.
Total Risk: This trade has a max risk of $2,100 (10 Contracts x $210) based on a hypothetical $100,000 portfolio risking 2%. We suggest using 2% of your portfolio value and divide it by $210 to select the # contracts for your portfolio.
Counter Trend Signal: This stock is in a bullish trend, but expected to trade lower over the duration of this trade, as it has reached a point of exhaustion.
1M/6M Trends: Bullish/Bullish
Technical Score: 9/10
OptionsPlay Score: 65
Entering the Trade
Use the following details to enter the trade on your trading platform. Please note that whenever there is a multi-leg option strategy, it should be entered as a single trade.
Please note that these prices are based on Thursday’s closing prices. Should the underlying move significantly during the pre-market hours, we will likely adjust the strikes and prices to reflect a more accurate trade entry.
Investment Rationale
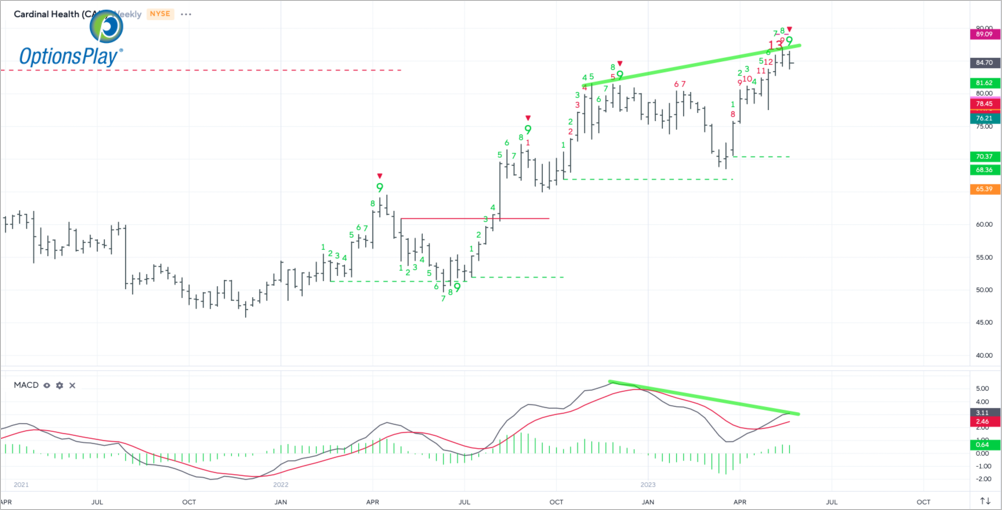
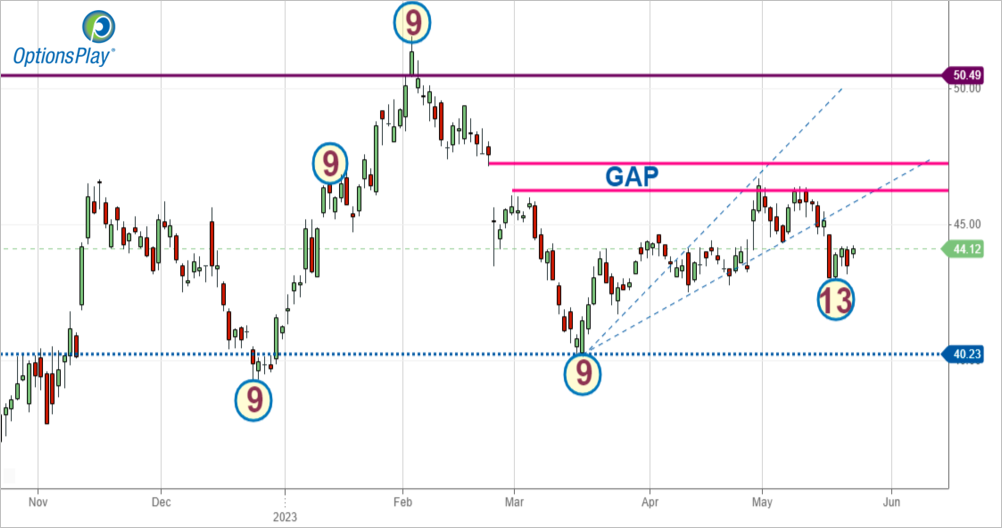
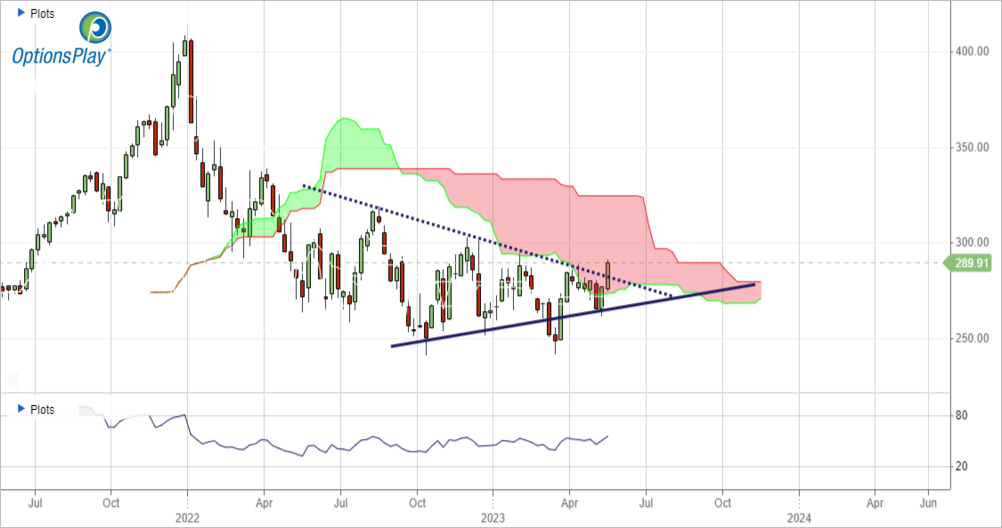
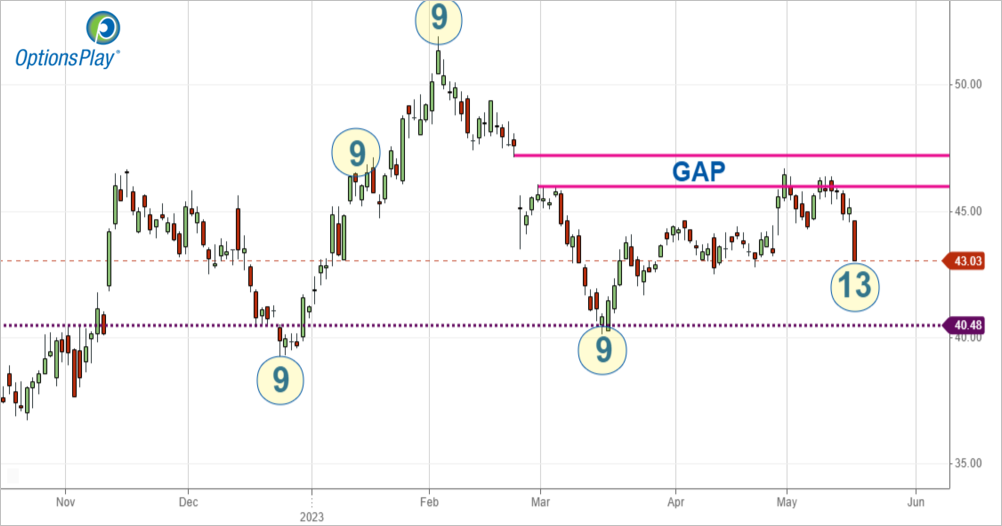
Market breadth has been poor with tech dragging the market cap-weighted indices higher in an “AI lead” rally. One sector that has lagged is healthcare and continues to underperform the market. Cardinal Health (CAH) on paper looks like a strong out-performer in the healthcare space, printing a new 52-week high last week. However on closer inspection as it broke out above its $80 resistance level to 2016 highs, it saw negative divergence with a +9 setup on the Weekly Chart. Couple this with a fundamental picture that looks far from attractive; CAH has seen no EPS growth since 2016 despite growing revenues from $130b to $180b last FY. What I see is a company that has rallied to a prior high from 2016 that has underperformed relative to its sector by 50% since 2016 with classic signs of exhaustion. My hunch is that this breakout and rally will fade and reverse lower. With very low implied volatilities in CAH options, I think its worth considering bearish exposure with a simple outright put option. I’m looking at the July $82.5 Puts @ $2.10 Debit, risking only 2.5% of the stock’s value to gain unlimited downside exposure if CAH were to reverse lower.
CAH – Daily
$UNG
DailyPlay – Opening Trade (UNG) Partial Closing Trade (GOOGL) – May 25, 2023
Partial Closing Trade
- GOOGL – 42.54% Gain: Sell to Close 1 Contract (or 50% of your remaining Contracts) June 16th $112/$122.50 Call Vertical Spreads @ $5.83 Credit. DailyPlay Portfolio: By Closing 1 of the remaining 2 Contracts, we will receive $583.
UNG Bullish Opening Trade Signal
View UNG Trade
Strategy Details
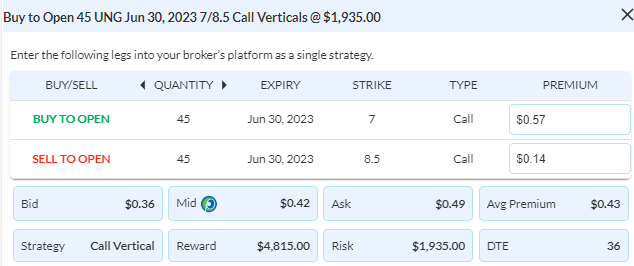
Strategy: Long Call Vertical Spread
Direction: Bullish
Details: Buy to Open 45 Contracts June 30th $7/$8.50 Call Vertical Spreads @ $0.43 Debit per contract.
Total Risk: This trade has a max risk of $1,935 (45 Contracts x $43) based on a hypothetical $100,000 portfolio risking 2%. We suggest using 2% of your portfolio value and divide it by $43 to select the # contracts for your portfolio.
Trend Continuation Signal: This stock has recently turned bullish and is expected to continue higher.
1M/6M Trends: Bullish/Neutral
Technical Score: 1/10
OptionsPlay Score: 112
Entering the Trade
Use the following details to enter the trade on your trading platform. Please note that whenever there is a multi-leg option strategy, it should be entered as a single trade.
Please note that these prices are based on Wednesday’s closing prices. Should the underlying move significantly during the pre-market hours, we will likely adjust the strikes and prices to reflect a more accurate trade entry.
Investment Rationale
The disparate thoughts of the Democrats and Republicans to resolve the debt-ceiling issue continues to be front and center for investors, as stocks again fell as the clock continues ticking down to the June 1 deadline that Treasury Secretary Yellen believes will be the day that the US government runs out of money to pay its debts. All three major stock indexes were well lower on the session, and the SPX has already given back some 100 points from the May high from just days ago. (You can thank your politicians on both sides of the aisle for that.) Given my writing this Wednesday evening, NVDA’s surge after reporting earnings after yesterday’s bell, I’d venture a decent guess that stocks open higher today – especially in tech, which has been killing it recently on the demand for AI-related names.
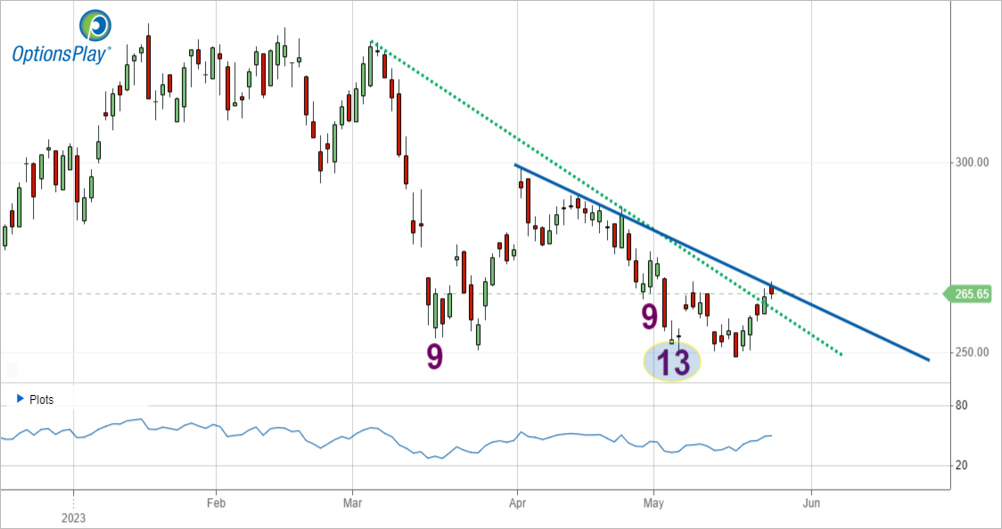
As a reminder, yesterday’s OIH close was above the downtrend line level I had given to you on Tuesday as a conditional trade to get into on either Tuesday or Wednesday if above the respective breakout price. Late yesterday the requirement was met, so on the close we got into our short June 16th $265/$255 put spread recommendation at ~$3.40 – the closing bid/offer mid-price.
OIH – Daily
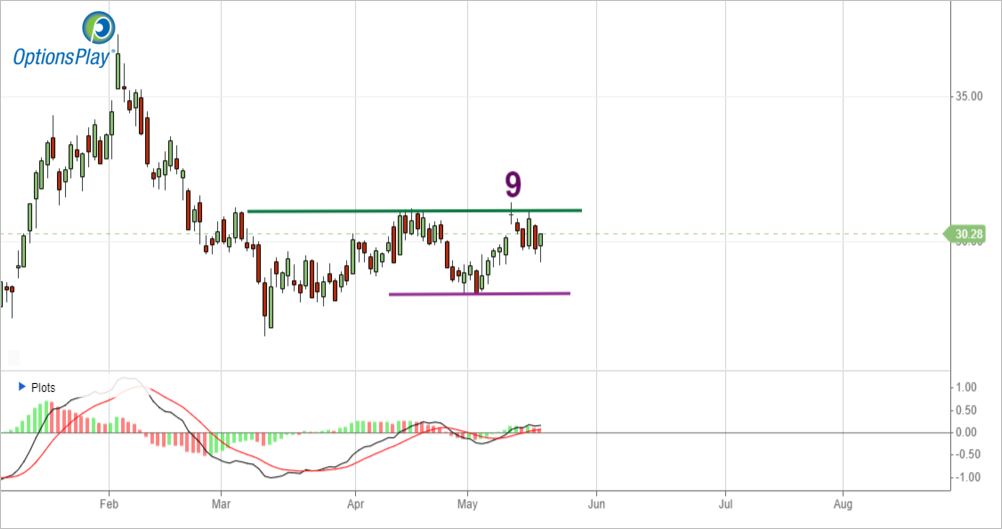
For a new idea, I’m going to stay in the energy space, and look to play for an impending short squeeze higher in natural gas. We’ll use the UNG ETF as our proxy. Note that after the daily -13 low, we saw a counter move higher that topped on a Setup +9 count a week ago. The pullback has pulled back but held above the bearish Propulsion Momentum level at $6.74, while it also broke out above the downtrend line. s such, look to buy a UNG June 30th $7/$8.5 call spread (it closed yesterday at $0.425, or 28% of the strike differential).
UNG – Daily
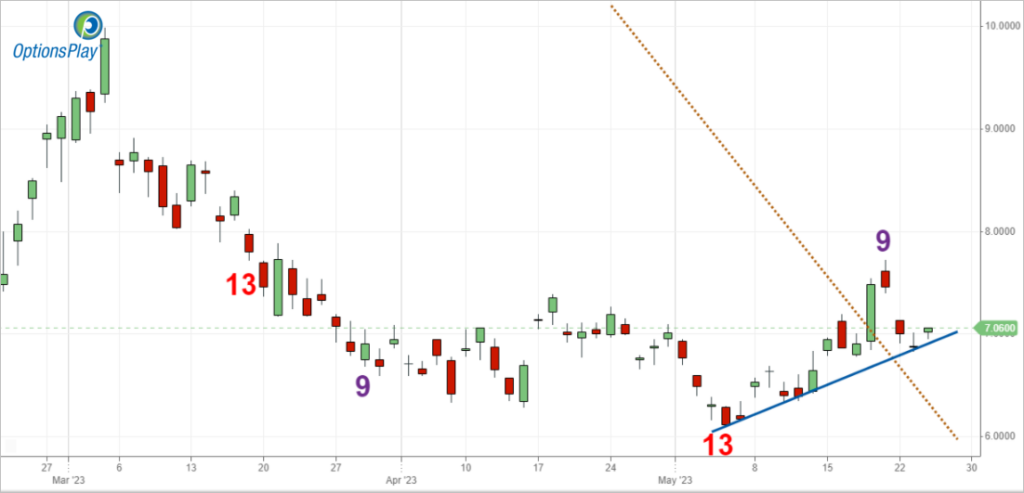
Do note that today at 10:30am ET is the weekly natural gas inventory report – a number that can easily move natgas in either direction based upon where it comes in vs. expectation. Depending upon how you like to manage risk, you could put the whole trade on before the number; some before and some after; or completely wait for the number to come out to make sure it’s not a bearish one. The latter may be the safest way, to play but a bullish number is going to move natgas up quickly and then the call spread will cost far more. (Only you can decide which is the best choice for you.)
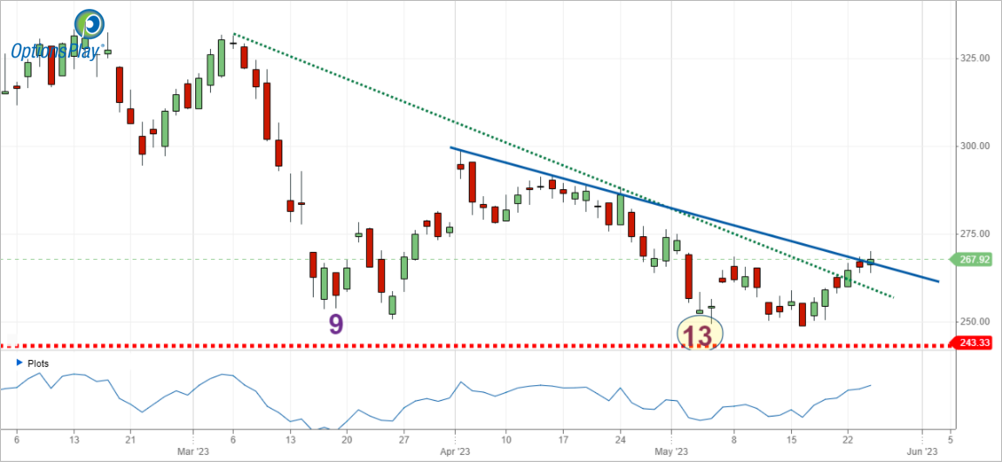
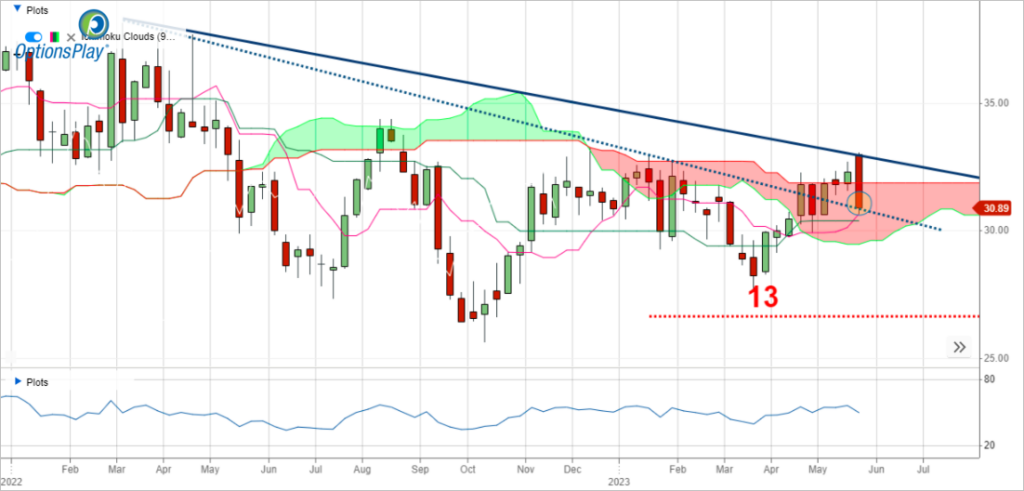
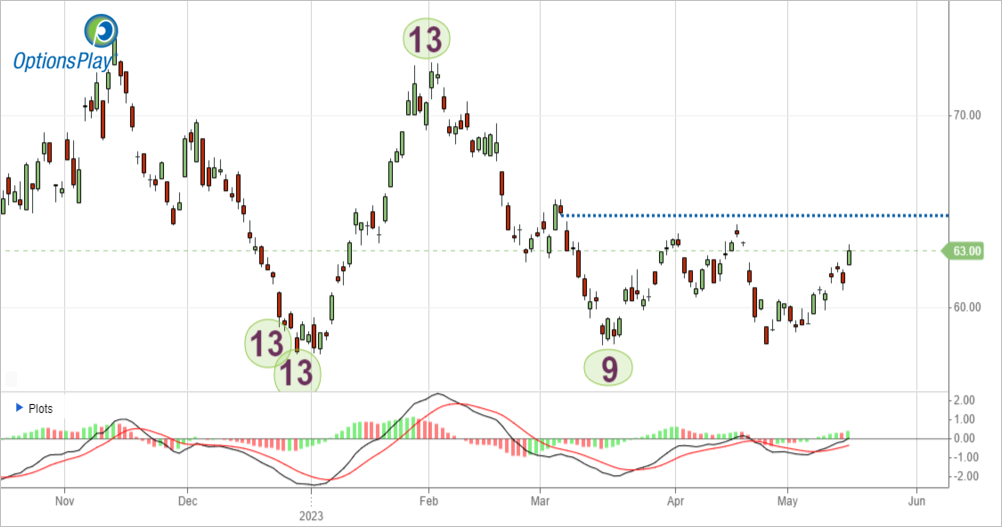
We are long 17 CSX $31/$29 put spreads that expire tomorrow, and yesterday saw the stock close at $30.89. With time virtually gone and the stock having sold down to a prior downtrend line it broke out from, let’s take 9 of those off today and then the final 8 tomorrow.
CSX – Weekly
Lastly, we are still long 2 GOOGL call spreads, having sold the third one out a few days ago right by the high of the move. Let’s use today’s strength in tech stocks to take one more off (and preferably when the stock is in the $122.50 to $123.50 area).
GOOGL – Weekly

DailyPlay Update – May 24, 2023
Investment Rationale
Stocks took it on the chin on Tuesday, as concerns grew that the debt-ceiling limit is closing in and there’s still no resolution. The clock is ticking and investors are running out of patience – let alone respect – for our elected officials who continually politicize every issue they’re asked to vote on. It’s very disheartening.
I’ve said it before and I’ll say it again: committing substantial new capital to the markets now – ahead of the debt-ceiling deadline and upcoming early-June FOMC rate announcement – all while rates are moving higher – is, frankly, an exercise in futility. Day-to-day headlines will sway traders in either direction, and they will come fast and furiously till the June 1 deadline and then again from the Fed on June 3rd.
No new trades today as we get FOMC minutes at 2pm ET. And as a note, yesterday we saw the OIH close at $265.65 – about a half dollar under where it would break out above the downtrend line and get us into a bullish trade. Thus, we did not enter selling the DP put spread on Tuesday, but could today IF we see a close above $265.20 that is also preferably, an up close (the more above, the cleaner the potential breakout).
OIH – Daily
$OIH
DailyPlay – Conditional Opening Trade (OIH) – May 23, 2023
OIH Conditional Bullish Opening Trade Signal
View OIH Trade
Strategy Details
Strategy: Short Put Vertical Spread
Direction: Bullish
Details: Sell to Open 3 Contracts June 16th $265/$255 Put Vertical Spreads @ a current cost basis of $3.80 Credit per contract.
Total Risk: Based on the current cost basis this trade has a max risk of $1,860 (3 Contracts x $620) based on a hypothetical $100,000 portfolio risking 2%. We suggest using 2% of your portfolio value and divide it by $620 to select the # contracts for your portfolio.
Counter Trend Signal: This stock is neutral to bearish and expected to break out above resistance levels.
1M/6M Trends: Neutral/Bearish
Technical Score: 3/10
OptionsPlay Score: 87
Condition: Open this trade when OIH closes above $267.07 today or above $266.14 tomorrow.
Investment Rationale
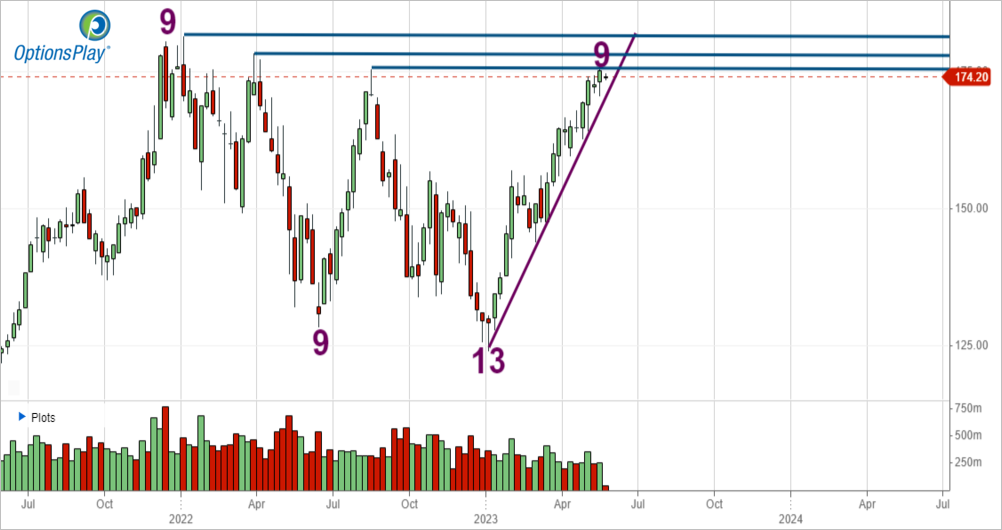
A pretty quiet day in the market on Monday saw the Dow fall 42 bps., but rallies in the SPX and NDX. Apple caught a downgrade from Loop Capital, and the biggest of all US companies by market cap fell 55 bps. after last week marking the highest high since April ’22. It’s not the craziest place for a downgrade, based upon its historical chart (below), as the analyst there is looking for AAPL to miss their next earnings estimate.
AAPL – Weekly
Investors await the FOMC meeting minutes on Wednesday afternoon, and of course, more news on the debt-ceiling negotiations. (Listen to my thoughts on them in the replay video of Monday’s weekly market outlook webinar.)
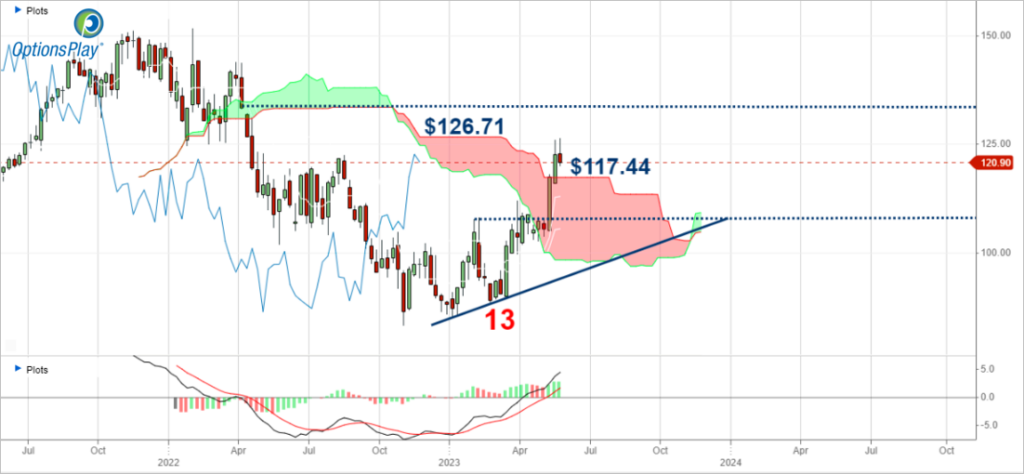
I have dramatically trimmed down our portfolio holdings, with the recent gains forcing us out of prior bearish bets. One good play we do have on is in GOOGL. With price getting very close to where the weekly cloud’s Lagging Line would hit resistance against the top of its respective cloud (at $126.71), let’s trim 1 of 3 remaining call spreads today, up 83% on it.
GOOGL – Weekly
Our EBAY short $44/$41 put spread trade may just work out after all. Our play expires a week from this Friday, and here’s what the current chart looks like:
EBAY – Daily
For a new trading idea, let’s look at the Oil Services Index ETF (OIH). It has already broken above one downtrend line, and is on the cusp of breaking out above the higher of the two ones on a close today above $267.07 or above $266.14 tomorrow. If either of those happen, let’s sell the June 16th $265/$255 put spread at then bid/offer mid-price. As of last night, that closed at $3.80, or 38% of the strike differential. (By the way, to show you just how overpriced calls are, the same dated $265/$285 call spread costs the identical 38% as the $10-wide put spread we will potentially enter today for a 38% credit. This is another example of calls costing just too much these days.)
$AAPL

DailyPlay – Partial Closing Trade (AAPL) – May 22, 2023
Partial Closing Trade
- AAPL – 82.53% Loss: Sell to Close 2 Contracts (or 50% of your Contracts) June 16th $165 Puts @ $0.94 Credit. DailyPlay Portfolio: By Closing 2 of the 4 Contracts, we will receive $188.
Investment Rationale
Stocks rallied on Friday to their best levels of the year, as mega cap tech names continued their large outperformance. (On the week, the XLK was up 4.19% vs. the SPX being up 1.65% (and the latter figure includes tech’s performance within it.) The sentiment figure on the NDX is at 74% bulls, while it’s only 46% bullish for the SPX. With the QQQ on a weekly Setup +9 count and the SPX only on a Setup +1 count, one could say that the tech move could easily peter out in relative terms.
Last week’s rally pushed the SPX definitively above the 4155 weekly cloud top, neutralizing the negative bias that’s been in place since last May. In order of bullish cloud structure, the four major US stock indexes are ranked as: 1) Dow Industrials; 2) SPX; 3) NDX; and 4) Russell 2000 (despite 2023’s returns showing an order of NDX, SPX, Dow, and R2K).
Position-wise, based on what I wrote last week, you should now be out of the long SPY put spreads, and let’s also take down the long AAPL puts from 4 to 2 contracts.
Let’s look at a good example of what option traders are facing these days. After looking through a bunch of potential breakout candidates, I see that Accenture (ACN) is a good candidate to buy based upon its chart showing a trend line breakout, and a move up into the weekly cloud after 5 weeks in a row that the weekly high was at/near its cloud bottom. To me, this is a stock that looks headed higher, and very possibly to test the $312 level (where we see the bullish Propulsion Momentum level.) So, bingo, I think to myself that I have today’s Daily Play idea.
ACN – Weekly
But, buying a June 16th $290/$310 call spread costs $6.48 – some 32% of the strike differential. That’s more than we like to spend, as we try to be in the 25% to max 30% range if we can be.
So, what if we were to sell the $290/$275 put spread? Well, that collects $4.10, only 27% of the strike differential, and well beneath the 40% we look to collect on a credit spread.
That means that despite my bullish outlook on the stock, there’s no way to capture that potential upmove at a fair price in the options market.
This is the same thing I have seen for the past two months or so: the options market is no longer priced such that you can take on a new bullish position at a fair price. You essentially need to “overpay” to get the bull exposure you want, which means that the upmove needs to come virtually immediately to be able to offset the upped price you are paying for the right to get long the underlying stock in the future.
There are times in my long career that this has been the situation – that the best way to get long exposure is to actually buy the stock (and not use its options). Surely, you give up the leverage you get with options, and you also have to have the money to buy shares of stock (and in the case of something like ACN, you can only buy a small amount for your 2% of portfolio value). But frankly, the market-makers are basically now saying to you, “Pay our price to get bullish option exposure or go play something else”.

DailyPlay Updates – May 19, 2023
Investment Rationale
The market flew yesterday, marking new a new 2023 high close for the SPX just shy of 4200. The AI-related tech buying of the mega cap names continues, and with renewed thoughts of a debt ceiling agreement likely to be met in time, buyers completely controlled the day. The biggest effect on us is that the rally will now also knock us out of the remaining two SPY $412 and $413 (vs. $385) put spreads we were long. Mr. Market has spoken, and he’s not saying he wants to go down. (The next SPX tactical target is the unfilled gap from 4203 to 4219, which could easily get filled today.)
I have espoused to you that one should do what has worked in the past until it no longer works, and in this case, with the SPX looking like it will breach the 4155 top of weekly cloud resistance (after last week’s down close relative to the week before) – and the move being “qualified” – it sets next week up to confirm the upside breakout to still potentially push the market higher (despite the still unknown debt ceiling result and upcoming early-June FOMC rate announcement). Price action like this does neutralize the 2022 decline to no longer be a structural bearish picture.
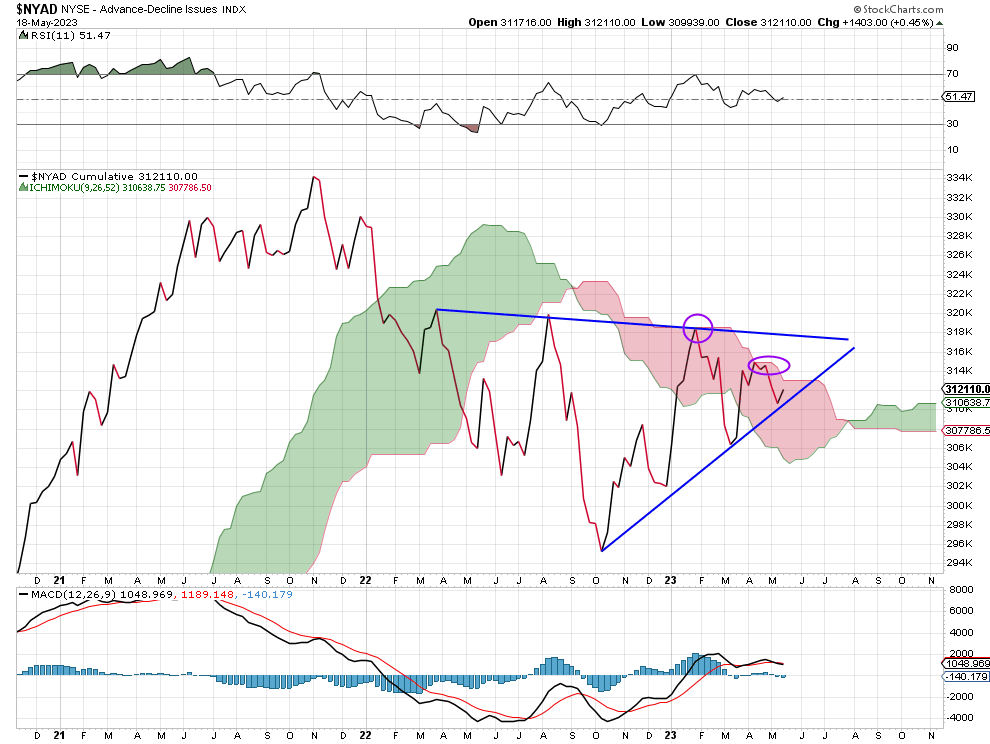
NYSE market breadth is still not bullish, and its chart shows two prior highs right at the top of its weekly cloud. Watch this going forward to see if it can break above its cloud top, to at least then potentially test its major downtrend line.
NYAD – Daily
$SPY
DailyPlay – Closing Trades (SPY) – May 18, 2023
Closing Trades
- SPY – 36.55% Loss: Sell to Close 1 Contract (or 100% of your Contracts) June 16th $410/$385 Put Vertical Spread @ $3.49 Credit. DailyPlay Portfolio: By Closing this 1 Contract, we will receive $349.
- SPY – 32.01% Loss: Sell to Close 1 Contract (or 100% of your Contracts) June 16th $411/$385 Put Vertical Spread @ $3.76 Credit. DailyPlay Portfolio: By Closing this 1 Contract, we will receive $376.
Investment Rationale
Investors came back strongly yesterday, bidding stocks well higher on hopes of a debt ceiling deal coming sooner than later (albeit only 14 days remain till the deadline), but the hope of it happening reversed Tuesday’s seeing bidders disappear – the opposite happened yesterday. The SPX, NDX and Dow all closed up about 1.2%, and again find themselves nearing their best levels of the year.
Rates are also moving higher, with the TNX reaching 3.58% and honing in on last month’s high print of 3.64%. Why stocks are moving higher with rates moving up – the latter indicating that traders are less convinced that the Fed will be done raising rates at their upcoming June meeting – is as silly as it was seeing stocks rally 1.2% yesterday. There is certainly little rhyme and reason in the equity market for what we’re seeing occur, and you can be sure that the computer algos are doing more daily push and pull to stocks than it is big institutional money getting in or out.
Position-wise, we were able to get into selling the ARKG June 15th $30/$31 call spread on yesterday’s rally at about 45 cents. We’ll stop ourselves out of that trade on a close (or two; your choice) above $31.35, and look for the stock to potentially get to the $28 neighborhood.
ARKG – Daily
Given more losses that I like that we’ve recently had, let’s remove the SPY $410/$385 and $411/$385 put spreads we’re long to cut those losses now. A Friday close above 4155 in the SPX will also then take us out of the $412 and $413 spreads, too.
Personally, I have not put on any new trades this week. In fact, I’ve trimmed a bit in one of my large cap tech holdings. Otherwise, I am content on waiting for more clarity to come from both Congress and the Fed, and given the lack of clarity evident in most of the major asset classes’ charts right now, the big money managers are doing the same. And the way I look at things with my 40+ -years of trading experience eyes, if the big boys and girls don’t want to be playing these markets – and they minimally are – why should we?
$ARKG
DailyPlay – Conditional Opening Trade (ARKG) – May 17, 2023
ARKG Conditional Bearish Opening Trade Signal
View ARKG Trade
Strategy Details
Strategy: Short Call Vertical Spread
Direction: Bearish
Details: Sell to Open 36 Contracts June 16th 30/31 Call Vertical Spreads @ a current cost basis of $0.46 Credit per contract.
Total Risk: Based on the current cost basis this trade has a max risk of $1,944 (36 Contracts x $54) based on a hypothetical $100,000 portfolio risking 2%. We suggest using 2% of your portfolio value and divide it by $54 to select the # contracts for your portfolio.
Counter Trend Signal: This stock is bullish and is expected to pull back from this level.
1M/6M Trends: Bullish/Neutral
Technical Score: 3/10
OptionsPlay Score: 111
Condition: Open this trade when ARKG trades between $30 to $30.25 anytime this week.
Investment Rationale
Home Depot’s less than stellar forward guidance pulled stocks lower on Tuesday, as upped fears of a slowing consumer and economy led bidders to shy away, making sellers become more aggressive to get their orders filled – and netting out to a loss of some 26 SPX points for a close at 4110. The clock is also ticking down on the debt ceiling debate, with just 15 days to go (including weekends) for Congress to get their act together to stave off a US default on monies they owe to creditors and government employees.
EBAY got hit for a 4.7% loss yesterday, turning what had been a winning trade into a current losing one. It happened to have marked a daily -13 on Tuesday, too, so we’ll see if this gets a bounce from it to look to reduce our position in coming days. I’d take half off on a rally to near $44.
EBAY – Daily
We’ll still look to sell the June 9th SLV $22.50$23.50 call spread if SLV rallies up to $22.35 to $22.50 area anytime this week.
SLV – Daily
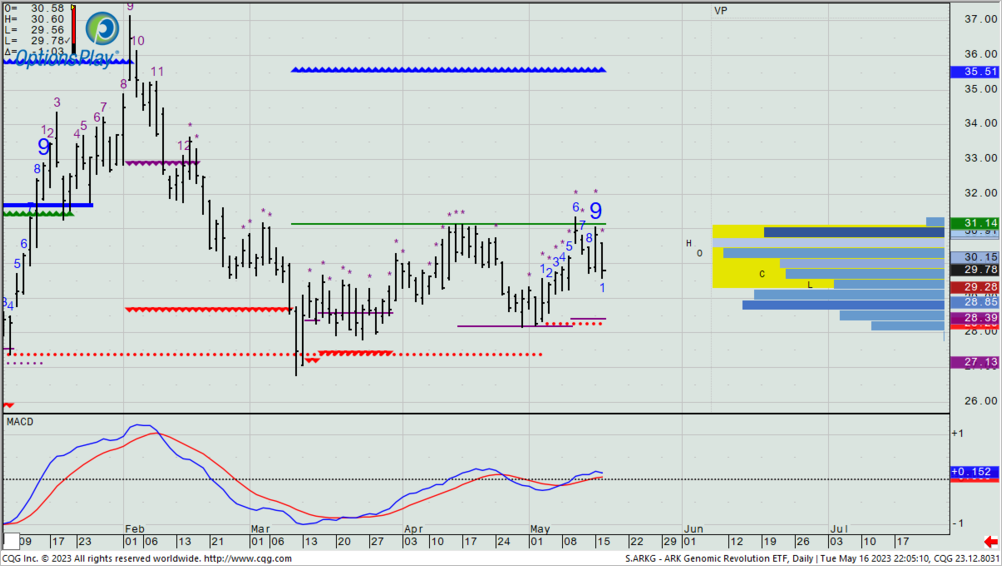
For a new idea, I found a Cathy Wood fund (ARKG) that has continually failed over the past month at its bullish Propulsion Momentum level at $31.14. Yesterday it fell well more than the market was down, so we’ll look to sell June 16th $30/$31 call spread into a minor rally in the stock up $30 to $30.25 any day this week. That should get us near 45% credit of the strike differential. I’ll look for the stock to fall to $28 – the bottom of its recent range. We’ll stop ourselves out on any daily close above $31.35.
ARKG – Daily
$GOOGL
DailyPlay – Partial Closing Trade (GOOGL) – May 16, 2023
Partial Closing Trade
- GOOGL – 4.40% Loss: Sell to Close 3 Contracts (or 50% of your Contracts) June 16th $112/$122.50 Call Vertical Spreads @ $3.91 Credit. DailyPlay Portfolio: By Closing 3 of the 6 Contracts, we will receive $1,173.
Investment Rationale
Stocks edged higher on Monday, with no major catalyst behind the move other than some believing that a debt ceiling deal HAS to get done, and thus, the worries about it not happening become somewhat decreased. It’s as silly a reasoning as it is the press trying to identify the impetus for an up or down move every single day. Moreover, the people they often get their quote from have absolutely no idea themselves, so they just make it up. And the press eats it up because, well, they have to. After all, there has to be some reason why the market moves each day; right? ;))))
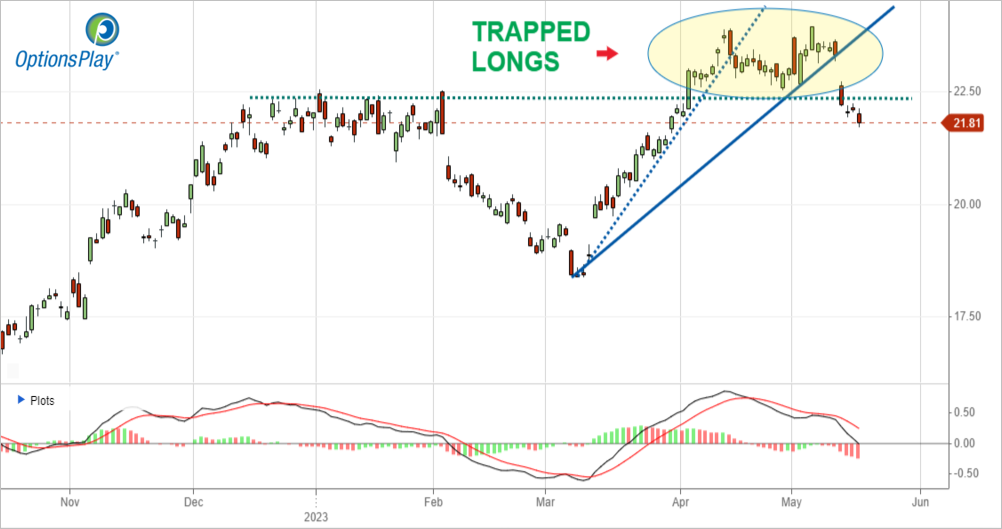
LIT: our position expires on Friday, and the negative news article on the space that came out right after we got into our calls a month ago has cost us all of the theta. It’s a shame, because this may get north of $64 next week.
LIT – Daily
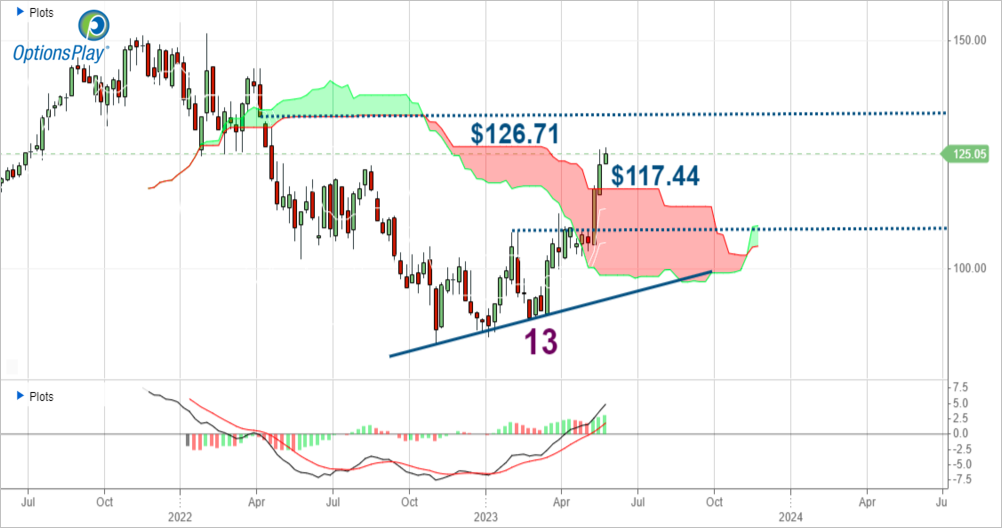
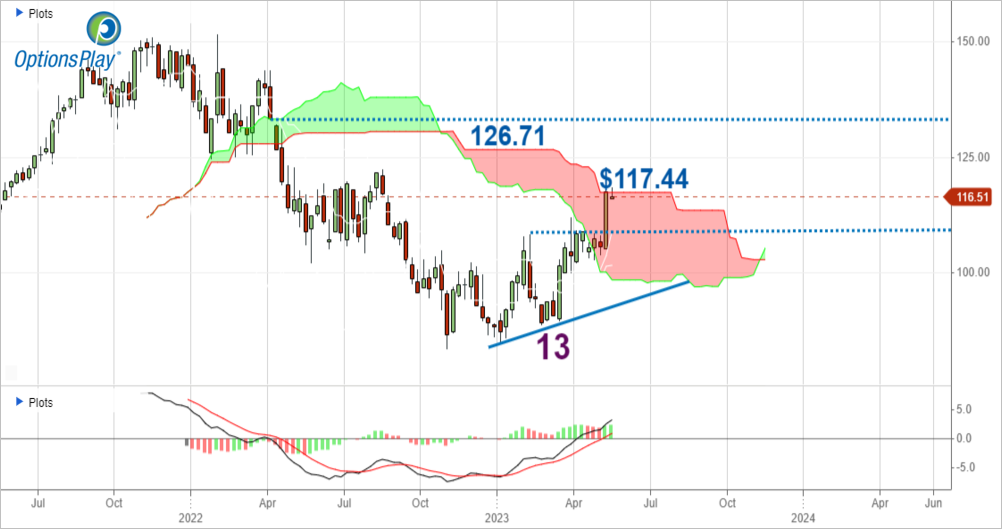
Last week’s bullish GOOGL trade was one of the more interesting ones to learn from, because it gapped up a few dollars the morning we wanted to buy them, and my initial target was reached by 10am that day – the same time of day that we price our portfolio entry price. Frankly, I would not have actually put the trade on myself because of that gap and then the target getting achieved so quickly. Then last Friday some Street firm downgraded the name, so that $117.44 top-of-cloud target has been the right one for starters. I think it makes sense to cut this trade in half, and it’s fairly close to where we put it on, so it should be a minimal loss on this portion.
GOOGL – Weekly
Don’t forget that we’ll still be looking to put on yesterday’s bearish SLV trade if SLV rallies to $22.35/$22.50 on any day this week. (We’d be looking to short the June 9th $22.50/$23.50 call spread at the then current bid/offer spread.)
Lastly, I have found 4 ideas in the past hour while searching to find a new DP I would put on today. But not one of them has a call spread that we can buy for under 40% of the strike differential, or bearish put spread for more than 25% of the strike differential. It tells me that there is now so very little opportunity to put on equity option trades that have fair pricing. And it’s just another reason that given a meandering market that also has some potential big news coming out any day, that it remains wiser to keep your cash ready for more favorable times to trade than it is to spend it on an over- or underpriced option trade that you hope sees the upcoming news go your way.