
NEM

DailyPlay – Opening Trade (NEM) – October 21, 2025
NEM Bullish Opening Trade Signal
Investment Rationale
Investment Thesis
Newmont Corporation (NEM) continues to show strong momentum as gold prices remain elevated and capital rotation favors precious metals over broader equities. With earnings scheduled for Thursday, October 23rd, after the close, the setup presents an appealing pre-earnings opportunity for bullish positioning. The company has exceeded both revenue and EPS expectations in each of the past three quarters, demonstrating consistent operational efficiency and strong cost management amid fluctuating commodity prices. Given this trend of outperformance and a still-attractive valuation discount versus peers, upside continuation toward the $100 range appears likely.
Technical Analysis
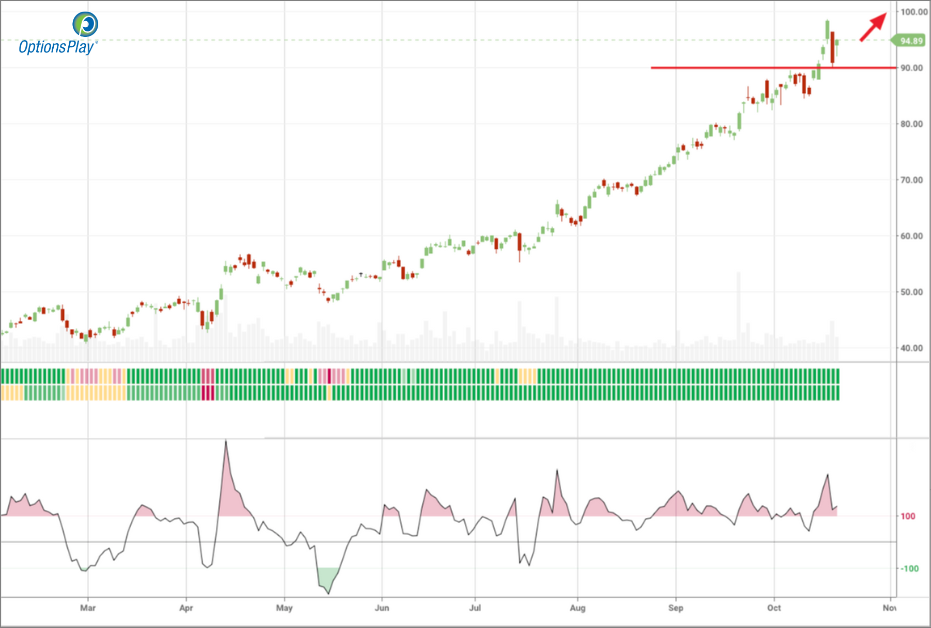
NEM has confirmed a breakout above the critical $90 resistance level, which has now established itself as solid support following a successful retest. The stock is consolidating just below $95, trading comfortably above its 20-day, 50-day, and 200-day moving averages — clear evidence of a well-established uptrend. The RSI near 65 reflects healthy upside momentum without signs of overbought conditions. A push through $95 could ignite the next leg higher toward $100, with the upcoming earnings report potentially serving as the trigger.
Fundamental Analysis
Despite trading at a discount to peers, Newmont’s profitability profile remains among the best in the metals and mining sector, underpinned by disciplined capital allocation and expanding margins. The company’s earnings consistency and moderate growth expectations, combined with its solid dividend yield, provide a defensive yet growth-oriented appeal.
- Forward PE Ratio: 13.79x vs. Industry Median 19.43x
- Expected EPS Growth: 20.96% vs. Industry Median 23.21%
- Expected Revenue Growth: 5.36% vs. Industry Median 6.86%
- Net Margins: 30.50% vs. Industry Median 23.60%
Options Trade
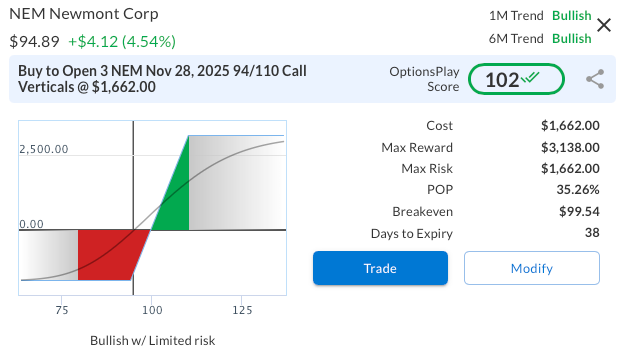
The proposed trade is a NEM Nov 28, 2025 $94/$110 Call Vertical for a debit of $5.54 ($554 total risk). This position defines risk while targeting a potential $1,046 max reward, offering an attractive risk/reward ratio of roughly 1:1.9. The $94 long strike aligns with current support, while the $110 short strike targets the upper end of the next major resistance zone. This structure captures bullish upside through earnings and into the following month, balancing directional exposure with controlled risk in case of post-earnings volatility.
NEM – Daily
Trade Details
Strategy Details
Strategy: Long Call Vertical Spread
Direction: Bullish Debit Spread
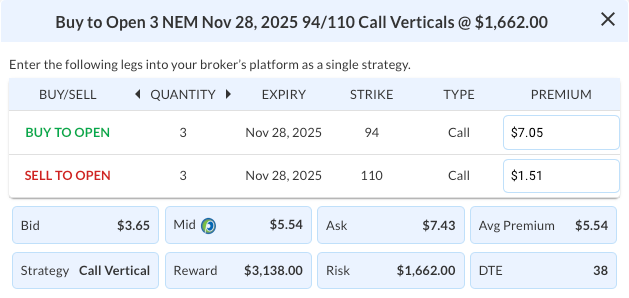
Details: Buy to Open 3 NEM Nov 28 $94/$110 Call Vertical Spreads @ $5.54 Debit per Contract.
Total Risk: This trade has a max risk of $1,662 (3 Contracts x $554) based on a hypothetical $100k portfolio risking 2%. We suggest risking only 2% of the value of your portfolio and divide it by $554 to select the # contracts for your portfolio.
Trend Continuation Signal: This is a bullish trade on a stock that is expected to continue higher over the duration of this trade.
1M/6M Trends: Bullish/Bullish
Relative Strength: 10/10
OptionsPlay Score: 102
Stop Loss: @ $2.77 (50% loss of premium)
View NEM Trade
Entering the Trade
Use the following details to enter the trade on your trading platform. Please note that whenever there is a multi-leg option strategy, it should be entered as a single trade.
PLEASE NOTE that these prices are based on Monday’s closing prices. Should the underlying move significantly during the pre-market hours, we will likely adjust the strikes and prices to reflect a more accurate trade entry.
View NEM Trade

DailyPlay – Portfolio Review – October 20, 2025
DailyPlay Portfolio Review
Our Trades
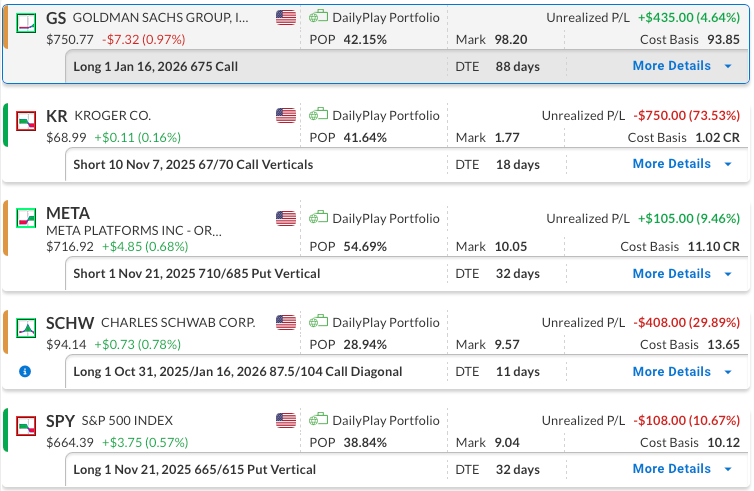
GS – 88 DTE
Bullish Long Call – Goldman Sachs Group, Inc. (GS) – We maintain a longer-term bullish outlook and plan to continue holding this position. We have lowered the cost basis of the position by selling a shorter-term call that expired worthless. The company reported earnings this Tuesday, the 14th and beat expectations.
KR – 18 DTE
Bearish Credit Spread – The Kroger Co. (KR) – This position is currently showing a loss. We need bearish momentum to pick up early in the week, or we may have to exit at the stop loss.
META – 32 DTE
Bullish Credit Spread – Meta Platforms, Inc. (META) – This position currently has a minimal gain, which we plan to maintain for now. Meta is expected to release earnings on Wednesday, October 29th, after the close.
SCHW – 11 DTE & 88 DTE
Bullish Diagonal Debit Spread – Charles Schwab Corp. (SCHW) – The company reported earnings on Thursday, October 16th, before the open and beat expectations on both the top and bottom line. We continue to maintain a bullish outlook on Schwab. After realizing gains on the initial long call, we rolled into a higher strike with a later expiration. To further reduce our cost basis, we recently sold a short-term out-of-the-money call against the long position.
SPY – 32 DTE
Bearish Debit Spread – SPDR S&P 500 ETF (SPY) – This position is currently showing a small loss, and we plan to maintain it for now.
SPOT

DailyPlay – Closing Trade (SPOT) – October 17, 2025
Closing Trade
- SPOT – 45% gain: Buy to Close 1 Contract (or 100% of your Contracts) Oct 31 $695/$725 Call Vertical Spreads @ $6.47 Debit. DailyPlay Portfolio: By Closing 1 Contract, we will be paying $647. We initially opened this contract on October 14 @ $11.73 Credit. Our gain, therefore, is $526.
COST, PM
DailyPlay – Closing Trade (COST, PM) – October 16, 2025
Closing Trade
- COST – 55% loss: Sell to Close 1 Contract (or 100% of your Contracts) Oct 24 $950/$890 Put Vertical Spreads @ $9.07 Credit. DailyPlay Portfolio: By Closing 1 Contract, we will be collecting $907. We initially opened this contract on September 25 @ $20.22 Debit. Our loss, therefore, is $1,115 per contract.
- PM – 30% gain: Sell to Close 3 Contracts (or 100% of your Contracts) Oct 31 $165/$145 Put Vertical Spreads @ $8.40 Credit. DailyPlay Portfolio: By Closing 3 Contracts, we will be collecting $2,520. We initially opened these 3 contracts on September 17 @ $6.47 Debit. Our gain, therefore, is $579.
SPY

DailyPlay – Opening Trade (SPY) & Closing Trade (C) – October 15, 2025
Closing Trade
- C – 38% gain: Sell to Close 5 Contracts (or 100% of your Contracts) Oct 31 $95/$105 Call Vertical Spreads @ $5.04 Credit. DailyPlay Portfolio: By Closing 5 Contracts, we will be collecting $2,520. We initially opened these 5 contracts on October 09 @ $3.65 Debit. Our gain, therefore, is $695.
SPY Bearish Opening Trade Signal
Investment Rationale
Investment Thesis
On Day 14 of the U.S. government shutdown, the ongoing political stalemate in Washington continues to pressure market sentiment. With Democrats and Republicans still deadlocked over funding measures, investors face heightened uncertainty at a time when global markets are already strained by escalating trade tensions. The tariff war with Chinahas intensified, as new U.S. levies on imported wood, furniture, and cabinetry take effect alongside Beijing’s export restrictions on rare earth metals and battery components. These combined fiscal and trade headwinds underscore rising risks to growth, supply chains, and corporate margins. Against this backdrop of policy gridlock and global economic fragility, short-term downside in SPY appears increasingly likely, making bearish exposure through options a timely tactical play.
Technical Analysis
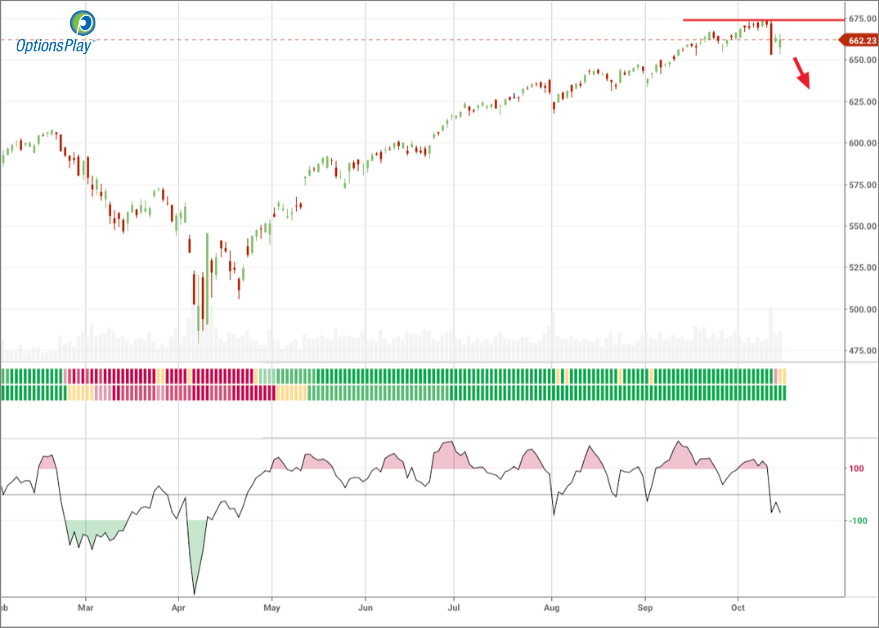
SPY has broken below its short-term uptrend, with price now testing support near the 50-day moving average. The 20-day MA has rolled over, signaling a loss of momentum after an extended rally through the summer. Price action shows a firm rejection at recent highs, and the appearance of a bearish engulfing candle confirms renewed selling pressure. A decisive break below the 50-day moving average could trigger a deeper retracement toward the prior consolidation range, where more meaningful support is likely to emerge. Until SPY reclaims the 20-day moving average and resumes forming higher highs, the technical bias remains bearish.
Fundamental Analysis
Macro conditions continue to soften as the combination of trade friction, persistent inflation, and weakening corporate earnings clouds the outlook. Elevated valuations leave little room for earnings disappointment, particularly with monetary policy still tight and fiscal operations disrupted by the government shutdown. Slowing consumer activity and increased import costs pose further risks to profitability, while the IMF’s subdued economic outlook reinforces the view that global growth momentum is losing steam. Altogether, these pressures point to a fragile environment for equities and justify maintaining a defensive posture toward SPY in the near term.
Options Trade
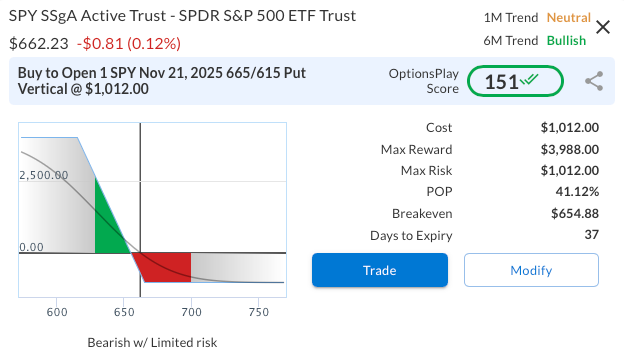
A SPY Nov 21, 2025, 665/615 Put Vertical Spread offers a defined-risk way to capture potential near-term weakness. The trade involves buying the 665 put and selling the 615 put for a net debit of $10.12 ($1,012 total cost). The maximum profit is $3,988 if SPY closes below 615 at expiration, while the maximum loss is capped at $1,012. This setup benefits from continued weakness over the next several weeks and offers an attractive risk/reward ratio of nearly 4:1. With 38 days until expiration, the position provides sufficient time for volatility expansion while minimizing exposure to time decay.
SPY – Daily
Trade Details
Strategy Details
Strategy: Long Put Vertical Spread
Direction: Bearish Debit Spread
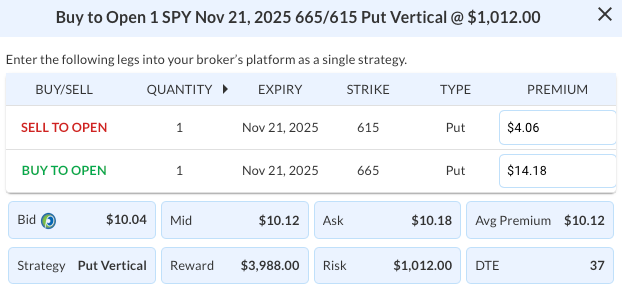
Details: Buy to Open 1 SPY Nov 21 $665/$615 Put Vertical Spreads @ $10.12 Debit per Contract.
Total Risk: This trade has a max risk of $1,012 (1 Contract x $1,012) based on a hypothetical $100k portfolio risking 2%. We suggest risking only 2% of the value of your portfolio and divide it by $1,012 to select the # contracts for your portfolio.
Trend Continuation Signal: This is a bearish trade on a stock that is expected to continue lower over the duration of this trade.
1M/6M Trends: Neutral/Bullish
Relative Strength: 7/10
OptionsPlay Score: 151
Stop Loss: @ $5.06 (50% loss of premium)
View SPY Trade
Entering the Trade
Use the following details to enter the trade on your trading platform. Please note that whenever there is a multi-leg option strategy, it should be entered as a single trade.
PLEASE NOTE that these prices are based on Tuesday’s closing prices. Should the underlying move significantly during the pre-market hours, we will likely adjust the strikes and prices to reflect a more accurate trade entry.
View SPY Trade
SPOT
DailyPlay – Opening Trade (SPOT) – October 14, 2025
SPOT Bearish Opening Trade Signal
Investment Rationale
Investment Thesis
Spotify Technology S.A. (SPOT) provides audio streaming subscription services worldwide through its Premium and Ad-Supported segments. Despite its strong brand recognition and market leadership, the company’s recent performance highlights growing operational challenges. SPOT has missed EPS expectations in each of the last four quarters, with the most recent June 2025 report showing a sharp swing to a loss of –$0.48 vs. a $2.13 consensus, underscoring weakening profitability. Shares, now near $692, remain well below their $785 peak as investors question cost discipline and growth sustainability amid fierce competition from Apple Music and YouTube. While Spotify’s global scale remains an advantage, its elevated valuation and deteriorating earnings trajectory keep the risk/reward profile skewed to the downside.
Technical Analysis
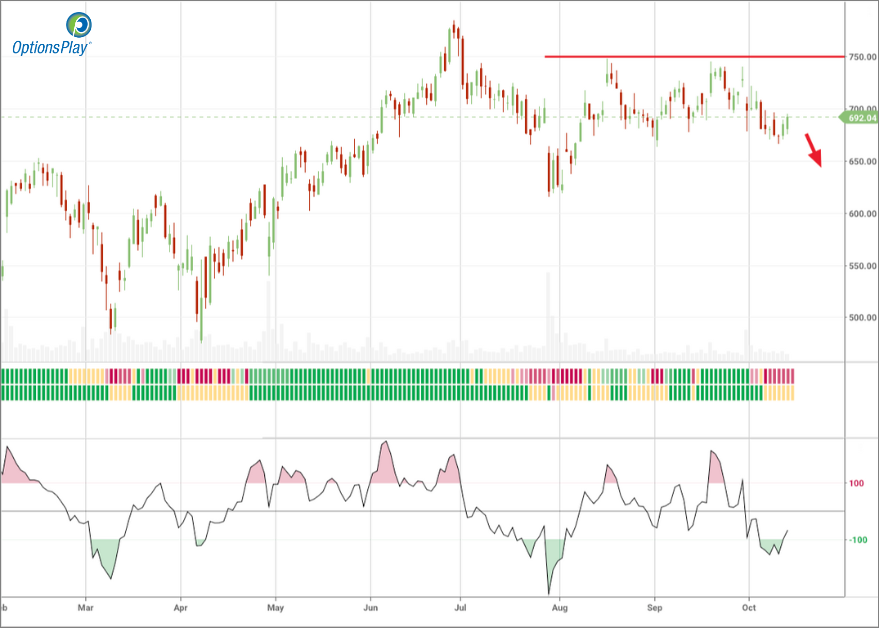
From a technical perspective, SPOT’s powerful 130% advance from the November 2024 lows around $300 culminated in a failed breakout attempt near $785 in June 2025. Since then, the stock has carved out a broad consolidation pattern, with the recent rebound to $692 representing a modest corrective move rather than a sustained reversal. Price action remains constrained below the flattening 20-day and 50-day moving averages, which have converged and now serve as firm resistance around $700. Momentum indicators continue to favor the bears, and a breakdown through the $663 support level could open the path toward the 200-day moving average at $611, reinforcing the bearish technical bias.
Fundamental Analysis
Spotify’s premium valuation remains difficult to justify amid mixed growth execution and rising competitive pressures. While the company’s leadership position and user growth remain strengths, margin improvement has lagged expectations, and investors are increasingly questioning the scalability of its model. Current valuation and profitability data highlight this imbalance:
- Forward PE Ratio: 51.59x vs. Industry Median 21.29x
- Expected EPS Growth: 45.57% vs. Industry Median 13.75%
- Expected Revenue Growth: 17.59% vs. Industry Median 13.01%
- Net Margins: 4.72% vs. Industry Median 3.98%
Options Trade
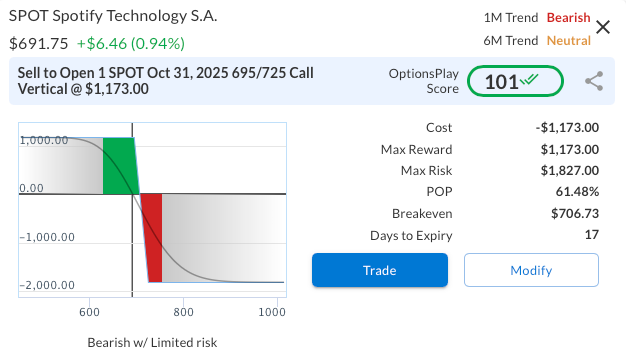
To express a bearish view with defined risk, consider selling the SPOT Oct 31, 2025 695/725 Call Vertical for a net credit of $11.73. This trade profits if SPOT remains below $695 at expiration, with a maximum reward of $1,173 and maximum risk of $1,827. The October 31, 2025 expiration was deliberately chosen to avoid exposure to the November 4 earnings report, thereby minimizing event-driven risk while maintaining exposure to a potential downside continuation into late October.
SPOT – Daily
Trade Details
Strategy Details
Strategy: Short Call Vertical Spread
Direction: Bearish Credit Spread
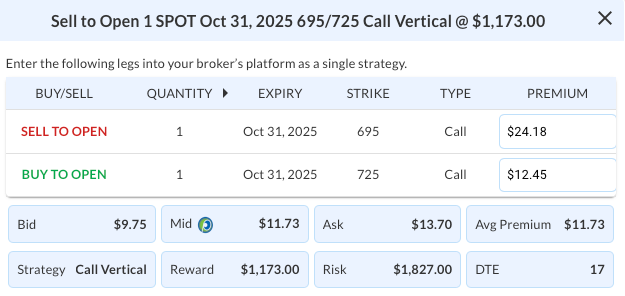
Details: Sell to Open 1 SPOT Oct 31 $695/$725 Call Vertical Spreads @ $11.73 Credit per Contract.
Total Risk: This trade has a max risk of $1,827 (1 Contract x $1,827) based on a hypothetical $100k portfolio risking 2%. We suggest risking only 2% of the value of your portfolio and divide it by $1,827 to select the # contracts for your portfolio.
Trend Continuation Signal: This is a bearish trade on a stock that is expected to continue lower over the duration of this trade.
1M/6M Trends: Bearish/Neutral
Relative Strength: 7/10
OptionsPlay Score: 101
Stop Loss: @ $23.46 (100% loss to value of premium)
View SPOT Trade
Entering the Trade
Use the following details to enter the trade on your trading platform. Please note that whenever there is a multi-leg option strategy, it should be entered as a single trade.
PLEASE NOTE that these prices are based on Monday’s closing prices. Should the underlying move significantly during the pre-market hours, we will likely adjust the strikes and prices to reflect a more accurate trade entry.
View SPOT Trade
$FDX
DailyPlay – Closing Trade (FDX) & Portfolio Review – October 13, 2025
Closing Trade
- FDX – 64% loss: Buy to Close 3 Contracts (or 100% of your Contracts) Nov 21 $240/$230 Put Vertical Spreads @ $6.02 Debit. DailyPlay Portfolio: By Closing 3 Contracts, we will be paying $1,806. We initially opened these 3 contracts on October 08 @ $3.67 Credit. Our loss, therefore, is $235 per contract.
DailyPlay Portfolio Review

Our Trades
C – 18 DTE
Bullish Debit Spread – Citigroup Inc. (C) – We recently established this position, which is currently down, and we plan to stay the course for now. Citigroup Inc. is set to report earnings this Tuesday, the 14th, before the open.
COST – 11 DTE
Bearish Debit Spread – Costco Wholesale Corporation (COST) – The position remains profitable, with continued downside momentum last week driven by a mixed consumer environment and renewed tariff concerns. We plan to maintain the position for now.
FDX – 39 DTE
Bullish Credit Spread – FedEx Corp. (FDX) – We are closing this position today.
GS – 95 DTE
Bullish Call – Goldman Sachs Group, Inc. (GS) – We maintain a longer-term bullish outlook and plan to continue holding this position. We have lowered the cost basis of the position by selling a shorter-term call that expired worthless. The company is set to report earnings this Tuesday, the 14th, before the open.
KR – 25 DTE
Bearish Credit Spread – The Kroger Co. (KR) – We recently opened this position, which is currently showing a loss, and we plan to maintain it for now.
META – 39 DTE
Bullish Credit Spread – Meta Platforms, Inc. (META) – We recently entered this position, which we plan to maintain for now. Meta is expected to release earnings on Wednesday, October 29th, after the close.
PM – 18 DTE
Bearish Put Debit Spread – Philip Morris International Inc. (PM) – The position remains slightly profitable, and we plan to maintain it for now. Despite a strong rebound this week, the 20-day moving average is nearing a bearish crossover below the 200-day, indicating underlying weakness in the trend.
SCHW – 18 DTE & 95 DTE
Bullish Diagonal Debit Spread – Charles Schwab Corp. (SCHW) – We continue to maintain a bullish outlook on Schwab, which reports earnings on Thursday, October 16th, before the open. After realizing gains on the initial long call, we rolled into a higher strike with a later expiration. To further reduce our cost basis, we recently sold a short-term out-of-the-money call against the long position.
SPOT
DailyPlay – Closing Trade (SPOT) – October 10, 2025
Closing Trade
- SPOT – 54% gain: Buy to Close 1 Contract (or 100% of your Contracts) Oct 24 $705/$735 Call Vertical Spreads @ $6.12 Debit. DailyPlay Portfolio: By Closing 1 Contract, we will be paying $612. We initially opened this contract on September 11 @ $13.43 Credit. Our gain, therefore, is $731.
C
DailyPlay – Opening Trade (C) – October 09, 2025
C Bullish Opening Trade Signal
Investment Rationale
Investment Thesis
Citigroup Inc. (C) presents an attractive opportunity for bullish positioning as the stock consolidates near support following a strong multi-month uptrend. Citigroup, Inc. is set to report earnings this Tuesday, Oct 14th, before the open. Despite near-term volatility tied to upcoming earnings, the intermediate trend remains constructive, underpinned by improving fundamentals and relative strength versus the broader financial sector. With valuation metrics still below peers and market sentiment recovering, this pullback offers traders a compelling entry point for upside exposure into year-end.
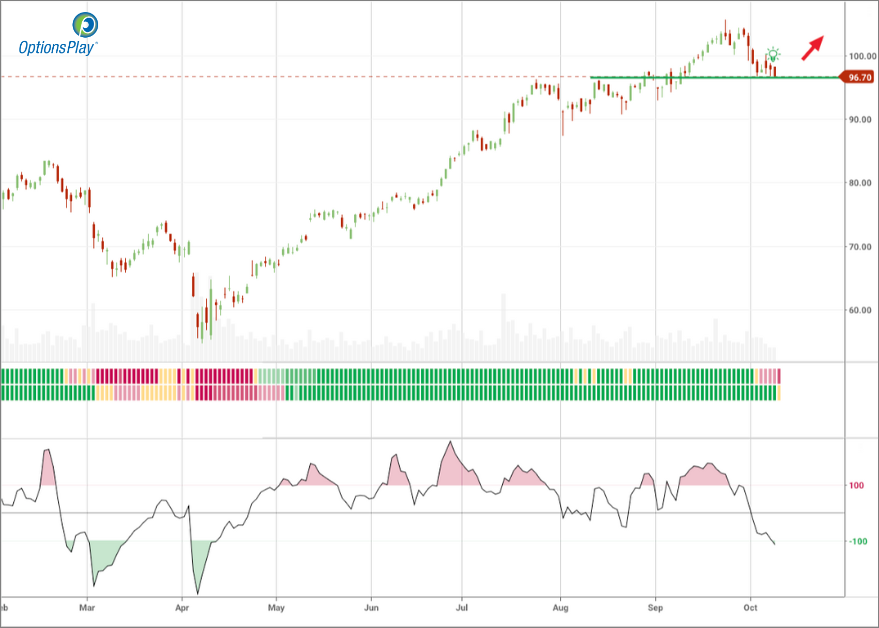
Technical Analysis
Citi recently broke above its $97 resistance level and has since retested that zone as new support, confirming the breakout. The alignment of the 20-day, 50-day, and 200-day moving averages in bullish order highlights strong trend structure. Price action remains constructive despite a brief consolidation, with RSI having reset from overbought to neutral levels, allowing room for another push higher. A sustained hold above the 20-day moving average keeps the bullish setup intact, with earnings serving as a potential catalyst for a measured move toward $135 over the intermediate term.
Fundamental Analysis
Citigroup remains modestly undervalued relative to peers, trading at a discount on a price-to-book (PB) basis that highlights its potential for multiple expansion as profitability improves. The company’s PB ratio of 0.91x suggests investors have yet to fully price in its ongoing operational turnaround and efficiency gains. With strong expected EPS growth and a renewed focus on streamlining business lines, Citigroup is positioned to close the valuation gap with peers. Furthermore, its solid balance sheet and consistent dividend yield strengthen its appeal in a sustained higher-rate environment.
- PB Ratio: 0.91x vs. Industry Median 1.37x
- Expected EPS Growth: 23.41% vs. Industry Median 10.90%
- Expected Revenue Growth: 3.52% vs. Industry Median 5.73%
- Net Margins: 17.06% vs. Industry Median 26.86%
Options Trade
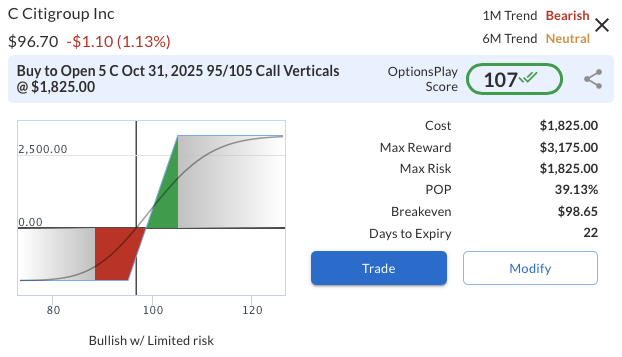
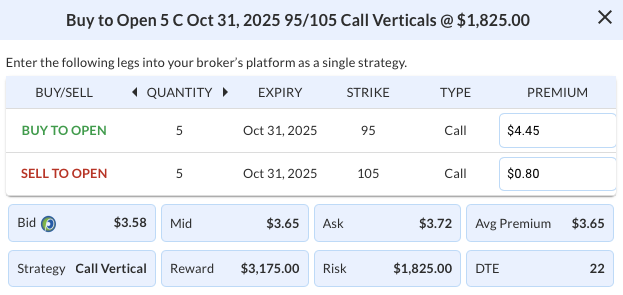
The proposed trade is a bull call vertical, established by buying the Oct 31, 2025 $95 call and selling the $105 call for a net debit of $3.65. This defined-risk strategy provides targeted upside participation while capping downside exposure ahead of earnings. The maximum potential profit is $635 if C closes above $105 at expiration, offering a risk/reward ratio of roughly 1.74:1. The setup seeks to capitalize on a rebound from current support within the broader bullish trend, using moderate leverage to express directional conviction while managing time decay and volatility around the earnings event.
C – Daily
Trade Details
Strategy Details
Strategy: Long Call Vertical Spread
Direction: Bullish Debit Spread
Details: Buy to Open 5 C Oct 31 $95/$105 Call Vertical Spreads @ $3.65 Debit per Contract.
Total Risk: This trade has a max risk of $1,825 (5 Contracts x $365) based on a hypothetical $100k portfolio risking 2%. We suggest risking only 2% of the value of your portfolio and divide it by $365 to select the # contracts for your portfolio.
Trend Continuation Signal: This is a bullish trade on a stock that is expected to continue higher over the duration of this trade.
1M/6M Trends: Bearish/Neutral
Relative Strength: 9/10
OptionsPlay Score: 107
Stop Loss: @ $1.83 (50% loss of premium)
View C Trade
Entering the Trade
Use the following details to enter the trade on your trading platform. Please note that whenever there is a multi-leg option strategy, it should be entered as a single trade.
PLEASE NOTE that these prices are based on Wednesday’s closing prices. Should the underlying move significantly during the pre-market hours, we will likely adjust the strikes and prices to reflect a more accurate trade entry.
View C Trade
FDX
DailyPlay – Opening Trade (FDX) – October 08, 2025
FDX Bullish Opening Trade Signal
Investment Rationale
Investment Thesis
FedEx Corp. (FDX) presents a compelling bullish setup as it benefits from operational efficiency improvements, stable pricing, and resilient e-commerce-driven volumes despite macroeconomic headwinds. The company’s ongoing cost optimization initiatives and strategic capital allocation are positioning it for margin expansion and earnings stability through FY2025. With the transportation sector showing early signs of cyclical recovery, FedEx’s discounted valuation relative to peers offers an attractive entry point for investors seeking exposure to a potential logistics rebound. Near-term consolidation above key technical support strengthens the case for a continued rally toward the $275 price target.
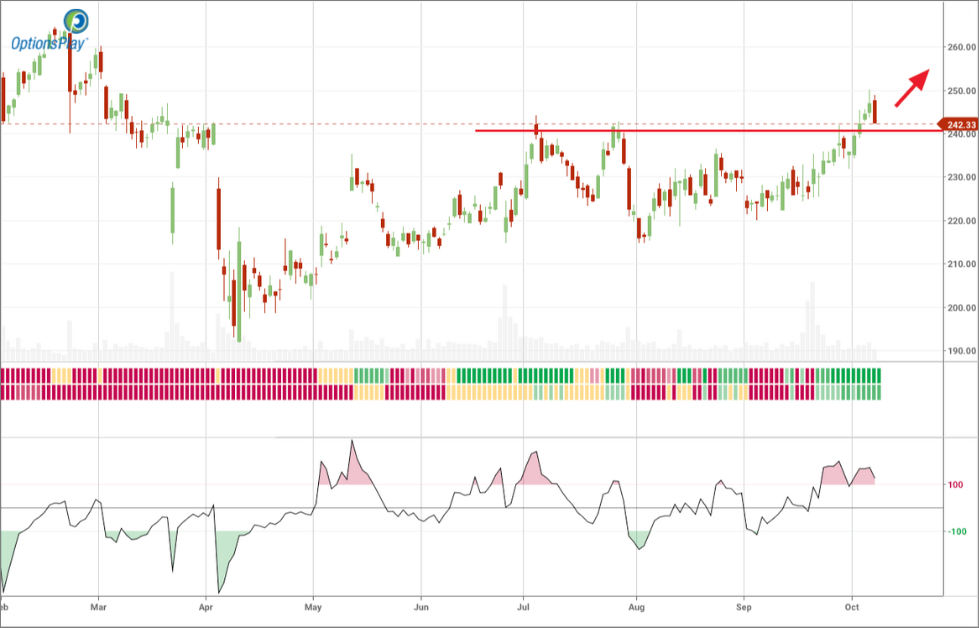
Technical Analysis
FDX has broken decisively above the $240 resistance, backed by strengthening momentum and a bullish short-term moving average crossover. Price action remains constructive, with the stock holding above key moving averages and RSI trending firmly near 60. Maintaining traction above $240 would confirm trend continuation and set up an upside move toward $260–$275.
Fundamental Analysis
FedEx’s fundamentals underscore a valuation disconnect versus peers, despite growth and profitability metrics that remain highly competitive. The company’s disciplined cost control and network optimization initiatives continue to enhance earnings visibility and free cash flow generation.
- Forward PE Ratio: 13.57x vs. Industry Median 17.27x
- Expected EPS Growth: 9.30% vs. Industry Median 9.53%
- Expected Revenue Growth: 4.03% vs. Industry Median 3.97%
- Net Margins: 4.65% vs. Industry Median 5.71%
This valuation discount, combined with FedEx’s improving efficiency and moderate revenue growth outlook, positions the stock as substantially undervalued within the transportation group.
Options Trade
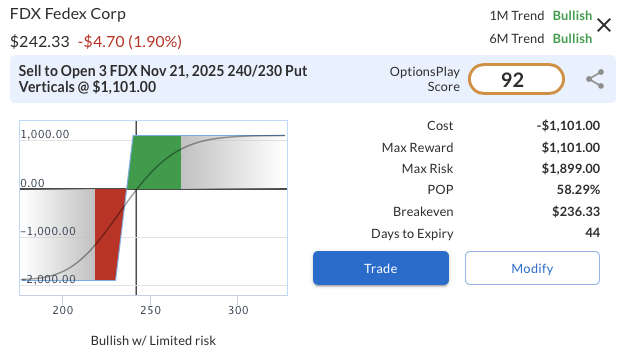
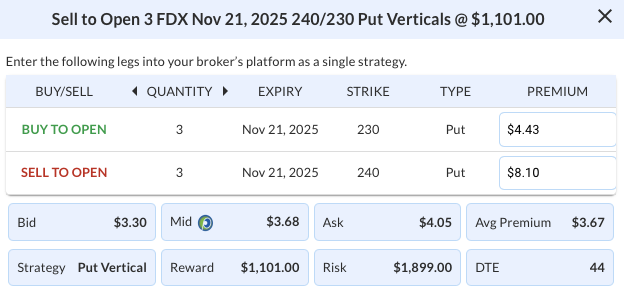
To express a bullish outlook with defined risk, consider selling the FDX Nov 21, 2025 $240/$230 Put Vertical Spread for a net credit of $3.67. The position profits if FDX remains above $240 at expiration, generating a maximum potential reward of $367 against a maximum risk of $633. This setup offers an attractive return on risk of approximately 58% over the holding period. The $240 short strike sits near established support, positioning the trade to benefit from continued strength while preserving downside protection.
FDX – Daily
Trade Details
Strategy Details
Strategy: Short Put Vertical Spread
Direction: Bullish Credit Spread
Details: Sell to Open 3 FDX Nov 21 $240/$230 Put Vertical Spreads @ $3.67 Credit per Contract.
Total Risk: This trade has a max risk of $1,899 (3 Contracts x $633) based on a hypothetical $100k portfolio risking 2%. We suggest risking only 2% of the value of your portfolio and divide it by $633 to select the # contracts for your portfolio.
Trend Continuation Signal: This is a bullish trade on a stock that is expected to continue higher over the duration of this trade.
1M/6M Trends: Bullish/Bullish
Relative Strength: 6/10
OptionsPlay Score: 92
Stop Loss: @ $7.34 (100% loss to value of premium)
View FDX Trade
Entering the Trade
Use the following details to enter the trade on your trading platform. Please note that whenever there is a multi-leg option strategy, it should be entered as a single trade.
PLEASE NOTE that these prices are based on Tuesday’s closing prices. Should the underlying move significantly during the pre-market hours, we will likely adjust the strikes and prices to reflect a more accurate trade entry.