
CZR

DailyPlay – Opening Trade (CZR) – September 23, 2025
CZR Bearish Opening Trade Signal
Investment Rationale
Investment Thesis
Caesars Entertainment (CZR) faces a challenging macro and competitive backdrop that supports a bearish stance. Intensifying competition from online gambling platforms and rival casino operators is eroding market share at a time when consumer discretionary spending is under pressure from sticky inflation and softening labor market trends. These headwinds are particularly problematic for companies like CZR that rely heavily on discretionary leisure spending and sustained consumer confidence. Against this backdrop, the stock’s elevated valuation relative to peers leaves it vulnerable to further downside repricing.
Technical Analysis
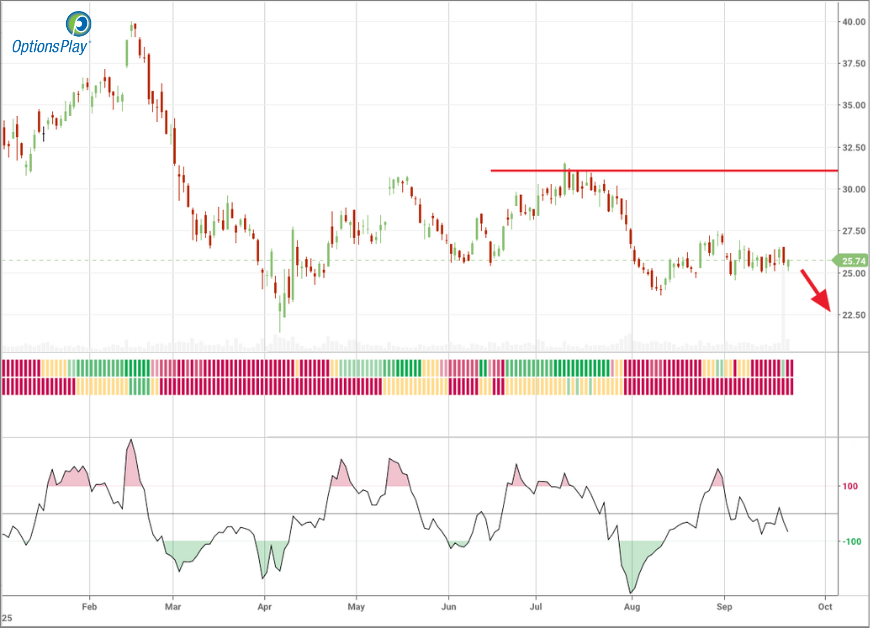
CZR was recently rejected at its $31 resistance level and has since slipped back below both its 20-day and 50-day moving averages, signaling renewed downside momentum. The 200-day moving average, currently near $29.60, continues to act as longer-term resistance and reinforces the bearish setup. Momentum indicators remain weak, with RSI stalled near neutral, leaving room for further downside. With near-term support around $24 and a downside target closer to $18, the overall chart structure favors bearish positioning.
Fundamental Analysis
CZR’s financial profile reinforces the technical weakness, as the company trades at a steep premium despite underwhelming growth and margin trends compared to the industry. Elevated valuation multiples paired with negative profitability raise concerns about downside risk if macro conditions worsen or market share pressures intensify.
- Forward PE Ratio: 32.56x vs. Industry Median 15.93x
- Expected EPS Growth: 0% vs. Industry Median 11.75%
- Expected Revenue Growth: 2.50% vs. Industry Median 5.47%
- Net Margins: -1.71% vs. Industry Median 9.73%
Options Trade
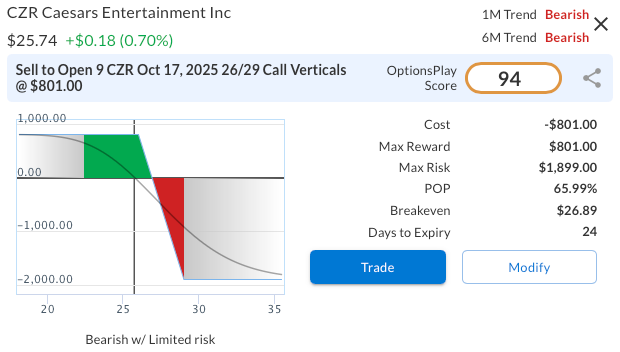
To capitalize on this bearish view, we recommend initiating a bear call spread by selling the CZR Oct 17, 2025, $26 call and buying the $29 call for a net credit of $0.89. This trade structure benefits from the stock remaining below the $26 strike, aligning. The maximum profit is $89 per spread, realized if CZR closes at or below $26 at expiration, while the maximum risk is $211, creating a reward-to-risk ratio of roughly 1:2.4. This setup offers defined risk and efficient capital usage, making it an attractive way to express bearish exposure while taking advantage of elevated option premiums.
CZR – Daily
Trade Details
Strategy Details
Strategy: Short Call Vertical Spread
Direction: Bearish Credit Spread
Details: Sell to Open 9 CZR Oct 17 $26/$29 Call Vertical Spreads @ $0.89 Credit per Contract.
Total Risk: This trade has a max risk of $1,899 (9 Contracts x $211) based on a hypothetical $100k portfolio risking 2%. We suggest risking only 2% of the value of your portfolio and divide it by $211 to select the # contracts for your portfolio.
Trend Continuation Signal: This is a bearish trade on a stock that is expected to continue lower over the duration of this trade.
1M/6M Trends: Bearish/Bearish
Relative Strength: 2/10
OptionsPlay Score: 94
Stop Loss: @ $1.78 (100% loss to value of premium)
View CZR Trade
Entering the Trade
Use the following details to enter the trade on your trading platform. Please note that whenever there is a multi-leg option strategy, it should be entered as a single trade.
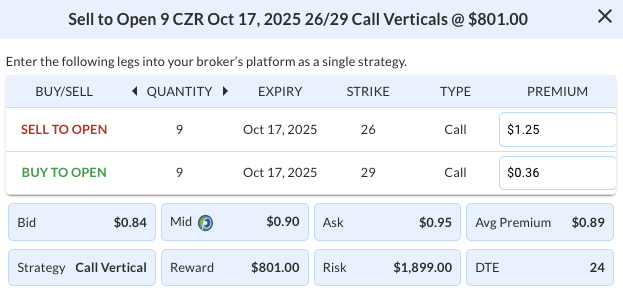
PLEASE NOTE that these prices are based on Monday’s closing prices. Should the underlying move significantly during the pre-market hours, we will likely adjust the strikes and prices to reflect a more accurate trade entry.
View CZR Trade

DailyPlay – Portfolio Review – September 22, 2025
DailyPlay Portfolio Review
Our Trades
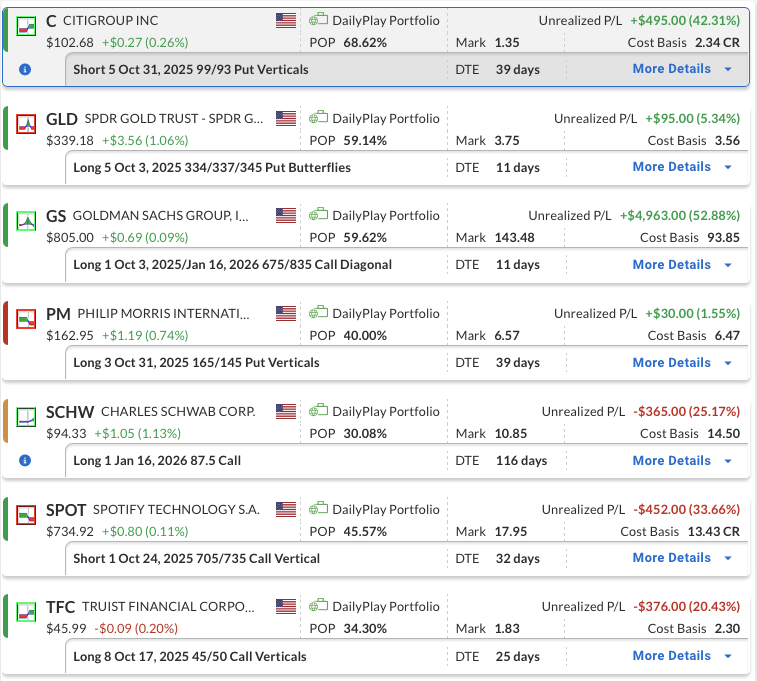
C – 39 DTE
Bullish Credit Spread – Citigroup Inc (C) – We recently established this position, it is currently profitable, and we plan to stay the course for now.
GLD – 11 DTE
Bearish Butterfly – SPDR Gold Shares (GLD) – We have a neutral to bearish strategy on GLD. With expiration approaching and the position showing a small gain currently, it is okay to exit at any point. We will hold the position and will also be prepared to close at the beginning of the week. The strategy benefits if GLD drops to 337, the middle strike of the butterfly, or below. Keep a close eye on the position and close during the day if the opportunity presents itself to take a gain or if the stop loss point is hit. The position’s profit and loss will be volatile with expiration so close.
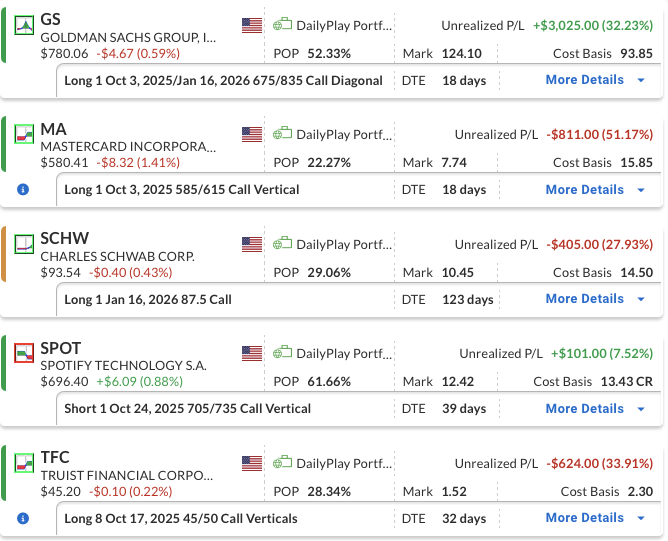
GS – 11 DTE & 116 DTE
Bullish Diagonal Debit Spread – Goldman Sachs Group, Inc. (GS) – We maintain a bullish outlook over the longer term and plan to hold this position. To lower the cost basis, we sold a short-term OTM call against the long position.
PM – 39 DTE
Bearish Put Debit Spread – Philip Morris International Inc. (PM) – We recently established this position, it is showing a slight profit, and we plan to stay the course for now.
SCHW – 116 DTE
Bullish Long Call – Charles Schwab Corp. (SCHW) – We maintain our bullish outlook on Schwab. After our initial long call, we captured the gain and rolled into a higher strike call with a later expiration. We may sell calls to reduce risk if the timing is appropriate.
SPOT – 32 DTE
Bearish Credit Spread – Spotify Technology (SPOT) – We recently established this position, it is currently down, but with plenty of time until expiration we plan to stay the course for now.
TFC – 25 DTE
Bullish Debit Spread – Truist Financial Corporation (TFC) – The position is showing a loss, but we plan to stay the course for now and keep a close eye on it as expiration approaches.
MA

DailyPlay – Closing Trade (MA) – September 19, 2025
Closing Trade
- MA – 39% loss: Sell to Close 1 Contract (or 100% of your Contracts) Oct 03 $585/$615 Call Vertical Spreads @ $9.71 Credit. DailyPlay Portfolio: By Closing 1 Contract, we will be collecting $971. We adjusted this position and added a short call on September 05 reducing our cost basis to $1,585 Debit. Our loss, therefore, is $614 per contract.
GLD
DailyPlay – Opening Trade (GLD) – September 18, 2025
GLD Bearish Opening Trade Signal
Investment Rationale
Investment Thesis
The SPDR Gold Shares ETF (GLD) has delivered an exceptional rally in 2025, advancing more than 50% year-to-date as investors sought safety amid geopolitical risks, central bank accumulation, and shifting policy expectations. However, the rally appears stretched, with gold prices trading at extreme levels relative to both technical conditions and historical benchmarks. As the Federal Reserve signals resilience in the U.S. economy while moderating its rate policy, the risk/reward dynamic for gold shifts toward a potential downside correction. This setup makes GLD a compelling candidate for a tactical bearish trade.
Technical Analysis
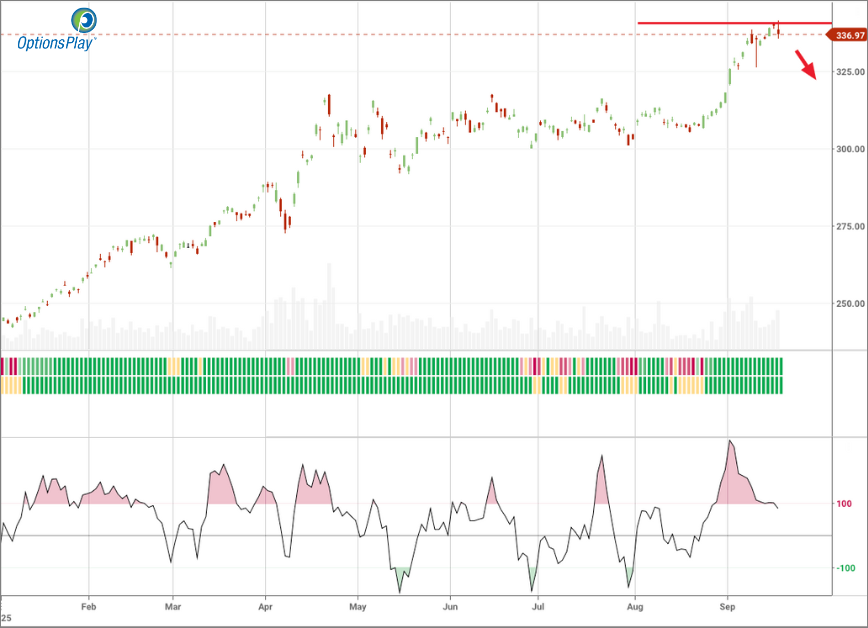
GLD is trading near all-time highs just below $341 after a parabolic upside move, suggesting exhaustion risk. The ETF’s RSI stands at 72.85, firmly in overbought territory. Notably, within the options play platform yesterday, a “Bearish Counter Trend” alert was generated, highlighting that GLD has been extremely bullish but is now exhibiting signs of a potential reversal into a bearish trend. Key downside levels include the 20-day moving average near $325 as an initial trigger, followed by the 50-day moving average around $315 and the 200-day at $287. A sustained break below $325 would confirm downside momentum, with an upside resistance existing near the recent all-time high around $341.
Fundamental Analysis
From a fundamental perspective, gold is trading well above its long-term, inflation-adjusted average, raising questions about the sustainability of its current premium. While demand drivers like persistent inflation and central bank buying have supported prices, the potential for shifts in global risk appetite or reduced safe-haven demand present downside risks. With U.S. yields stabilizing but the dollar remaining weak, gold’s safe-haven premium could begin to compress if dollar sentiment reverses or if other asset classes regain investor favor. Current macro conditions may therefore limit further upside for gold in the near term, putting its elevated premium at risk of correction.
Options Trade
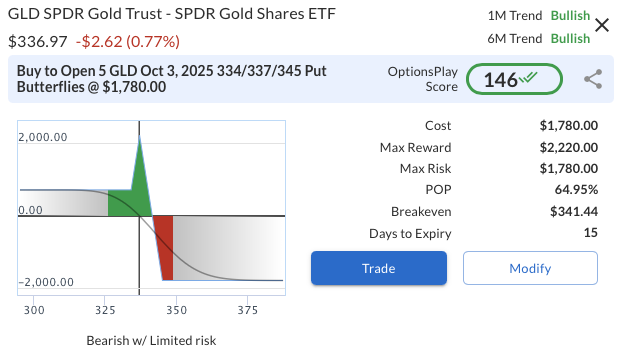
A tactical bearish expression can be structured with a GLD Oct 3, 2025, 334/337/345 Put Butterfly entered at a $356 debit. This is a non-standard butterfly, often referred to as an Open-Wing Butterfly, where the long spread is 8 points wide and the short spread is 3 points wide, which creates profitability not only near the $337 strike but also anywhere below the $334 put strike at expiration. The maximum potential reward is $444, with risk capped at the $356 cost. This structure aligns with the view that GLD may retrace sharply from overbought levels, offering attractive asymmetric exposure to downside while containing risk through defined premium outlay.
GLD – Daily
Trade Details
Strategy Details
Strategy: Long Put Butterfly Spread
Direction: Bearish Butterfly Spread
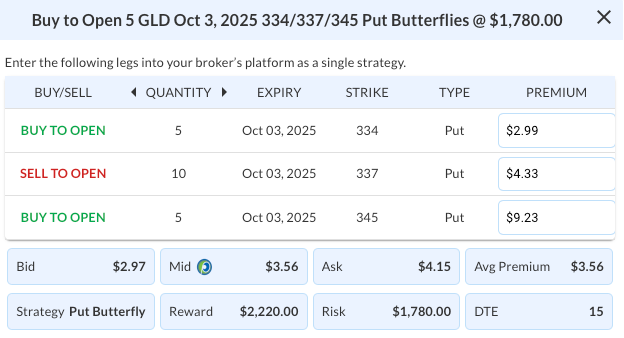
Details: Buy to Open 5 GLD Oct 03 $334/$337/$345 Put Butterfly Spreads @ $3.56 Debit per Contract.
Total Risk: This trade has a max risk of $1,780 (5 Contracts x $356) based on a hypothetical $100k portfolio risking 2%. We suggest risking only 2% of the value of your portfolio and divide it by $356 to select the # contracts for your portfolio.
Counter-Trend Signal: This is a bearish trade on a stock that is expected to continue lower over the duration of this trade.
1M/6M Trends: Bullish/Bullish
Relative Strength: 8/10
OptionsPlay Score: 146
Stop Loss: @ $1.78 (50% loss of premium)
View GLD Trade
Entering the Trade
Use the following details to enter the trade on your trading platform. Please note that whenever there is a multi-leg option strategy, it should be entered as a single trade.
PLEASE NOTE that these prices are based on Wednesday’s closing prices. Should the underlying move significantly during the pre-market hours, we will likely adjust the strikes and prices to reflect a more accurate trade entry.
View GLD Trade
PM
DailyPlay – Opening Trade (PM) – September 17, 2025
PM Bearish Opening Trade Signal
Investment Rationale
Investment Thesis
Philip Morris International (PM) is showing signs of weakness as both technical and fundamental dynamics point to a more challenging backdrop. While the company remains a global leader in reduced-risk products and traditional tobacco, its elevated valuation and margin pressures leave little room for error. With price action stalling and momentum indicators rolling over, downside risks appear to be gaining traction. Against this backdrop, a defined-risk options strategy provides an efficient way to express a bearish view while limiting capital at risk.
Technical Analysis
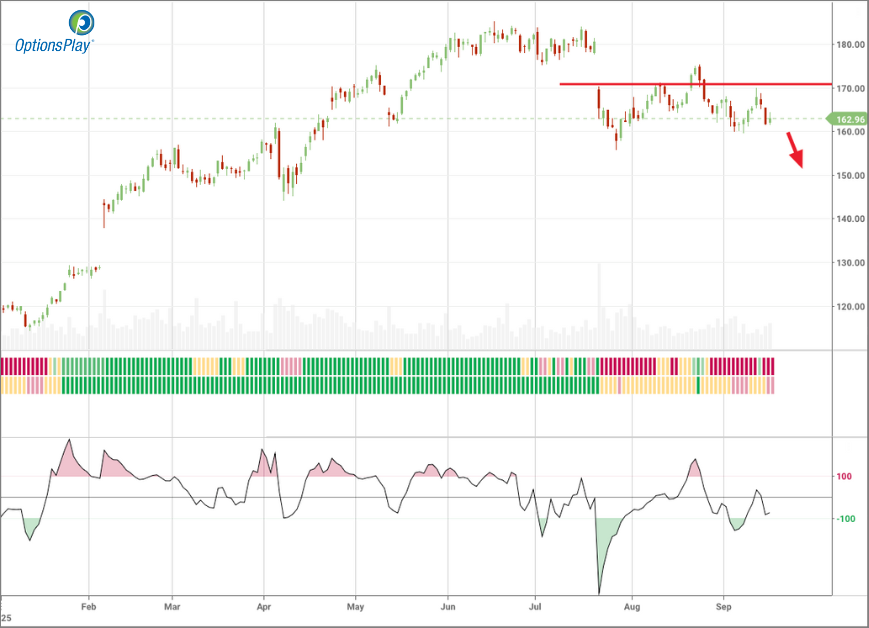
On the daily chart, PM is consolidating, suggesting a potential reversal from its prior uptrend. The $161 area has been repeatedly tested and shows early signs of weakness on declining volume, indicating rising selling pressure. Technical indicators point to a bearish bias: the RSI sits at 43.2, below the neutral 50 level, while both the 20-day and 50-day moving averages are turning downward, with the 50-day acting as resistance recently. A decisive break below $161 would confirm a downward move. Until then, the setup favors cautious or bearish positioning, particularly as fundamentals continue to soften.
Fundamental Analysis
Philip Morris trades at a premium relative to its industry peers while delivering weaker margins, raising questions about sustainability if growth expectations falter. Revenue and EPS growth projections remain stronger than the industry median, but valuation and profitability leave the stock exposed should sentiment deteriorate further.
- Forward PE Ratio: 19.83x vs. Industry Median 15.57x
- Expected EPS Growth: 11.74% vs. Industry Median 7.99%
- Expected Revenue Growth: 7.84% vs. Industry Median 3.79%
- Net Margins: 21.08% vs. Industry Median 32.23%
Options Trade
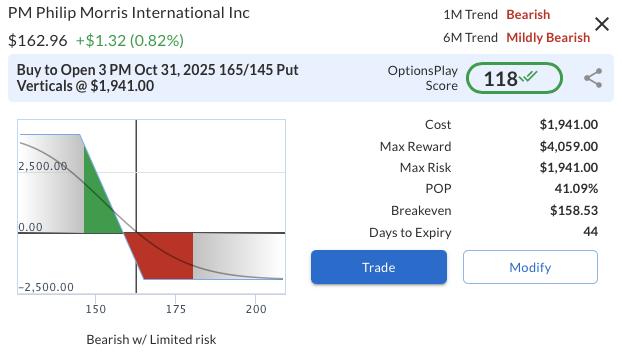
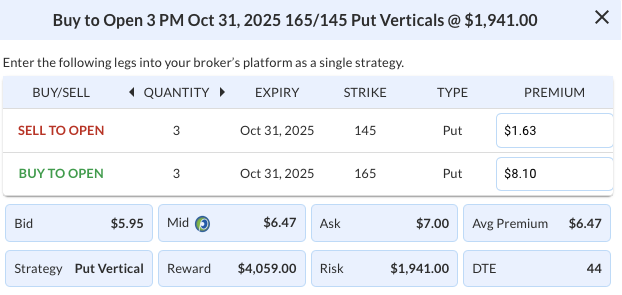
A put vertical spread offers defined risk and favorable leverage to the downside. The suggested trade is to buy the Oct 31, 2025 $165 put and sell the $145 put for a net debit of $6.47 ($647 per spread). This structure risks $647 while offering a maximum reward of $1,353 if PM closes at or below $145 at expiration. The reward-to-risk ratio of roughly 2.1:1 makes the setup attractive. This approach provides efficient bearish exposure without the unlimited risk of outright shorting.
PM – Daily
Trade Details
Strategy Details
Strategy: Long Put Vertical Spread
Direction: Bearish Debit Spread
Details: Buy to Open 3 PM Oct 31 $165/$145 Put Vertical Spreads @ $6.47 Debit per Contract.
Total Risk: This trade has a max risk of $1,941 (3 Contracts x $647) based on a hypothetical $100k portfolio risking 2%. We suggest risking only 2% of the value of your portfolio and divide it by $647 to select the # contracts for your portfolio.
Trend Continuation Signal: This is a bearish trade on a stock that is expected to continue lower over the duration of this trade.
1M/6M Trends: Bearish/Mildly Bearish
Relative Strength: 4/10
OptionsPlay Score: 118
Stop Loss: @ $3.24 (50% loss of premium)
View PM Trade
Entering the Trade
Use the following details to enter the trade on your trading platform. Please note that whenever there is a multi-leg option strategy, it should be entered as a single trade.
PLEASE NOTE that these prices are based on Tuesday’s closing prices. Should the underlying move significantly during the pre-market hours, we will likely adjust the strikes and prices to reflect a more accurate trade entry.
View PM Trade
C

DailyPlay – Opening Trade (C) – September 16, 2025
C Bullish Opening Trade Signal
Investment Rationale
Investment Thesis
Citigroup (C) offers an attractive bullish setup as it continues to improve its profitability and strengthen its balance sheet. The stock remains modestly undervalued compared to peers, yet it is demonstrating relative strength against the broader financial sector and the S&P 500. With management focused on efficiency gains and earnings growth, the current momentum in both the share price and fundamentals positions the stock for a sustained move higher. We see upside potential toward $135 as C closes its valuation gap while capitalizing on favorable macro tailwinds in the banking sector.
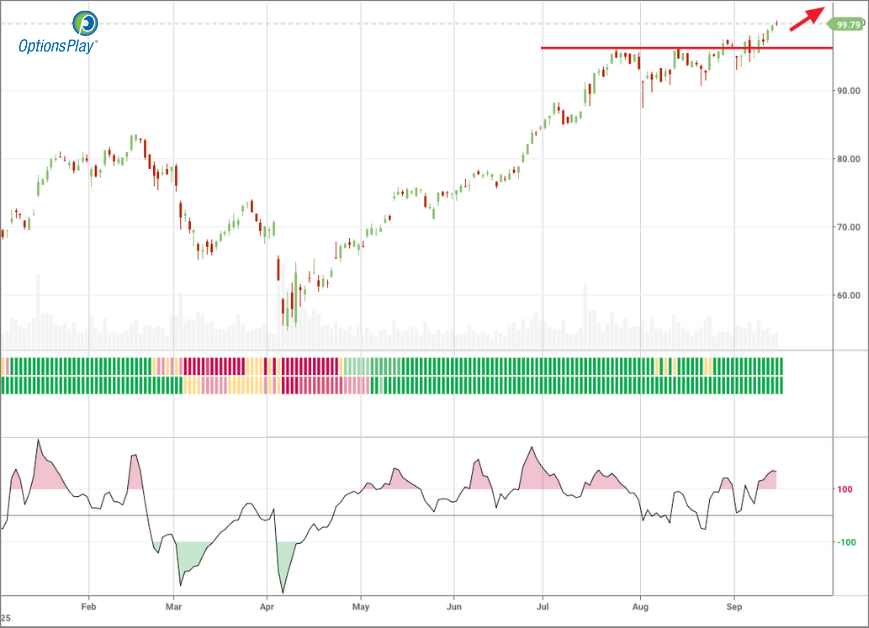
Technical Analysis
The stock has decisively cleared the $97 resistance level, which is now acting as firm support, while maintaining strength above the 20-day, 50-day, and 200-day moving averages, an alignment that confirms the prevailing uptrend. Momentum indicators are also supportive, with the RSI holding in the mid-60s, signaling steady buying interest without reaching overbought territory. This combination of technical strength and healthy momentum reinforces the bullish setup and points to further upside potential.
Fundamental Analysis
Citigroup continues to trade at a discount to peers, offering investors a value-driven growth story. While revenue growth lags the industry, its superior earnings trajectory reflects the company’s focus on restructuring, operational efficiency, and improved capital returns. Net margins remain below the sector median, but improving profitability should support multiple expansion.
- Price to Book Ratio: 0.93x vs. Industry Median 1.36x
- Expected EPS Growth: 23.21% vs. Industry Median 11.45%
- Expected Revenue Growth: 3.39% vs. Industry Median 5.73%
- Net Margins: 17.06% vs. Industry Median 26.86%
Options Trade
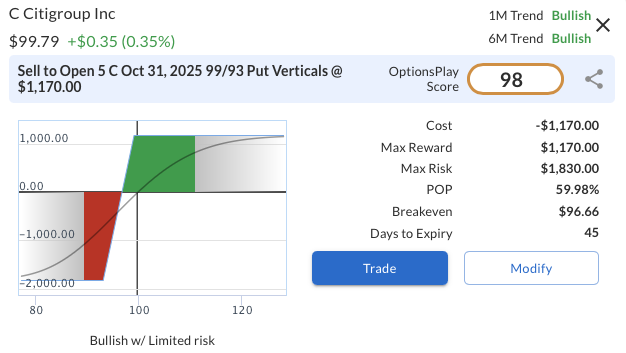
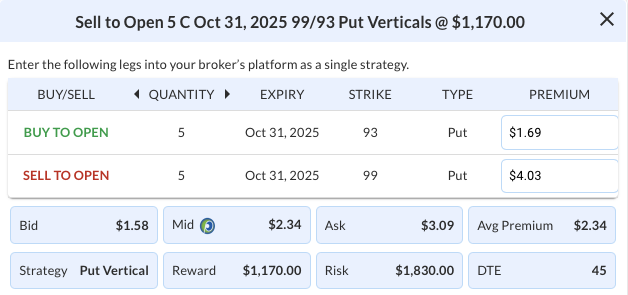
To express a bullish view on Citigroup (C), we recommend selling the Oct 31, 2025 $99/$93 put vertical spread for a net credit of $2.34. This involves selling the $99 put and buying the $93 put, resulting in a maximum potential profit of $234 per spread if C remains above $99 at expiration. The maximum risk is capped at $366 per spread, creating a favorable risk/reward setup where the trade yields a return of roughly 64% on risk if C holds above the short strike.
C – Daily
Trade Details
Strategy Details
Strategy: Short Put Vertical Spread
Direction: Bullish Credit Spread
Details: Sell to Open 5 C Oct 31 $99/$93 Put Vertical Spreads @ $2.34 Credit per Contract.
Total Risk: This trade has a max risk of $1,830 (5 Contracts x $366) based on a hypothetical $100k portfolio risking 2%. We suggest risking only 2% of the value of your portfolio and divide it by $366 to select the # contracts for your portfolio.
Trend Continuation Signal: This is a bullish trade on a stock that is expected to continue higher over the duration of this trade.
1M/6M Trends: Bullish/Bullish
Relative Strength: 9/10
OptionsPlay Score: 98
Stop Loss: @ $4.68 (100% loss to value of premium)
View C Trade
Entering the Trade
Use the following details to enter the trade on your trading platform. Please note that whenever there is a multi-leg option strategy, it should be entered as a single trade.
PLEASE NOTE that these prices are based on Monday’s closing prices. Should the underlying move significantly during the pre-market hours, we will likely adjust the strikes and prices to reflect a more accurate trade entry.
View C Trade
DailyPlay – Portfolio Review – September 15, 2025
DailyPlay Portfolio Review
Our Trades
GS – 18 DTE & 123 DTE
Bullish Diagonal Debit Spread – Goldman Sachs Group, Inc. (GS) – We maintain a bullish outlook over the longer term and plan to hold this position. To help manage risk ahead of this week’s Fed meeting, we sold a short-term OTM call against the long position last week.
MA – 18 DTE
Bullish Debit Spread – Mastercard Incorporated (MA) – We first entered this trade with a long call, given the very low IV rank of 6/100, which made spreads less appealing at the time. As the stock pulled back with the broader financial sector, we adjusted by selling a call against the position, converting it to a bull call spread to limit risk while preserving solid upside potential. Keeping in mind that expiration is nearing, we will maintain the position.
SCHW – 123 DTE
Bullish Long Call – Charles Schwab Corp. (SCHW) – We maintain our bullish outlook on Schwab. After our initial long call reached a delta of 1.00, we captured the gain and rolled into a higher strike call with a 0.80 delta and later expiration. With the Fed meeting this week, we will continue to monitor the position and may sell calls to reduce risk if the timing is appropriate.
SPOT – 39 DTE
Bearish Credit Spread – Spotify Technology (SPOT) – We recently established this position, it is showing a slight gain, and we plan to stay the course for now.
TFC – 32 DTE
Bullish Debit Spread – Truist Financial Corporation (TFC) – The position is showing a small loss, but with the Fed meeting this week, we plan to stay the course for now.
GS
DailyPlay – Adjusting Trade (GS) – September 12, 2025
GS Bullish Trade Adjustment Signal
Investment Rationale
Adjustment Rationale:
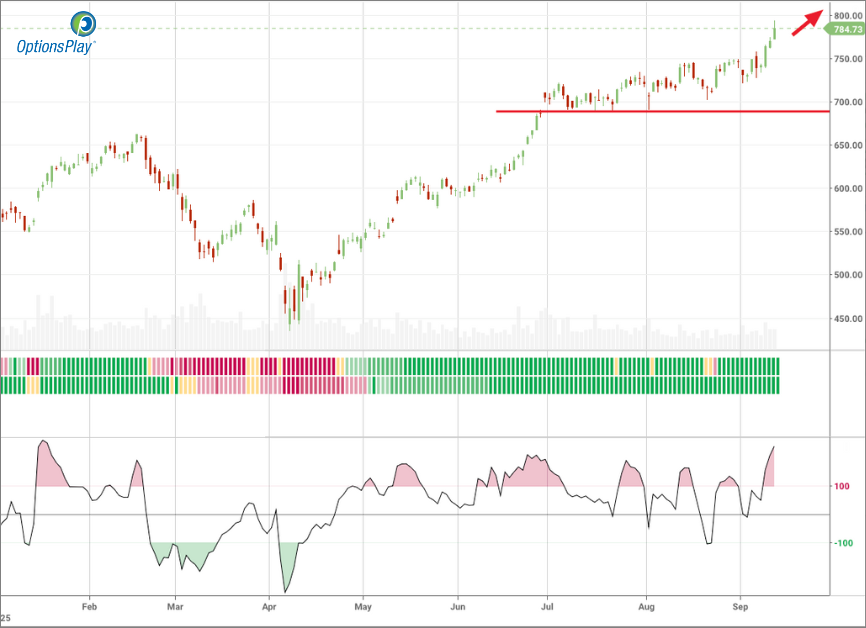
Goldman Sachs Group, Inc. (GS) – Our outlook remains bullish over the long term. A strengthening macroeconomic environment is expected to fuel growth in deal-making, lending, and trading activity, while potential changes in M&A regulation could reduce costs and accelerate approvals. Together, these factors support GS’s potential to generate solid returns as we head into the new year.
Adjustment Trade:
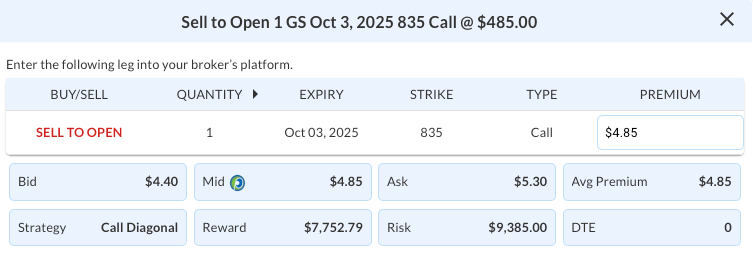
GS @ $784.73
Days to Expiration (DTE): 21
Sell to Open 1 Oct 3, 2025 835 Call @ $4.85
Mid: $4.85
Premium Received: $485.00 per call option sold
or $485 total adjustment in the cost basis for the position.
The total risk for the new position is $9,870 (original cost basis) minus $485 (net credit from the adjustment), resulting in a revised cost basis of $9,385.
Resulting Position:
Long 1 GS Jan 16, 2026 675 Call
Short 1 GS Oct 3, 2025 835 Call
New Cost Basis and total risk of $9,385
GS – Daily
Trade Details
Strategy Details
Strategy: Short Call
Direction: Resulting in a new Bullish Diagonal Spread
Details: Sell to Open 1 GS Oct 3 $835 Call @ $4.85 Credit.
Total Risk: The resulting position has a maximum risk of $9,385 (9,870-485), calculated as the initial cost basis of the long call ($9,870) minus the premium received from the adjustment ($485).
Trend Continuation Signal: This is a bullish trade on a stock that is expected to continue higher over the duration of the trade.
1M/6M Trends: Bullish/Bullish
Relative Strength: 9/10
Stop Loss: @ $46.93 (50% loss of premium)
Entering the Trade
Use the following details to enter the trade on your trading platform. Please note that whenever there is a multi-leg option strategy, it should be entered as a single trade.
PLEASE NOTE that these prices are based on Thursday’s closing prices. Should the underlying move significantly during the pre-market hours, we will likely adjust the strikes and prices to reflect a more accurate trade entry.
SPOT
DailyPlay – Opening Trade (SPOT) & Closing Trade (GILD, SNPS) – September 11, 2025
Closing Trade
- GILD – 41% gain: Buy to Close 5 Contracts (or 100% of your Contracts) Oct 10 $110/$105 Put Vertical Spreads @ $0.89 Debit. DailyPlay Portfolio: By Closing 5 Contracts, we will be paying $445. We initially opened these 5 contracts on August 29 @ $1.50 Credit. Our gain, therefore, is $305.
- SNPS – 92% loss: Sell to Close 1 Contract (or 100% of your Contracts) Oct 24 $610/$670 Call Vertical Spreads @ $1.67 Credit. DailyPlay Portfolio: By Closing 1 Contract, we will be collecting $167. We initially opened this contract on September 09 @ $20.70 Debit. Our loss, therefore, is $1,903 per contract.
SPOT Bearish Opening Trade Signal
Investment Rationale
Investment Thesis
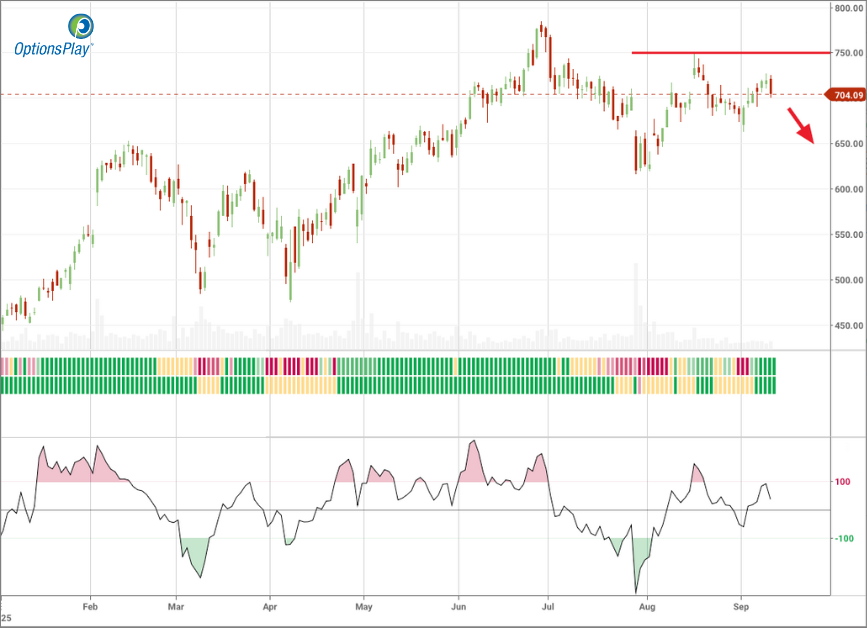
Spotify Technology (SPOT) has come under pressure following a disappointing Q2 2025 earnings report that underscored cracks in its growth execution and cost management. The stock, now trading near $704, sits meaningfully below its $785 peak, reflecting diminished investor confidence. While the company continues to benefit from strong brand recognition and a leading position in streaming, its premium valuation and weaker-than-expected profitability make it vulnerable to further downside. With revenue growth under scrutiny and cost efficiency challenges weighing on margins, risk/reward skews bearish at current levels.
Technical Analysis
SPOT’s price action shows clear rejection at the $750 resistance area, with subsequent selling pressure pushing shares back toward the 50- and 20-day moving averages. The stock is currently trading tightly around these levels, reflecting indecision but with a downside bias given the recent failure at the highs. It appears to be in a consolidation phase near the moving averages, and a break below the recently established $663 low could accelerate selling momentum, potentially driving the stock back toward the 200-day moving average.
Fundamental Analysis
Despite its strong market position, Spotify trades at a valuation that looks stretched relative to peers. Elevated expectations for growth have not been fully met, as evidenced by recent revenue and operating income misses. This raises questions about sustainability in a competitive landscape. Key valuation and profitability metrics include:
- Forward PE Ratio: 51.59x vs. Industry Median 21.29x
- Expected EPS Growth: 45.57% vs. Industry Median 13.75%
- Expected Revenue Growth: 17.59% vs. Industry Median 13.01%
- Net Margins: 4.72% vs. Industry Median 3.98%
Options Trade
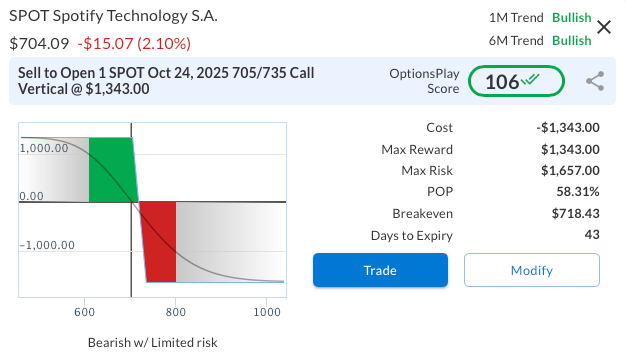
A defined-risk bearish strategy can be structured through a bear call vertical spread. Specifically, selling the SPOT October 24, 2025, 705/735 call vertical at $13.43 offers a maximum profit of $1,343 against a maximum risk of $1,657, equating to a risk/reward ratio of roughly 1.23:1. This setup benefits if SPOT remains below $705 at expiry. The trade provides a balanced profile, where the limited upside risk is manageable relative to the potential return, while time decay steadily works in favor of the short premium. Overall, this spread provides an efficient and disciplined way to express a bearish view.
SPOT – Daily
Trade Details
Strategy Details
Strategy: Short Call Vertical Spread
Direction: Bearish Credit Spread
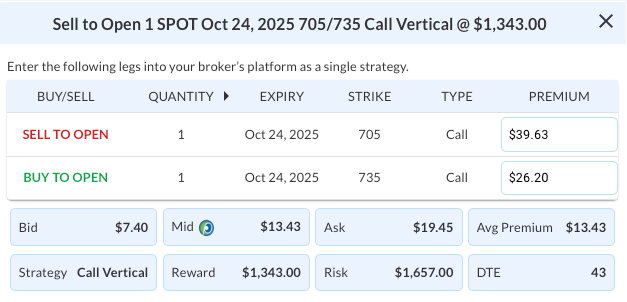
Details: Sell to Open 1 SPOT Oct 24 $705/$735 Call Vertical Spreads @ $13.43 Credit per Contract.
Total Risk: This trade has a max risk of $1,657 (1 Contract x $1,657) based on a hypothetical $100k portfolio risking 2%. We suggest risking only 2% of the value of your portfolio and divide it by $1,657 to select the # contracts for your portfolio.
Counter-Trend Signal: This is a bearish trade on a stock that is expected to continue lower over the duration of this trade.
1M/6M Trends: Bullish/Bullish
Relative Strength: 9/10
OptionsPlay Score: 106
Stop Loss: @ $26.86 (100% loss to value of premium)
View SPOT Trade
Entering the Trade
Use the following details to enter the trade on your trading platform. Please note that whenever there is a multi-leg option strategy, it should be entered as a single trade.
PLEASE NOTE that these prices are based on Wednesday’s closing prices. Should the underlying move significantly during the pre-market hours, we will likely adjust the strikes and prices to reflect a more accurate trade entry.
View SPOT Trade
$SBUX
DailyPlay – Closing Trade (SBUX) – September 10, 2025
Closing Trade
- SBUX – 50% gain: Buy to Close 5 Contracts (or 100% of your Contracts) Oct 17 $90/$95 Call Vertical Spreads @ $0.70 Debit. DailyPlay Portfolio: By Closing 5 Contracts, we will be paying $350. We initially opened these 5 contracts on September 04 @ $1.41 Credit. Our gain, therefore, is $355.