
WMT

DailyPlay – Opening Trade (WMT) – November 18, 2025
WMT Bearish Opening Trade Signal
Investment Rationale
Investment Thesis
Walmart Inc. is set to report earnings this Thursday, November 20, before the open, and the setup into the announcement skews negatively based on valuation and positioning. As noted in the Earnings Navigator section of this week’s trade ideas research report, Walmart is highlighted as Significantly Overvalued, leaving the stock exposed if results or guidance do not justify the current premium. With shares pricing in a high multiple relative to industry norms, the stock appears vulnerable to downside repricing as investors reassess growth durability and margin progression.
Technical Analysis
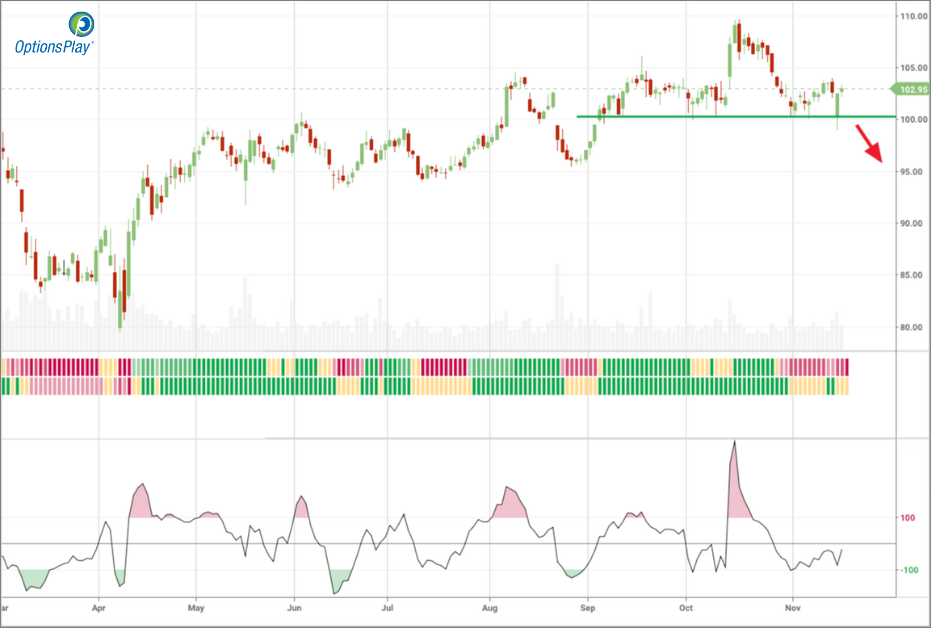
WMT continues to struggle for upside traction, with shares unable to hold above the short-term moving averages and drifting within a choppy consolidation range. The recent cross of the 20-day moving average below the 50-day moving average underscores a weakening momentum backdrop and signals building downside pressure. The 100 level has acted as support on five separate occasions since early October, yet each successive test has shown diminishing resilience. A clean break below 100 would likely confirm a transition into a more sustained bearish trend.
Fundamental Analysis
From a valuation and growth perspective, Walmart’s current premium leaves little room for disappointment. The stock trades well above sector norms, while its growth metrics are broadly in line with peers, limiting justification for the elevated multiple. Key comparative metrics include:
- Forward PE Ratio: 36.23x vs. Industry Median 17.96x
- Expected EPS Growth: 8.99% vs. Industry Median 9.02%
- Expected Revenue Growth: 4.19% vs. Industry Median 4.98%
- Net Margins: 2.75% vs. Industry Median 2.36%
Options Trade
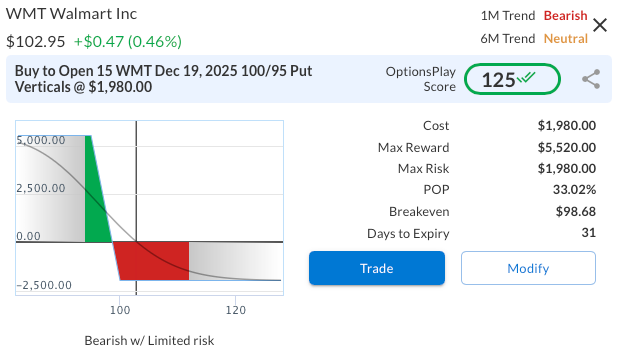
A bearish, defined-risk approach would be to initiate the WMT December 19, 2025 100/95 bear put vertical for a debit of roughly $1.32. This spread pairs a long 100 strike put with a short 95 strike put, forming a $5 wide spread. The maximum risk is limited to the $1.32 premium paid, while the maximum reward is $3.68 if WMT finishes at or below 95 at expiration. This creates a reward-to-risk ratio of approximately 2.8 to 1. The trade is designed to capitalize on a move lower into or following earnings and aligns with the broader bearish setup.
WMT – Daily
Trade Details
Strategy Details
Strategy: Long Put Vertical Spread
Direction: Bearish Debit Spread
Details: Buy to Open 15 WMT Dec 19 $100/$95 Put Vertical Spreads @ $1.32 Debit per Contract.
Total Risk: This trade has a max risk of $1,980 (15 Contracts x $132) based on a hypothetical $100k portfolio risking 2%. We suggest risking only 2% of the value of your portfolio and divide it by $132 to select the # contracts for your portfolio.
Trend Continuation Signal: This is a bearish trade on a stock that is expected to continue lower over the duration of this trade.
1M/6M Trends: Bearish/Neutral
Relative Strength: 5/10
OptionsPlay Score: 125
Stop Loss: @ $0.66 (50% loss of premium)
View WMT Trade
Entering the Trade
Use the following details to enter the trade on your trading platform. Please note that whenever there is a multi-leg option strategy, it should be entered as a single trade.

PLEASE NOTE that these prices are based on Monday’s closing prices. Should the underlying move significantly during the pre-market hours, we will likely adjust the strikes and prices to reflect a more accurate trade entry.
View WMT Trade

DailyPlay – Portfolio Review – November 17, 2025
DailyPlay Portfolio Review
Our Trades
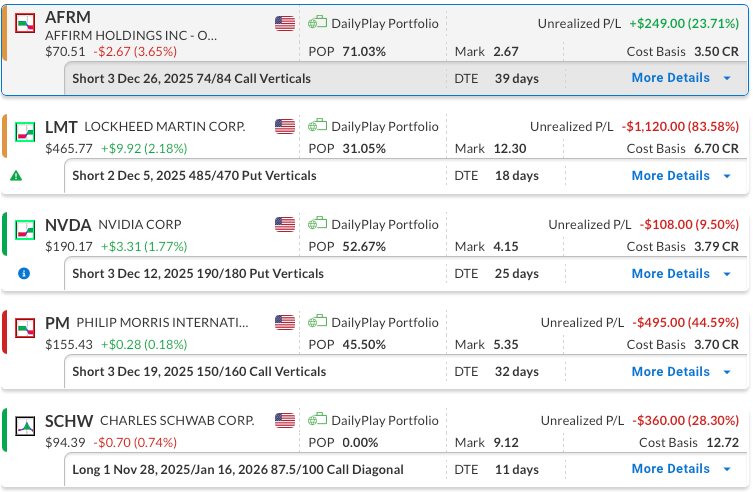
AFRM – 39 DTE
Bearish Credit Spread – Affirm Holdings Inc. (AFRM) – We recently established this position and plan to maintain it for now. Affirm reported solid Q3 results, with a beat on the top and bottom line, which helped move the stock higher initially. However, valuation remains a concern, as the stock trades at a high price-to-earnings ratio of 108.45x, raising questions about the durability of its long-term growth expectations.
LMT – 18 DTE
Bullish Credit Spread – Lockheed Martin Corp. (LMT) – This position gave up its recent gains following the company’s strong earnings report. The primary driver had been concerns over the US government shutdown, the longest in history, which led to delays in defense contracts, budget approvals, and payments for contractors like LMT. With the shutdown now over, the stock is building upside momentum, and we plan to hold the position, expecting that LMT could continue to rebound, though there is still some risk with expiration nearing.
NVDA – 25 DTE
Bullish Credit Spread – NVIDIA Corporation (NVDA) – We recently established this position and plan to maintain it for now. The company is set to report earnings on Wednesday, November 19, after the close.
PM – 32 DTE
Bearish Credit Spread – Philip Morris (PM) – our outlook remains bearish as transition growth slows, margins compress, and regulations tighten. The recent rally bumped against the 50-day moving average and then retreated, pointing to a potential near-term pullback. We will maintain the position in the short term with ample time until expiration.
SCHW – 11 DTE & 60 DTE
Bullish Diagonal Debit Spread – Charles Schwab Corp. (SCHW) – We remain bullish on the stock. After realizing gains on our initial long call, we rolled into a higher strike with a longer expiration and later sold a short-term out-of-the-money call to lower our cost basis. The short option’s expiration is approaching.
AFRM
DailyPlay – Opening Trade (AFRM) – November 14, 2025
AFRM Bearish Opening Trade Signal
Investment Rationale
Investment Thesis
Affirm Holdings faces mounting pressure as the macro backdrop for consumer credit weakens, creating a challenging environment for high-growth, high-valuation lenders. Rising delinquency rates, tightening household balance sheets, and persistent high interest costs heighten the risk that Affirm’s growth trajectory slows meaningfully from current levels. With the stock trading at a premium multiple despite decelerating fundamentals, the setup favors a bearish stance as the market reassesses forward expectations.
Technical Analysis
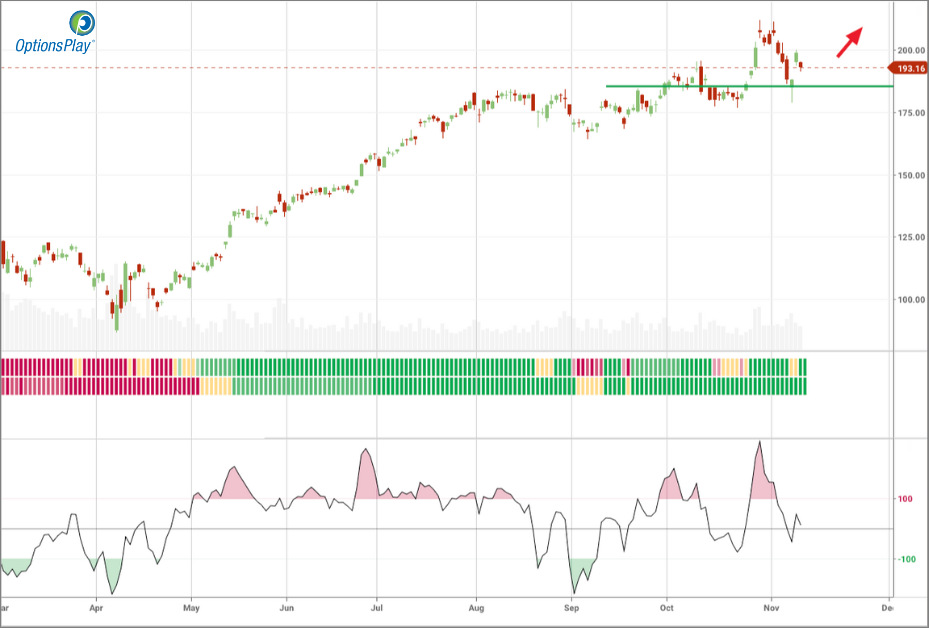
Price action reinforces the downside narrative, as AFRM continues to fail at the 50-day moving average. The stock has tested this level three times since October without breaking through, reflecting weakening momentum. This repeated rejection suggests growing vulnerability to a move toward the lower end of its multi-month range, possibly toward the 200-day moving average.
Fundamental Analysis
Despite strong headline growth metrics, AFRM’s valuation remains stretched relative to its industry, leaving little margin for error as credit conditions deteriorate. The company’s elevated forward earnings multiple and subpar profitability raise concerns about its ability to navigate a slowing consumer backdrop. Paired with rising delinquency trends and a higher cost of capital environment, AFRM’s risk-reward profile skews negative.
- Forward PE Ratio: 86.92x vs. Industry Median 23.37x
- Expected EPS Growth: 137.15% vs. Industry Median 12.25%
- Expected Revenue Growth: 23.95% vs. Industry Median 9.40%
- Net Margins: 6.74% vs. Industry Median 8.65%
Options Trade
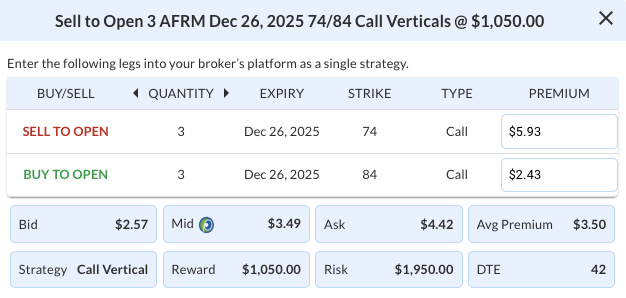
A defined-risk bearish position is structured through the December 26, 2025, 74/84 call credit spread, sold for a $3.50 credit. The spread offers a $6.50 maximum loss, creating a reward-to-risk ratio of 1:1.86. The trade benefits if AFRM remains below the $74 strike. Elevated option premiums, supported by high implied volatility, make selling call spreads appealing at these levels.
AFRM – Daily
Trade Details
Strategy Details
Strategy: Short Call Vertical Spread
Direction: Bearish Credit Spread
Details: Sell to Open 3 AFRM Dec 26 $74/$84 Call Vertical Spreads @ $3.50 Credit per Contract.
Total Risk: This trade has a max risk of $1,950 (3 Contracts x $650) based on a hypothetical $100k portfolio risking 2%. We suggest risking only 2% of the value of your portfolio and divide it by $650 to select the # contracts for your portfolio.
Trend Continuation Signal: This is a bearish trade on a stock that is expected to continue lower over the duration of this trade.
1M/6M Trends: Neutral/Neutral
Relative Strength: 9/10
OptionsPlay Score: 100
Stop Loss: @ $7.00 (100% loss to value of premium)
View AFRM Trade

Entering the Trade
Use the following details to enter the trade on your trading platform. Please note that whenever there is a multi-leg option strategy, it should be entered as a single trade.
PLEASE NOTE that these prices are based on Thursday’s closing prices. Should the underlying move significantly during the pre-market hours, we will likely adjust the strikes and prices to reflect a more accurate trade entry.
View AFRM Trade
MCHP, NEM

DailyPlay – Closing Trade (MCHP, NEM) – November 13, 2025
Closing Trade
- MCHP – 77% gain: Sell to Close 7 Contracts (or 100% of your Contracts) Dec 05 $60/$50 Put Vertical Spreads @ $4.70 Credit. DailyPlay Portfolio: By Closing 7 Contracts, we will be collecting $3,290. We initially opened these 7 contracts on November 05 @ $2.65 Debit. Our gain, therefore, is $1,435.
- NEM – 52% loss: Sell to Close 3 Contracts (or 100% of your Contracts) Nov 28 $94/$110 Call Vertical Spreads @ $2.67 Credit. DailyPlay Portfolio: By Closing 3 Contracts, we will be collecting $801. We initially opened these 3 contracts on October 21 @ $5.54 Debit. Our loss, therefore, is $287 per contract.
NVDA

DailyPlay – Opening Trade (NVDA) – November 12, 2025
NVDA Bullish Opening Trade Signal
Investment Rationale
Investment Thesis
NVIDIA Corporation (NVDA) remains the clear leader in the AI semiconductor space, continuing to drive innovation across data centers, GPUs, and AI infrastructure despite recent volatility. The company is set to report earnings on Wednesday, November 19, after the close, a key catalyst that could reignite momentum. Recently, SoftBank sold its entire 32.1 million-share position in NVDA, a stake worth approximately $5.8 billion, which temporarily weighed on the stock price and heightened short-term uncertainty. This large-scale divestment, however, has also driven implied volatility higher, creating attractive option premium opportunities for traders ahead of earnings. Despite the near-term selling pressure, NVDA’s long-term growth prospects, market dominance, and expanding AI ecosystem continue to justify a bullish outlook.
Technical Analysis
NVDA recently pulled back to retest support near $185, aligning with the prior breakout level and the 50-day moving average around $183. The stock’s broader uptrend remains intact, holding above the 20-, 50-, and 200-day moving averages, with buyers continuing to defend key support levels. The RSI near 48 suggests neutral momentum, allowing room for an upside move as the stock consolidates above its major averages.
Fundamental Analysis
NVDA continues to outperform the broader semiconductor industry with exceptional growth and profitability metrics. Its AI-driven business segments, led by robust data center demand and accelerating enterprise adoption, provide a strong foundation for sustained earnings expansion. Despite premium valuation multiples, NVDA’s forward growth profile supports the current market pricing, suggesting upside potential remains intact.
- Forward PE Ratio: 28.48x vs. Industry Median 26.41x
- Expected EPS Growth: 39.49% vs. Industry Median 18.61%
- Expected Revenue Growth: 37.54% vs. Industry Median 10.60%
- Net Margins: 52.41% vs. Industry Median 14.16%
Options Trade
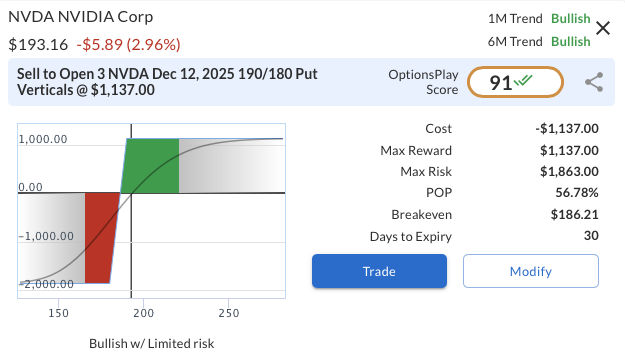
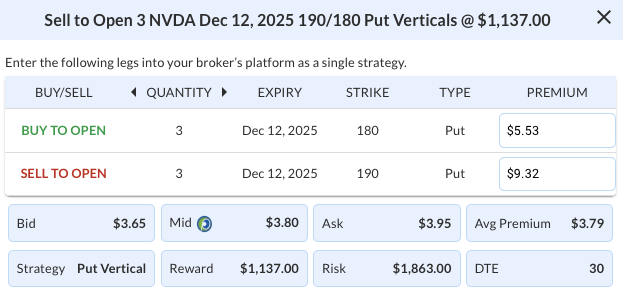
We are using a bull put vertical spread expiring December 12, 2025, selling the $190 put and buying the $180 put for a net credit of $3.79. This credit spread was selected due to the notable skew in the options chain following the recent SoftBank selloff, which drove implied volatility higher and created an attractive setup to execute an out-of-the-money put vertical with favorable pricing. The trade risks $621 to earn a maximum reward of $379, resulting in a reward-to-risk ratio of approximately 0.61:1 (or 61%). Elevated implied volatility enhances premium capture, while the defined structure limits downside exposure. This setup reflects a moderately bullish stance, anticipating NVDA will hold above $190 through expiration as the market refocuses on strong fundamentals post-earnings.
NVDA – Daily
Trade Details
Strategy Details
Strategy: Short Put Vertical Spread
Direction: Bullish Credit Spread
Details: Sell to Open 3 NVDA Dec 12 $190/$180 Put Vertical Spreads @ $3.79 Credit per Contract.
Total Risk: This trade has a max risk of $1,863 (3 Contracts x $621) based on a hypothetical $100k portfolio risking 2%. We suggest risking only 2% of the value of your portfolio and divide it by $621 to select the # contracts for your portfolio.
Trend Continuation Signal: This is a bullish trade on a stock that is expected to continue higher over the duration of this trade.
1M/6M Trends: Bullish/Bullish
Relative Strength: 9/10
OptionsPlay Score: 91
Stop Loss: @ $7.58 (100% loss to value of premium)
View NVDA Trade
Entering the Trade
Use the following details to enter the trade on your trading platform. Please note that whenever there is a multi-leg option strategy, it should be entered as a single trade.
PLEASE NOTE that these prices are based on Tuesday’s closing prices. Should the underlying move significantly during the pre-market hours, we will likely adjust the strikes and prices to reflect a more accurate trade entry.
View NVDA Trade
GS, AZN, BROS
DailyPlay – Closing Trade (GS, AZN, BROS) – November 11, 2025
Closing Trade
- GS – 40% gain: Sell to Close 1 Contract (or 100% of your Contracts) Jan 16 $675 Calls @ $131.25 Debit. DailyPlay Portfolio: By Closing 1 Contract, we will be collecting $13,125. We initially opened this contract on August 14 @ $98.70 Debit and reduced our cost basis to $93.85 Debit by selling a short call. Our gain, therefore, is $3,740.
- AZN – 53% gain: Sell to Close 7 Contracts (or 100% of your Contracts) Nov 21 $82.50/$90 Call Vertical Spreads @ $4.00 Credit. DailyPlay Portfolio: By Closing 7 Contracts, we will be collecting $2,800. We initially opened these 7 contracts on October 23 @ $2.61 Debit. Our gain, therefore, is $973.
- BROS – 33% loss: Sell to Close 5 Contracts (or 100% of your Contracts) Nov 21 $57.50/$47.50 Put Vertical Spreads @ $2.45 Credit. DailyPlay Portfolio: By Closing 5 Contracts, we will be collecting $1,225. We initially opened these 5 contracts on October 22 @ $3.67 Debit. Our loss, therefore, is $122 per contract.
DailyPlay – Portfolio Review – November 10, 2025
DailyPlay Portfolio Review
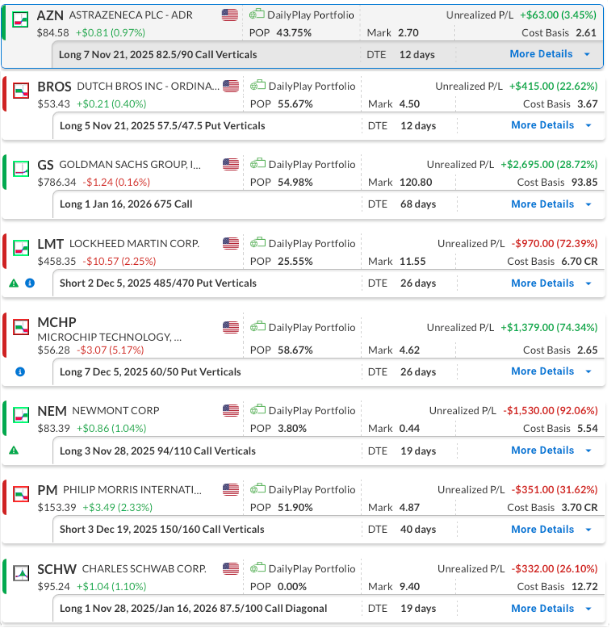
Our Trades
AZN – 12 DTE
Bullish Debit Spread – AstraZeneca PLC (AZN) – The company reported earnings last week, with strong Q3 2025 results. Top-line total revenue was up 11% YTD, supporting full-year high single-digit growth guidance. Bottom-line core EPS rose 15% to $7.04, aligning with low double-digit annual expectations. The position is at a slight gain, but expiration is nearing, so we may need to close early in the week.
BROS – 12 DTE
Bearish Debit Spread – Dutch Bros Inc. (BROS) – This position is showing a solid gain, and we plan to hold for now. The company reported earnings on Wednesday, November 5. Dutch Bros reported Q3 revenue up 25% YoY, with system same shop sales growth of 5.7% and company-operated same shop growth of 7.4%. Management raised 2025 revenue and comp guidance, reaffirmed the 2,029 shop goal by 2029, and highlighted strong early traction from its food program and digital initiatives. With expiration nearing, we may look to close early in the week.
GS – 68 DTE
Bullish Long Call, Goldman Sachs Group, Inc. (GS), we remain bullish on the stock. The cost basis has been reduced by selling a shorter-term call that expired worthless, and we may look to close and capture the gain in the near future as expiration is nearing. If we close in the short term, we may look to open a new longer-term position in GS at a later date.
LMT – 26 DTE
Bullish Credit Spread – Lockheed Martin Corp. (LMT) – This position gave up its recent gains following the company’s strong earnings report. The primary driver appears to be escalating concerns over the ongoing US government shutdown, the longest in history, which has led to delays in defense contracts, budget approvals, and payments for contractors like LMT. We plan to hold the position, expecting that if the shutdown is resolved, the stock could rebound from this week’s decline, though there is a risk we could be stopped out before that happens.
MCHP – 26 DTE
Bearish Debit Spread – Microchip Technology (MCHP) – We established this position ahead of last week’s earnings and plan to maintain it. Shares fell after Q3 results, which met revenue and beat EPS expectations, as weak Q4 guidance signaled ongoing weakness in the analog semiconductor sector.
NEM – 19 DTE
Bullish Debit Spread – Newmont Corporation (NEM) – The stock moved too quickly to the downside for us to close the position, as we only post closing trades overnight. The position is now showing nearly a 100% loss, but with many days still remaining until expiration, we will hold and hope for a recovery given the current situation.
PM – 40 DTE
Bearish Credit Spread – Philip Morris (PM) – Bearish Credit Spread – Philip Morris (PM) – The stock rallied last week on optimism for smoke-free products, but our outlook remains bearish as cigarette volumes decline, transition growth slows, margins compress, and regulations tighten. Technicals show overbought conditions and bearish patterns, indicating potential near-term pullbacks in a volatile sector. We will maintain the position in the short term, with ample time remaining until expiration.
SCHW – 19 DTE & 68 DTE
Bullish Diagonal Debit Spread – Charles Schwab Corp. (SCHW) – We remain bullish on the stock. After realizing gains on our initial long call, we rolled into a higher strike with a longer expiration and later sold a short-term out-of-the-money call to lower our cost basis.
PM
DailyPlay – Opening Trade (PM) – November 07, 2025
PM Bearish Opening Trade Signal
Investment Rationale
Investment Thesis
Philip Morris International (PM) continues to display structural weakness following its failed breakout attempts earlier this year and ongoing deterioration in momentum. The company’s premium valuation has become increasingly difficult to justify amid slowing profitability trends and mounting regulatory risks across global tobacco markets. With sentiment softening and price action confirming bearish control, PM presents an appealing opportunity for downside exposure targeting the $130 area. The risk/reward dynamic favors short-biased positioning as the stock remains under heavy technical pressure and faces limited near-term fundamental catalysts.
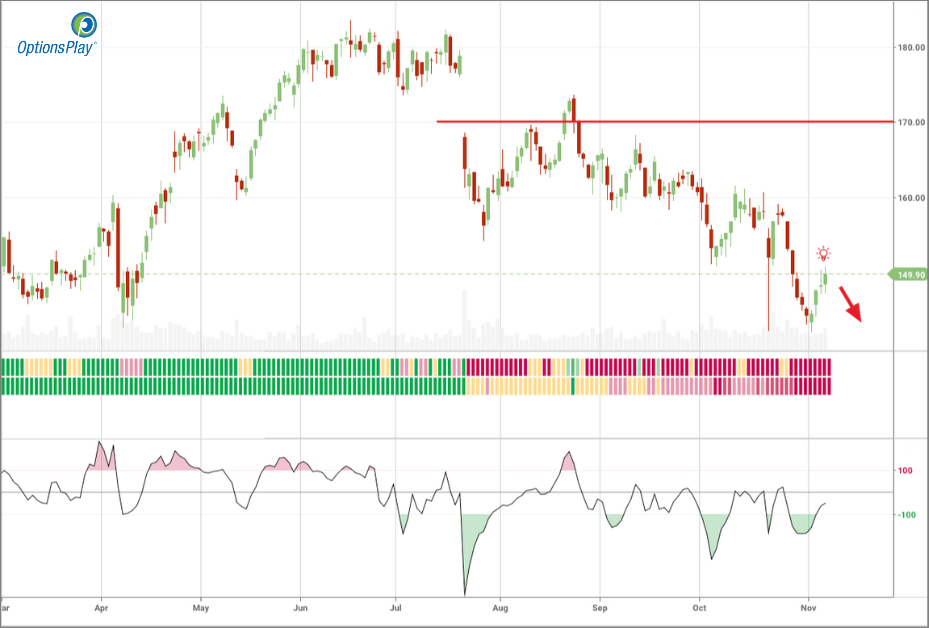
Technical Analysis
Philip Morris is now trading below its 20-day, 50-day, and 200-day moving averages, underscoring persistent bearish momentum. Both the 20-day and 50-day averages have recently crossed below the 200-day, forming a “death cross” pattern that reinforces the longer-term downtrend. RSI readings around 42 indicate weak but not yet oversold conditions, leaving room for additional downside without an imminent technical reversal. With the stock failing to reclaim any major moving averages, the path of least resistance remains lower, and the next key support zone lies near the $130 target area.
Fundamental Analysis
While Philip Morris maintains a leadership position in the global tobacco sector, its valuation premium over peers looks stretched given slowing profitability and ongoing regulatory challenges. Growth in smoke-free products provides some cushion, but compressed margins and limited operating leverage constrain upside potential.
- Forward PE Ratio: 17.26x vs. Industry Median 15.20x
- Expected EPS Growth: 11.56% vs. Industry Median 7.98%
- Expected Revenue Growth: 7.28% vs. Industry Median 3.74%
- Net Margins: 21.57% vs. Industry Median 32.47%
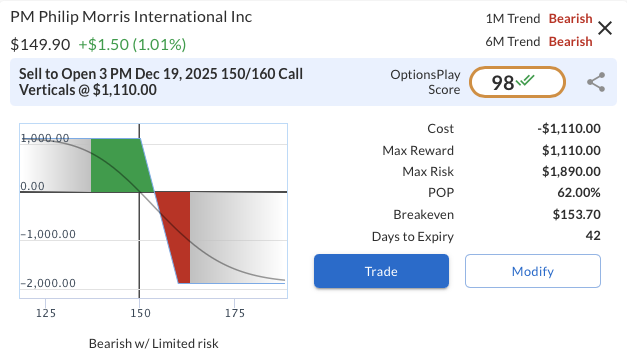
Options Trade
A defined-risk bearish strategy such as a call credit spread offers an efficient way to express a downside view. The proposed trade is to sell the Dec 19, 2025 $150 call and buy the $160 call for a net credit of $3.70. This structure yields a maximum profit of $370 if PM remains below $150 at expiration, with a maximum risk of $630 if PM rises above $160. The trade benefits from time decay and continued weakness below resistance, aligning with the technical setup targeting $130 and offering a favorable risk/reward profile for bearish exposure.
PM – Daily
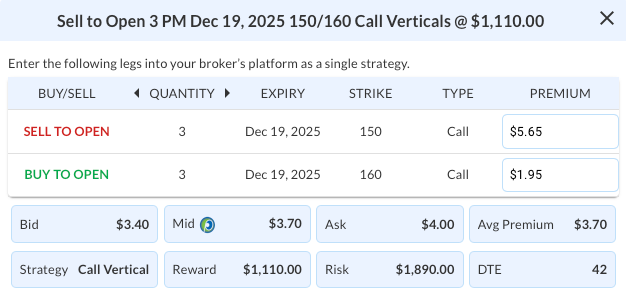
Trade Details
Strategy Details
Strategy: Short Call Vertical Spread
Direction: Bearish Credit Spread
Details: Sell to Open 3 PM Dec 19 $150/$160 Call Vertical Spreads @ $3.70 Credit per Contract.
Total Risk: This trade has a max risk of $1,890 (3 Contracts x $630) based on a hypothetical $100k portfolio risking 2%. We suggest risking only 2% of the value of your portfolio and divide it by $630 to select the # contracts for your portfolio.
Trend Continuation Signal: This is a bearish trade on a stock that is expected to continue lower over the duration of this trade.
1M/6M Trends: Bearish/Bearish
Relative Strength: 2/10
OptionsPlay Score: 98
Stop Loss: @ $7.40 (100% loss to value of premium)
View PM Trade
Entering the Trade
Use the following details to enter the trade on your trading platform. Please note that whenever there is a multi-leg option strategy, it should be entered as a single trade.
PLEASE NOTE that these prices are based on Thursday’s closing prices. Should the underlying move significantly during the pre-market hours, we will likely adjust the strikes and prices to reflect a more accurate trade entry.
View PM Trade
RIVN
DailyPlay – Closing Trade (RIVN) – November 06, 2025
Closing Trade
- RIVN – 73% loss: Sell to Close 11 Contracts (or 100% of your Contracts) Dec 05 $14 Puts @ $0.46 Credit. DailyPlay Portfolio: By Closing 11 Contracts, we will be collecting $506. We initially opened these 11 contracts on October 31 @ $1.71 Debit. Our loss, therefore, is $125 per contract.
MCHP
DailyPlay – Opening Trade (MCHP) – November 05, 2025
MCHP Bearish Opening Trade Signal
Investment Rationale
Investment Thesis
Microchip Technology Inc. (MCHP) is showing structural underperformance within the semiconductor sector, driven by both cyclical weakness and valuation pressure. The company reports earnings this Thursday, November 6th, after the close, which could act as a catalyst for further downside if results or guidance fail to justify its elevated valuation. While MCHP continues to deliver steady top-line growth, profitability pressures and weakening technical momentum suggest near-term risk outweighs potential reward. As investors favor higher-margin, AI-focused semiconductor names, Microchip’s relative weakness underscores its loss of leadership within the group. The recent break of key support levels reinforces a bearish outlook, positioning the stock for continued downside participation.
Technical Analysis
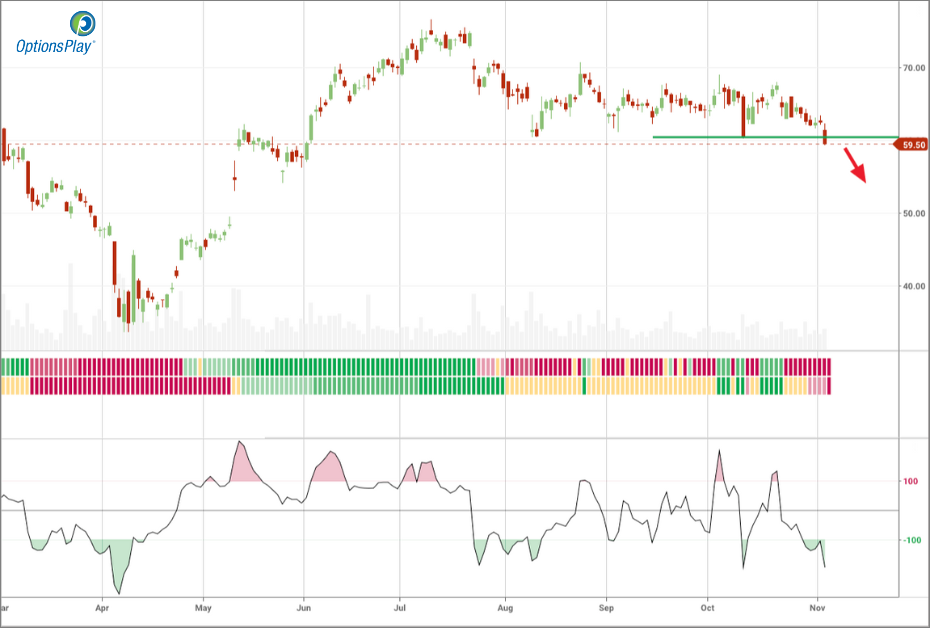
Since early August, the 200-day moving average around $60 has acted as key support, holding multiple times before the recent close below $59.50. Trading now beneath its 20-, 50-, and 200-day moving averages, all trending lower, MCHP shows clear bearish momentum. The RSI near 35 signals ongoing weakness but not yet oversold conditions, leaving room for further downside toward the next support area around $50.
Fundamental Analysis
Microchip’s valuation remains elevated relative to peers despite declining margins and slowing profitability. A premium multiple combined with negative net margins creates a challenging setup in a risk-averse environment. Without improvement in earnings quality, MCHP may continue to face valuation pressure and multiple contraction.
- Forward PE Ratio: 42.49x vs. Industry Median 26.41x
- Expected EPS Growth: 40.98% vs. Industry Median 18.61%
- Expected Revenue Growth: 14.54% vs. Industry Median 10.60%
- Net Margins: -3.50% vs. Industry Median 14.16%
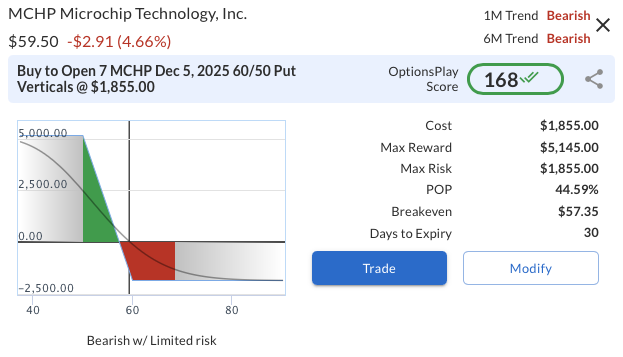
Options Trade
A bearish put vertical spread can be initiated using the Dec 5, 2025, $60/$50 strikes at a net debit of $2.65. This defined-risk position offers a maximum reward of $7.35 versus a maximum loss of $2.65, yielding a risk/reward ratio of approximately 2.8 to 1. The trade benefits from continued downside momentum, particularly if MCHP extends its decline below $60 following earnings, providing a limited-risk way to express a bearish view ahead of a potential volatility-driven move.
MCHP – Daily
Trade Details
Strategy Details
Strategy: Long Put Vertical Spread
Direction: Bearish Debit Spread
Details: Buy to Open 7 MCHP Dec 05 $60/$50 Put Vertical Spreads @ $2.65 Debit per Contract.
Total Risk: This trade has a max risk of $1,855 (7 Contracts x $265) based on a hypothetical $100k portfolio risking 2%. We suggest risking only 2% of the value of your portfolio and divide it by $265 to select the # contracts for your portfolio.
Trend Continuation Signal: This is a bearish trade on a stock that is expected to continue lower over the duration of this trade.
1M/6M Trends: Bearish/Bearish
Relative Strength: 7/10
OptionsPlay Score: 168
Stop Loss: @ $1.33 (50% loss of premium)
View MCHP Trade
Entering the Trade
Use the following details to enter the trade on your trading platform. Please note that whenever there is a multi-leg option strategy, it should be entered as a single trade.

PLEASE NOTE that these prices are based on Tuesday’s closing prices. Should the underlying move significantly during the pre-market hours, we will likely adjust the strikes and prices to reflect a more accurate trade entry.