
META

DailyPlay – Opening Trade (META) – October 07, 2025
META Bullish Opening Trade Signal
Investment Rationale
Investment Thesis
Meta Platforms (META) presents a compelling bullish setup as the stock consolidates near prior breakout levels following a year of strong relative performance. Despite the recent market-wide pullback in large-cap technology, META remains well-positioned through its dominance in digital advertising and accelerating growth in AI-driven monetization. The upcoming October 29 earnings announcement—scheduled before the trade’s expiration—acts as a potential upside catalyst, with continued efficiency gains and margin expansion supporting a long-term target near $900.
Technical Analysis
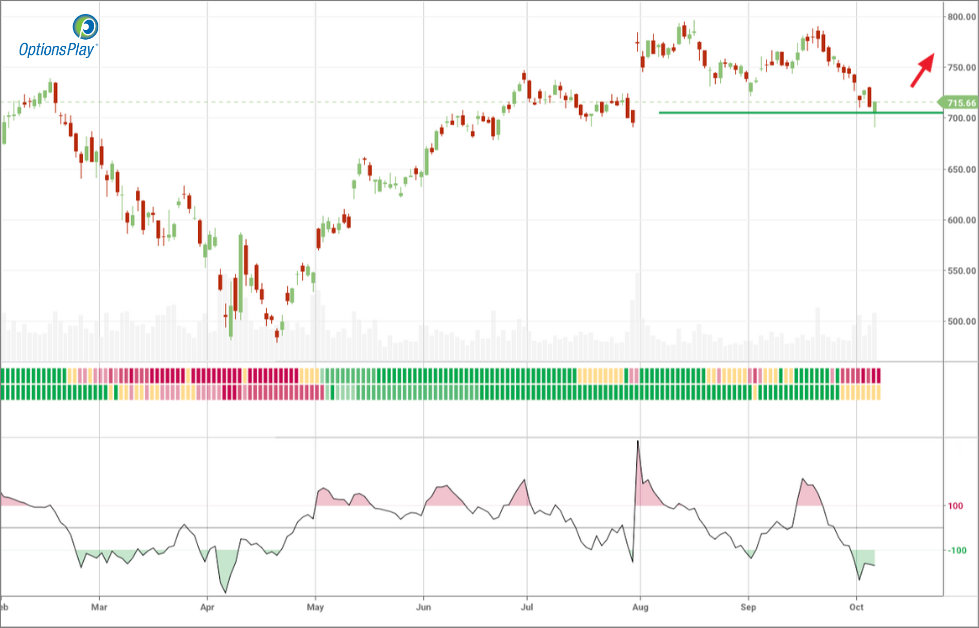
META has retraced modestly after a strong advance earlier this year, finding firm support near the $700 level, which aligns with its prior breakout zone from the summer. The stock continues to trade comfortably above its 200-day moving average around $667, confirming the prevailing long-term uptrend despite recent volatility. Meanwhile, the 20-day and 50-day moving averages have begun to stabilize, suggesting a period of consolidation that may precede the next upward move.
Fundamental Analysis
META’s valuation remains compelling given its superior profitability and growth relative to peers. Despite trading at a modest premium to the sector, its expanding margins and strong top-line momentum highlight the strength of its business model and future cash flow potential.
- Forward PE Ratio: 23.79x vs. Industry Median 21.56x
- Expected EPS Growth: 11.57% vs. Industry Median 14.25%
- Expected Revenue Growth: 16.33% vs. Industry Median 12.95%
- Net Margins: 39.99% vs. Industry Median 3.98%
Options Trade
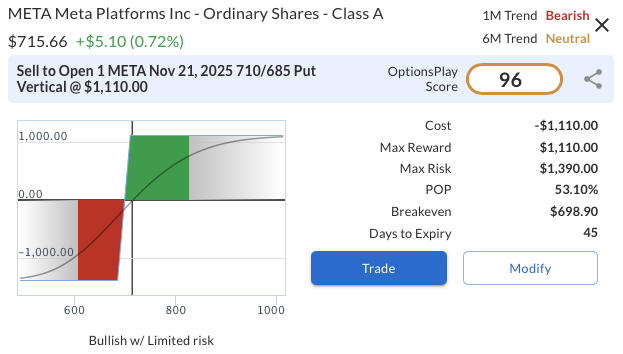
The proposed trade is a bullish put vertical spread, selling the META Nov 21, 2025 710/685 put spread for a credit of $11.10. This position profits if META remains above $710 at expiration, collecting a maximum reward of $1,110 against a defined risk of $1,390. With the earnings event occurring before expiration, implied volatility is elevated, enhancing the credit received. The structure provides a favorable risk/reward ratio of 1:1.25, allowing traders to express a bullish stance while maintaining a defined downside if META experiences temporary post-earnings weakness.
META – Daily
Trade Details
Strategy Details
Strategy: Short Put Vertical Spread
Direction: Bullish Credit Spread
Details: Sell to Open 1 META Nov 21 $710/$685 Put Vertical Spreads @ $11.10 Credit per Contract.
Total Risk: This trade has a max risk of $1,390 (1 Contract x $1,390) based on a hypothetical $100k portfolio risking 2%. We suggest risking only 2% of the value of your portfolio and divide it by $1,390 to select the # contracts for your portfolio.
Trend Continuation Signal: This is a bullish trade on a stock that is expected to continue higher over the duration of this trade.
1M/6M Trends: Bearish/Neutral
Relative Strength: 7/10
OptionsPlay Score: 96
Stop Loss: @ $22.20 (100% loss to value of premium)
View META Trade
Entering the Trade
Use the following details to enter the trade on your trading platform. Please note that whenever there is a multi-leg option strategy, it should be entered as a single trade.
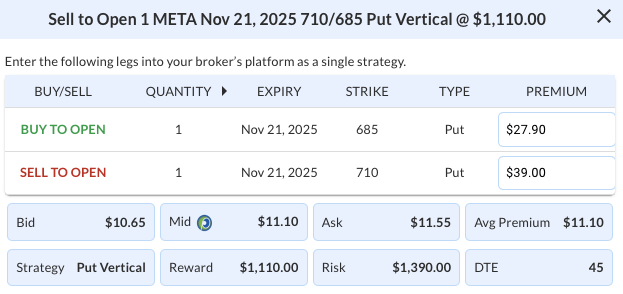
PLEASE NOTE that these prices are based on Monday’s closing prices. Should the underlying move significantly during the pre-market hours, we will likely adjust the strikes and prices to reflect a more accurate trade entry.
View META Trade

DailyPlay – Portfolio Review – October 06, 2025
DailyPlay Portfolio Review
Our Trades
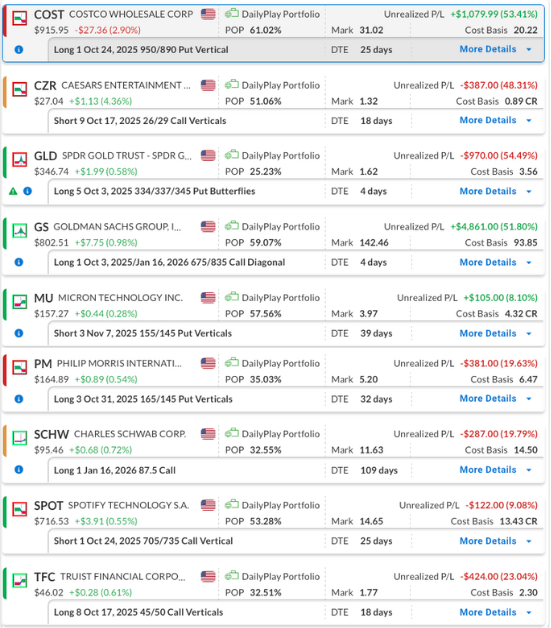
COST – 18 DTE
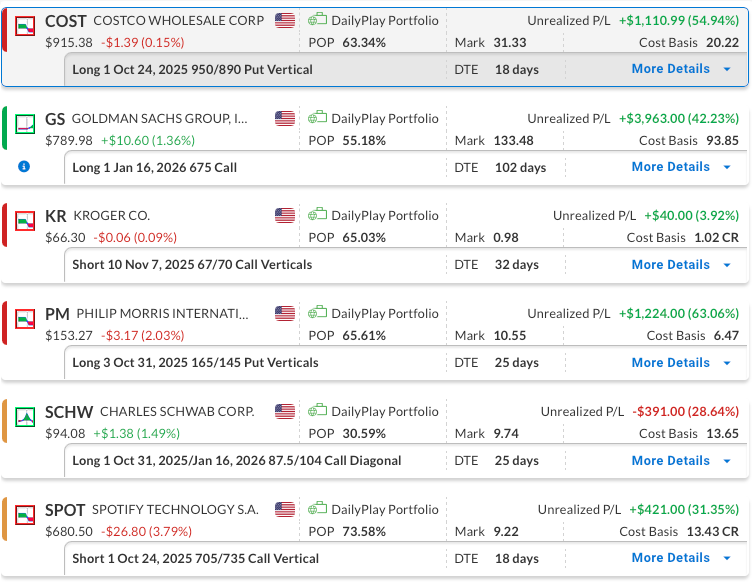
Bearish Debit Spread – Costco Wholesale Corporation (COST) – The position remains profitable, with continued downside momentum last week driven by a mixed consumer environment and renewed tariff concerns. We plan to maintain the position for now.
GS – 102 DTE
Bullish Diagonal Debit Spread – Goldman Sachs Group, Inc. (GS) – We maintain a longer-term bullish outlook and plan to continue holding this position. To reduce the cost basis, we sold a short-term out-of-the-money call that expired last week, and the setup remains favorable.
KR – 32 DTE
Bearish Credit Spread – The Kroger Co. (KR) – We recently established this position and we plan to stay the course for now.
PM – 25 DTE
Bearish Put Debit Spread – Philip Morris International Inc. (PM) – This newly opened and profitable position continued to trend lower last week, reinforcing our bearish outlook. We plan to keep the position in place for now.
SCHW – 25 DTE & 102 DTE
Bullish Diagonal Debit Spread – Charles Schwab Corp. (SCHW) – The outlook remains unchanged from last week. We continue to hold a bullish view on Schwab. After realizing gains from our initial long call, we rolled into a higher strike call with a later expiration. To reduce the cost basis, we recently sold a short-term OTM call against the long position.
SPOT – 18 DTE
Bearish Credit Spread – Spotify Technology (SPOT) – We recently established this position, and it is currently showing a gain. Bearish momentum is building, and with plenty of time until expiration, we plan to stay the course for now.
MU, TFC

DailyPlay – Closing Trade (MU, TFC) – October 03, 2025
Closing Trade
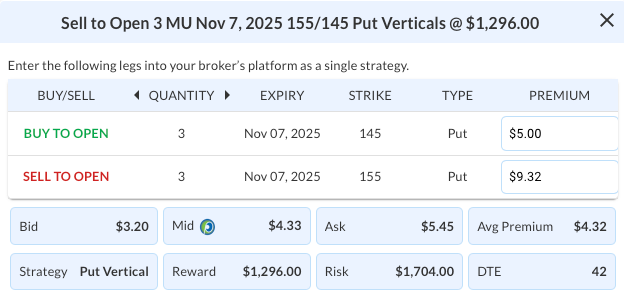
- MU – 72% gain: Buy to Close 3 Contracts (or 100% of your Contracts) Nov 07 $155/$145 Put Vertical Spreads @ $1.22 Debit. DailyPlay Portfolio: By Closing 3 Contracts, we will be paying $366. We initially opened these 3 contracts on September 26 @ $4.32 Credit. Our gain, therefore, is $930.
- TFC – 43% loss: Sell to Close 8 Contracts (or 100% of your Contracts) Oct 17 $45/$50 Call Vertical Spreads @ $1.30 Credit. DailyPlay Portfolio: By Closing 8 Contracts, we will be collecting $1,040. We initially opened these 8 contracts on September 03 @ $2.30 Debit. Our loss, therefore, is $100 per contract.
KR

DailyPlay – Opening Trade (KR) – October 02, 2025
KR Bearish Opening Trade Signal
Investment Rationale
Investment Thesis
Kroger Co. (KR) may screen attractively on valuation, but the stock is increasingly shaping up as a value trap. Weak growth expectations, thin margins, and underperformance relative to industry peers reinforce the case for a bearish stance. The current environment offers a timely entry for traders looking to take advantage of the stock’s deteriorating momentum.
Technical Analysis
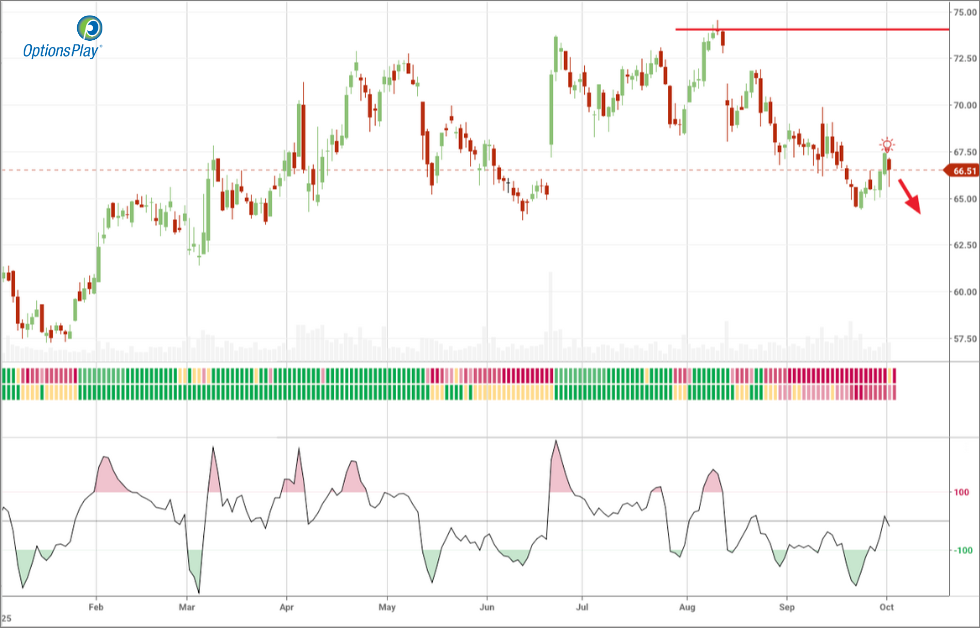
Price action confirms the bearish bias, with KR recently breaking below its 200-day moving average after the 20-day crossed beneath it, signaling weakening momentum. Notably, inside the OptionsPlay platform, a “CCI Rally in Bearish Trend” alert was generated yesterday, highlighting that while the stock remains in a bearish trend, a short-term rally has occurred, a solid entry point for a bearish trade. KR currently trades below both the 50-day and 200-day moving averages, with each trending lower and reinforcing the negative technical structure. The bounce stalled near the 50-day moving average, suggesting sellers are regaining control. With RSI at 45, momentum is neutral but lacks signs of reversal, leaving room for continued downside pressure.
Fundamental Analysis
On the surface, Kroger’s discounted valuation might appear compelling, but the underlying fundamentals show why the stock remains vulnerable. Slower growth, margin compression, and below-median profitability highlight a business under pressure. This disconnect reinforces the idea that KR is cheap for a reason, supporting the bearish view.
- Forward PE Ratio: 12.65x vs. Industry Median 17.24x
- Expected EPS Growth: 7.78% vs. Industry Median 9.86%
- Expected Revenue Growth: 2.20% vs. Industry Median 2.20%
- Net Margins: 1.86% vs. Industry Median 2.25%
Options Trade
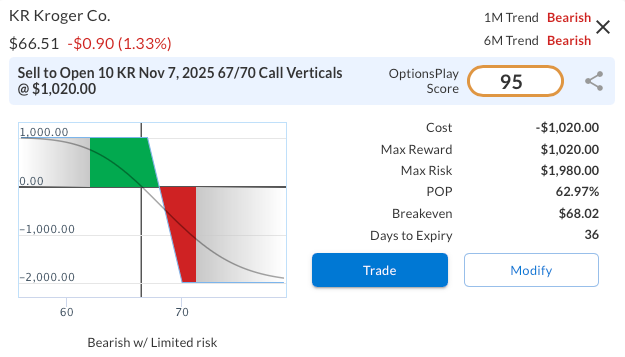
A bearish position can be expressed with a KR Nov 7, 2025, $67/$70 Call Credit Spread at a net credit of $1.02. This trade risks $198 to make a maximum profit of $102, offering a 51.5% return on risk if KR stays at or below $67 at expiration. Selling the $67 strike call while buying the $70 call caps the upside exposure while generating income from the premium.
KR – Daily
Trade Details
Strategy Details
Strategy: Short Call Vertical Spread
Direction: Bearish Credit Spread
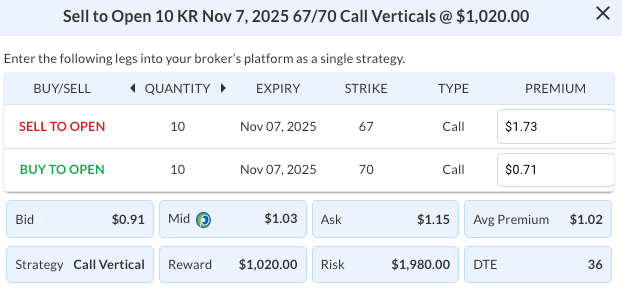
Details: Sell to Open 10 KR Nov 07 $67/$70 Call Vertical Spreads @ $1.02 Credit per Contract.
Total Risk: This trade has a max risk of $1,980 (10 Contracts x $198) based on a hypothetical $100k portfolio risking 2%. We suggest risking only 2% of the value of your portfolio and divide it by $198 to select the # contracts for your portfolio.
Trend Continuation Signal: This is a bearish trade on a stock that is expected to continue lower over the duration of this trade.
1M/6M Trends: Bearish/Bearish
Relative Strength: 2/10
OptionsPlay Score: 95
Stop Loss: @ $2.04 (100% loss to value of premium)
View KR Trade
Entering the Trade
Use the following details to enter the trade on your trading platform. Please note that whenever there is a multi-leg option strategy, it should be entered as a single trade.
PLEASE NOTE that these prices are based on Wednesday’s closing prices. Should the underlying move significantly during the pre-market hours, we will likely adjust the strikes and prices to reflect a more accurate trade entry.
View KR Trade
$SCHW
DailyPlay – Adjusting Trade (SCHW) – October 01, 2025
SCHW Bullish Trade Adjustment Signal
Investment Rationale
Adjustment Rationale:
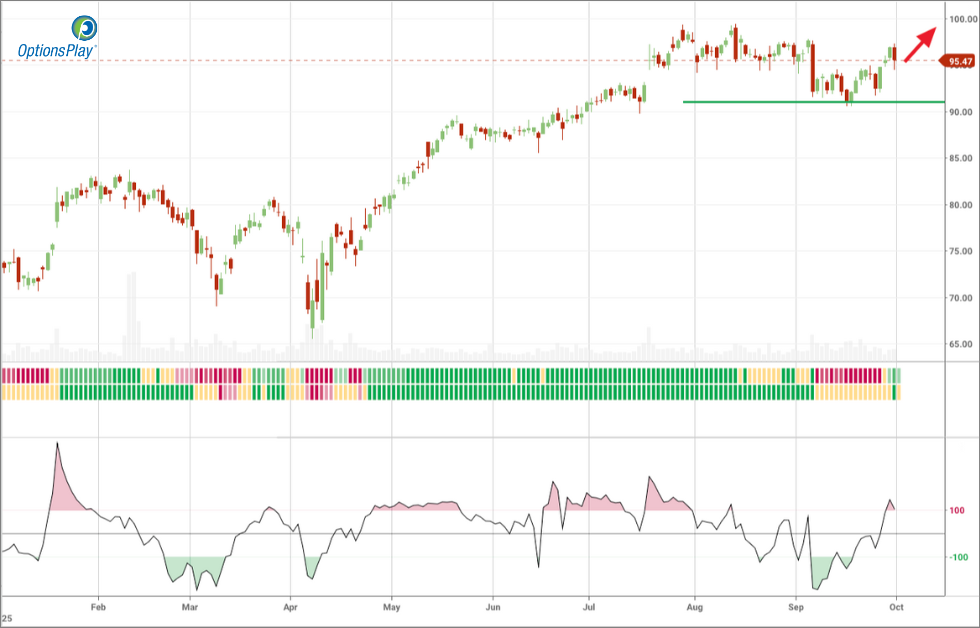
We continue to hold a positive outlook on Schwab, while remaining bullish but cautious in the short term given the risks tied to the recent government shutdown. After our initial long call, we locked in gains and rolled into a higher strike call with a later expiration. Today, we are selling calls to reduce risk in the near term. Its valuation metrics suggest relative attractiveness amid robust growth projections. $SCHW stands out with attractive multiples, steady growth, and momentum. Supported by consistent earnings beats over the last four quarters, Charles Schwab Corporation is set to report Q3 earnings on Thursday, October 16th, before the open.
Adjustment Trade:
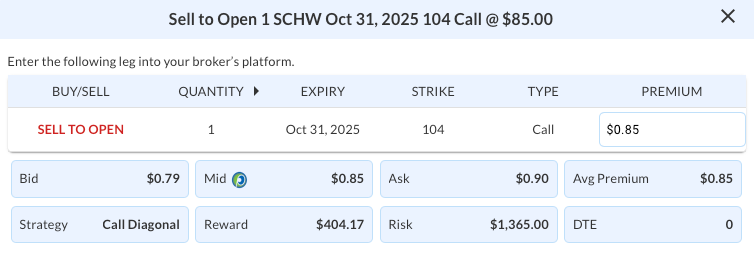
SCHW @ $95.47
Days to Expiration (DTE): 30
Sell to Open 1 SCHW Oct 31, 2025 104 Call @ $0.85
Mid: $0.85
Premium Received: $85.00 per call option sold
or $85 total adjustment in the cost basis for the position.
The total risk for the new position is $1,450 (original cost basis) minus $85 (net credit from the adjustment), resulting in a revised cost basis of $1,365.
Resulting Position:
Long 1 SCHW Jan 16, 2026 87.5 Call
Short 1 SCHW Oct 31, 2025 104 Call
New cost Basis and total risk of $1,365
SCHW – Daily
Trade Details
Strategy Details
Strategy: Short Call
Direction: Resulting in a new Bullish Diagonal Spread
Details: Sell to Open 1 SCHW Oct 31 $104 Call @ $0.85 Credit.
Total Risk: The resulting position has a maximum risk of $1,365 (1,450-85), calculated as the initial cost basis of the long call ($1,450) minus the premium received from the adjustment ($85).
Trend Continuation Signal: This is a bullish trade on a stock that is expected to continue higher over the duration of the trade.
1M/6M Trends: Mildly Bullish/Neutral
Relative Strength: 8/10
Stop Loss: @ $6.83 (50% loss of premium)
Entering the Trade
Use the following details to enter the trade on your trading platform. Please note that whenever there is a multi-leg option strategy, it should be entered as a single trade.
PLEASE NOTE that these prices are based on Tuesday’s closing prices. Should the underlying move significantly during the pre-market hours, we will likely adjust the strikes and prices to reflect a more accurate trade entry.
CZR, GLD
DailyPlay – Closing Trade (CZR, GLD) – September 30, 2025
Closing Trade
- CZR – 78% loss: Buy to Close 9 Contracts (or 100% of your Contracts) Oct 17 $26/$29 Call Vertical Spreads @ $1.58 Debit. DailyPlay Portfolio: By Closing 9 Contracts, we will be paying $1,422. We initially opened these 9 contracts on September 23 @ $0.89 Credit. Our loss, therefore, is $69 per contract.
- GLD – 88% loss: Sell to Close 5 Contracts (or 100% of your Contracts) Oct 03 $334/$337/$345 Put Butterfly Spreads @ $0.42 Credit. DailyPlay Portfolio: By Closing 5 Contracts, we will be collecting $210. We initially opened these 5 contracts on September 18 @ $3.56 Debit. Our loss, therefore, is $314 per contract.
DailyPlay – Portfolio Review – September 29, 2025
DailyPlay Portfolio Review
Our Trades
COST – 25 DTE
Bearish Debit Spread – Costco Wholesale Corporation (COST) – The trade is currently profitable. Costco’s fourth quarter report showed US same-store sales fell short of forecasts, pressured by a mixed consumer backdrop and tariff concerns. We intend to hold the position at this time.
CZR – 18 DTE
Spread – Caesars Entertainment, Inc. (CZR) – The trade is currently showing a loss. We are not yet at the stop-loss level, but bearish momentum needs to build to justify staying in the position. The stock showed upside movement last week, though the fundamentals remain weak.
GLD – 4 DTE
Bearish Butterfly – SPDR Gold Shares (GLD) – The outlook remains the same as last week. If you have not closed the position yet, we will take the same approach this week. We maintain a neutral to bearish stance on GLD. With expiration approaching and the position currently showing a loss, it is reasonable to exit at any time. For now, we will hold and be prepared to close early in the week. The strategy benefits if GLD moves to 337, the middle strike of the butterfly, or lower. Monitor the position closely and close during the day if an opportunity arises to lock in gains or if the stop loss level is reached. Expect profit and loss to remain volatile with expiration near.
GS – 4 DTE & 109 DTE
Bullish Diagonal Debit Spread – Goldman Sachs Group, Inc. (GS) – We maintain a longer-term bullish outlook and plan to continue holding this position. To reduce the cost basis, we sold a short-term OTM call against the long position, and with expiration approaching on the short call, the setup remains favorable.
MU – 39 DTE
Bullish Credit Spread – Micron Technology, Inc. (MU) – We recently established this position, it is currently showing a gain, and we plan to stay the course for now.
PM – 32 DTE
Bearish Put Debit Spread – Philip Morris International Inc. (PM) – We recently established this position, it is showing a slight loss, and we plan to stay the course for now.
SCHW – 109 DTE
Bullish Long Call – Charles Schwab Corp. (SCHW) – The outlook remains the same as last week. We maintain our bullish view on Schwab. After our initial long call, we captured the gain and rolled into a higher strike call with a later expiration. We may sell calls to reduce risk if we get an appropriate move to the upside.
SPOT – 25 DTE
Bearish Credit Spread – Spotify Technology (SPOT) – We recently established this position, and it is currently showing a gain. Bearish momentum is building, and with plenty of time until expiration, we plan to stay the course for now.
TFC – 18 DTE
Bullish Debit Spread – Truist Financial Corporation (TFC) – The position is showing a loss, but we plan to stay the course for now and keep a close eye on it as expiration approaches.
MU
DailyPlay – Opening Trade (MU) – September 26, 2025
MU Bullish Opening Trade Signal
Investment Rationale
Investment Thesis
Micron Technology (MU) delivered a strong Q4 FY2024 earnings report that significantly exceeded expectations, reinforcing the view that the company is well-positioned to capitalize on secular growth trends in AI and data center demand. Revenue surged both sequentially and year-over-year, marking a decisive turnaround in the memory cycle. The return to profitability, coupled with strong balance sheet positioning, highlights Micron’s ability to weather cyclical volatility while benefiting from structural growth drivers. With shares recently breaking out to multi-year highs, MU presents a compelling opportunity for continued upside participation in the semiconductor industry.
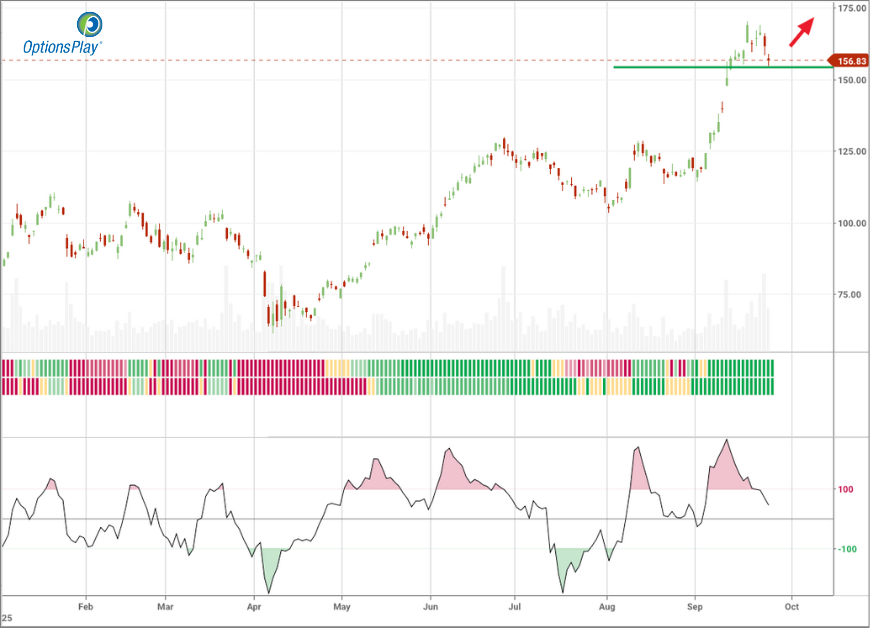
Technical Analysis
MU’s price action showed strong bullish momentum heading into earnings, and while the stock has retraced modestly afterward, it continues to hold firmly above all major moving averages. The 20-day and 50-day averages remain in clear uptrends and sit well above the 200-day, reinforcing the strength of the longer-term move. The pullback from the $170 area looks constructive, allowing the stock to consolidate gains within a solid uptrend. Support is now defined near $156, and a decisive break above recent highs could set the stage for an advance toward the $175 zone.
Fundamental Analysis
Micron’s latest results demonstrate its undervaluation relative to peers despite superior growth and profitability metrics. Strength in data center and NAND demand, driven by AI adoption, underpins forward growth visibility, while the company’s balance sheet supports ongoing dividends and reinvestment. The stock remains substantially discounted on earnings multiples, suggesting further rerating potential.
- Forward PE Ratio: 12.19x vs. Industry Median 23.11x
- Expected EPS Growth: 17.88% vs. Industry Median 17.39%
- Expected Revenue Growth: 12.82% vs. Industry Median 10.87%
- Net Margins: 22.85% vs. Industry Median 11.78%
Options Trade
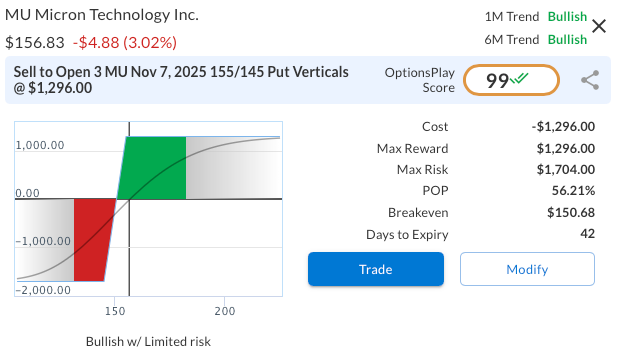
A bullish trade idea is selling the MU Nov 7, 2025, $155/$145 put vertical spread for a $4.32 credit. This trade collects $432 in premium while capping risk at $568, producing a favorable risk/reward profile of about 0.76 to 1. The breakeven sits at $150.68, allowing the position to work as long as MU stays above that level or continues higher.
MU – Daily
Trade Details
Strategy Details
Strategy: Short Put Vertical Spread
Direction: Bullish Credit Spread
Details: Sell to Open 3 MU Nov 07 $155/$145 Put Vertical Spreads @ $4.32 Credit per Contract.
Total Risk: This trade has a max risk of $1,704 (3 Contracts x $568) based on a hypothetical $100k portfolio risking 2%. We suggest risking only 2% of the value of your portfolio and divide it by $568 to select the # contracts for your portfolio.
Trend Continuation Signal: This is a bullish trade on a stock that is expected to continue higher over the duration of this trade.
1M/6M Trends: Bullish/Bullish
Relative Strength: 10/10
OptionsPlay Score: 99
Stop Loss: @ $8.64 (100% loss to value of premium)
View MU Trade
Entering the Trade
Use the following details to enter the trade on your trading platform. Please note that whenever there is a multi-leg option strategy, it should be entered as a single trade.
PLEASE NOTE that these prices are based on Thursday’s closing prices. Should the underlying move significantly during the pre-market hours, we will likely adjust the strikes and prices to reflect a more accurate trade entry.
View MU Trade
COST
DailyPlay – Opening Trade (COST) – September 25, 2025
COST Bearish Opening Trade Signal
Investment Rationale
Investment Thesis
Costco (COST) has been highlighted in this week’s Earnings Navigator as a stock to watch ahead of its fiscal fourth-quarter results, set to be released after today’s close. While the company’s long-term fundamentals remain strong and analysts argue that its results are sustainable, investors should be mindful of the near-term risks. Growth metrics earlier this year hinted at deceleration, and with Costco trading at an elevated valuation relative to its peers, the stock could be vulnerable to downside pressure if earnings disappoint. This setup creates an opportunity to position bearishly into earnings volatility with a defined-risk options strategy.
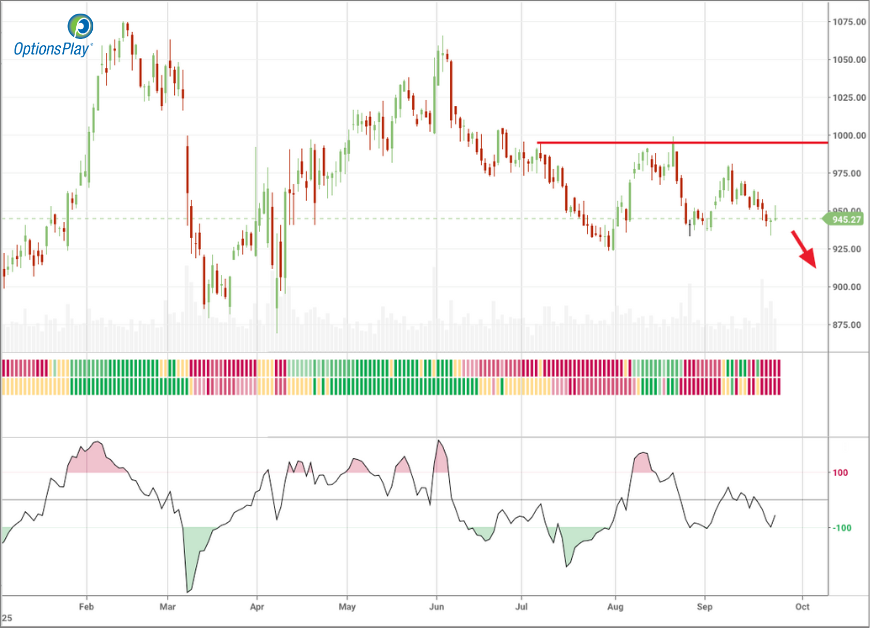
Technical Analysis
COST shares are trading near $945, stuck below key resistance levels with clear signs of weakening momentum. The stock remains just below the 20-day moving average and the 50-day moving average, both of which are trending lower. Meanwhile, the longer-term 200-day moving average at $975 continues to act as overhead resistance, reinforcing the bearish bias. In August, the 50-day moving average crossed below the 200-day moving average, forming a death cross, a bearish technical signal that often confirms a trend of sustained weakness. More recently, the stock rallied back to the 200-day moving average but failed to break out, and since that rejection has been carving a series of lower highs and lower lows. The RSI sits at 43.77, in neutral-to-weak territory, leaving room for additional downside pressure if earnings fail to provide a catalyst.
Fundamental Analysis
Costco’s premium valuation reflects investor confidence, but it also leaves little margin for error should earnings come in light of expectations. Relative to industry benchmarks, Costco trades at significantly higher multiples, which may amplify downside in the event of weaker guidance.
- Forward PE Ratio: 47.12x vs. Industry Median 18.43x
- Expected EPS Growth: 10.27% vs. Industry Median 10.27%
- Expected Revenue Growth: 7.61% vs. Industry Median 5.16%
- Net Margins: 2.92% vs. Industry Median 2.25%
Options Trade
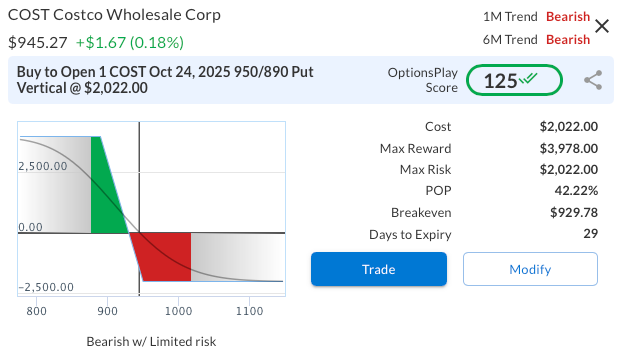
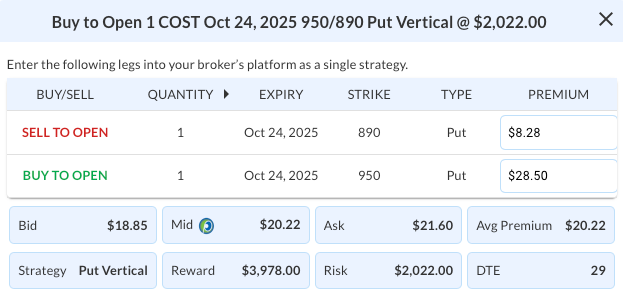
To position for potential downside while maintaining defined risk, we recommend a 950/890 Bear Put Vertical Spread expiring Oct 24, 2025, entered at a net debit of $20.22 ($2,022 total). The trade risks $2,022 to achieve a maximum potential reward of $3,978 if shares close below $890 at expiry. Structuring the trade this way allows for a favorable risk/reward profile (nearly 2:1) while avoiding the high implied volatility premiums of outright long puts. This spread benefits from a decisive move lower following earnings but limits losses should Costco surprise to the upside.
COST – Daily
Trade Details
Strategy Details
Strategy: Long Put Vertical Spread
Direction: Bearish Debit Spread
Details: Buy to Open 1 COST Oct 24 $950/$890 Put Vertical Spreads @ $20.22 Debit per Contract.
Total Risk: This trade has a max risk of $2,022 (1 Contract x $2,022) based on a hypothetical $100k portfolio risking 2%. We suggest risking only 2% of the value of your portfolio and divide it by $2,022 to select the # contracts for your portfolio.
Trend Continuation Signal: This is a bearish trade on a stock that is expected to continue lower over the duration of this trade.
1M/6M Trends: Bearish/Bearish
Relative Strength: 3/10
OptionsPlay Score: 125
Stop Loss: @ $10.11 (50% loss of premium)
View COST Trade
Entering the Trade
Use the following details to enter the trade on your trading platform. Please note that whenever there is a multi-leg option strategy, it should be entered as a single trade.
PLEASE NOTE that these prices are based on Wednesday’s closing prices. Should the underlying move significantly during the pre-market hours, we will likely adjust the strikes and prices to reflect a more accurate trade entry.
View COST Trade
C
DailyPlay – Closing Trade (C) – September 24, 2025
Closing Trade
- C – 44% gain: Buy to Close 5 Contracts (or 100% of your Contracts) Oct 31 $99/$93 Put Vertical Spreads @ $1.31 Debit. DailyPlay Portfolio: By Closing 5 Contracts, we will be paying $655. We initially opened these 5 contracts on September 16 @ $2.34 Credit. Our gain, therefore, is $515.