


The AI Infrastructure Inversion: Our New Macro Research Is Live

By Tony Zhang | Chief Strategist, OptionsPlay | March 2026
Today we are publishing the most ambitious piece of thematic research in OptionsPlay’s history: The AI Infrastructure Inversion.

This report represents weeks of work, analyzing hyperscaler capital expenditure, modeling AI compute demand curves, mapping the physical infrastructure supply chain, and identifying the companies positioned on both sides of what we believe is a generational structural shift in technology markets.
If you have been watching the tech selloff and wondering what is actually happening, this is the answer.
The Core Thesis
Wall Street is making a historic miscalculation. Analysts are projecting AI compute demand based on chatbot usage patterns, single-turn conversations that consume a few hundred tokens. But the products that are defining the AI market right now are not chatbots. They are autonomous agents.
AI agents like Claude Code, OpenAI Codex, and Microsoft Copilot Agents do not ask one question and stop. They plan, execute, iterate, and verify. A single agentic task can consume 100 to 3,000 times the compute of a chatbot query. And these are not prototypes. They are the fastest-growing products in the AI ecosystem today.
The result: Wall Street is modeling linear growth for a technology that scales exponentially. And that miscalculation has created one of the most asymmetric investment opportunities in a generation.
| The $675+ billion that hyperscalers have committed to AI infrastructure in 2026 is not reckless overspending. It is not enough. Our research explains why, and identifies exactly where the money is flowing. |
What Is in the Report
The AI Infrastructure Inversion is a full macro research report covering:
- The overspending myth: Why the bear case for AI infrastructure falls apart under scrutiny, and what the hyperscalers see that Wall Street does not.
- Exponential blindness: The cognitive bias causing analysts to underestimate compute demand — and the math that proves it.
- The inference inflection: Why the shift from training to inference changes the entire economics of AI infrastructure.
- The agentic AI revolution: How autonomous agents are replacing entire categories of enterprise software and compounding compute demand in the process.
- The 8-industry infrastructure map: A comprehensive framework spanning silicon, memory, power, cooling, networking, physical infrastructure, platforms, and the short side.
- Our anchor investment thesis: One company that sits at the intersection of every critical AI infrastructure layer, self-funds its entire buildout, and we believe is among the most mispriced in the market.
Why Now
Every major infrastructure cycle in history has followed the same pattern: massive build-out, widespread skepticism, and then explosive adoption that rewarded the early movers. But each cycle has been faster than the last. Railroads took 20 years. Cloud computing took 6 years. We believe the AI infrastructure investment window is measured in months.
The current selloff in tech stocks is not a sign that AI is failing. It is a sign that the market has not yet caught up to what is actually happening. The capital is not disappearing, it is transferring. And the companies on the right side of that transfer are building the foundation of the next era of computing.
That is what this report is about. Not hype. Not prediction. The structural math that says the infrastructure being built today is not enough, and the specific investments positioned to benefit.

KRE, PHM
OptionsPlay DailyPlay Ideas Menu – February 27th, 2026
💰 The Income Generators (High Probability, Cash Flow)
- KRE: Bullish Put Spread capitalizing on a technical pullback as stabilizing net interest margins and deregulation tailwinds provide a strong fundamental floor for regional banks.
- PHM: Bullish Put Spread leveraging a dip in a high-quality homebuilder, supported by a structural housing shortage and robust margins amidst stabilizing mortgage rates.
🚀 The Growth Seekers (Higher Risk, Max Reward)
- (No trades in this category today)
🛡️ The Portfolio Protectors (Hedges & Bearish Bets)
- (No trades in this category today)
1. KRE ($70.38) – Regional Bank Resilience

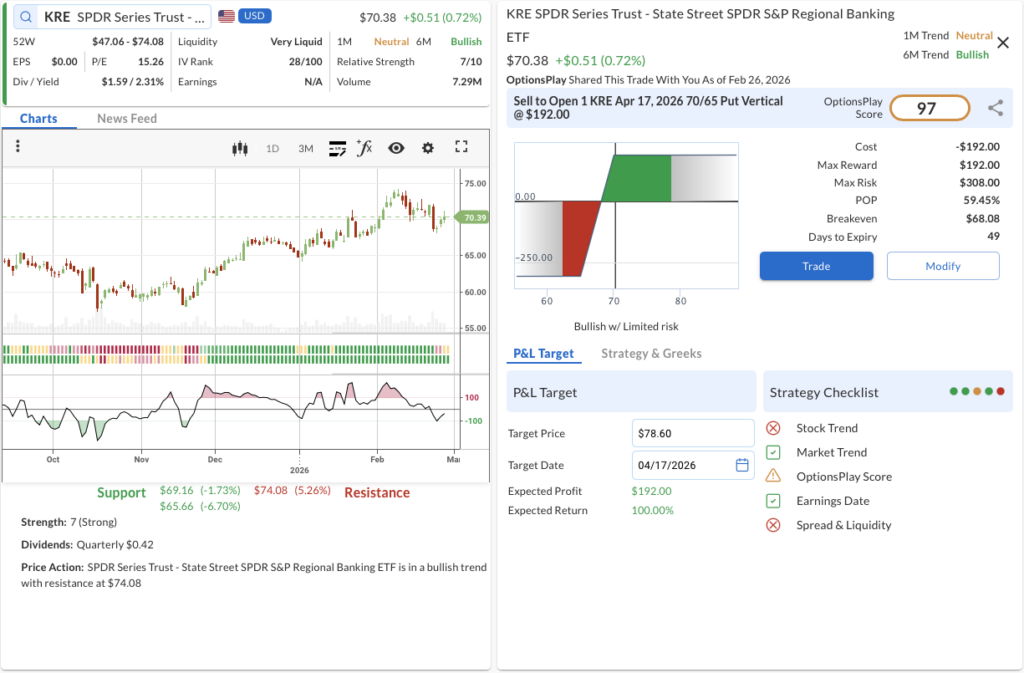
- The Trade: Sell to Open the KRE Apr 17, 2026 70/65 Put Vertical @ $1.92 Credit.
- 🟢 BUY TO OPEN Apr 17, 2026 65 Put @ $1.26
- 🔴 SELL TO OPEN Apr 17, 2026 70 Put @ $3.18
- Trade Metrics: POP: 59.45% | Collect $192.00 per contract vs. a Max Risk of $308.00 (1.6:1).
- The Why: Stabilizing net interest margins and potential deregulation tailwinds provide a strong fundamental floor for regional banks, making this pullback an attractive opportunity to generate premium.
- The Technicals: KRE remains in a solid longer-term Bullish Trend (6M) with a Relative Strength of 7/10, currently offering a buying opportunity on a CCI dip as it pulls back to test near-term support around $69.16, with resistance overhead at $74.08.
- Management:
- Stop Loss: Buy back the spread at $3.84 (100% of credit received).
- Take Profit: Buy back the spread at $0.96 (50% of max gain).
2. PHM ($135.66) – Building a Base

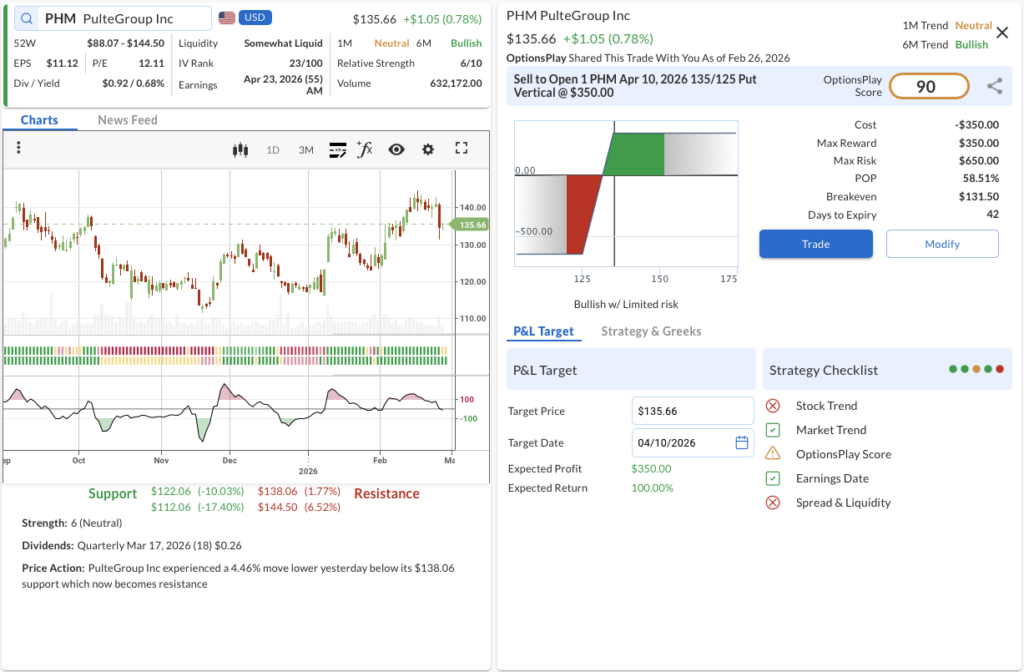
- The Trade: Sell to Open the PHM Apr 10, 2026 135/125 Put Vertical @ $3.50 Credit.
- 🟢 BUY TO OPEN Apr 10, 2026 125 Put @ $2.60
- 🔴 SELL TO OPEN Apr 10, 2026 135 Put @ $6.10
- Trade Metrics: POP: 58.51% | Collect $350.00 per contract vs. a Max Risk of $650.00 (1.9:1).
- The Why: PulteGroup continues to benefit from a structural housing shortage and robust margins, making technical pullbacks attractive entry points as mortgage rates stabilize and demographic demand remains strong.
- The Technicals: Despite a recent 4.46% pullback below $138.06 (which now acts as resistance), PHM maintains a 6M Bullish Trend with a Relative Strength of 6/10, presenting a classic CCI dip buying opportunity near current levels with lower support at $122.06.
- Management:
- Stop Loss: Buy back the spread at $7.00 (100% of credit received).
- Take Profit: Buy back the spread at $1.75 (50% of max gain).
ETN, VLO, BUD
OptionsPlay DailyPlay Ideas Menu – February 26th, 2026
💰 The Income Generators (High Probability, Cash Flow)
- ETN: Bullish Put Spread leveraging a technical dip in a high-conviction secular winner driven by data center and electrification tailwinds.
- VLO: Bullish Put Spread capitalizing on stabilizing refining margins and robust free cash flow generation during a technical consolidation.
🚀 The Growth Seekers (Higher Risk, Max Reward)
- (No trades in this category today)
🛡️ The Portfolio Protectors (Hedges & Bearish Bets)
- BUD: Bearish Put Spread betting on continued volume headwinds and shifting consumer preferences as the stock breaks below key technical support.
1. ETN ($373.53) – Buying the Electrification Dip

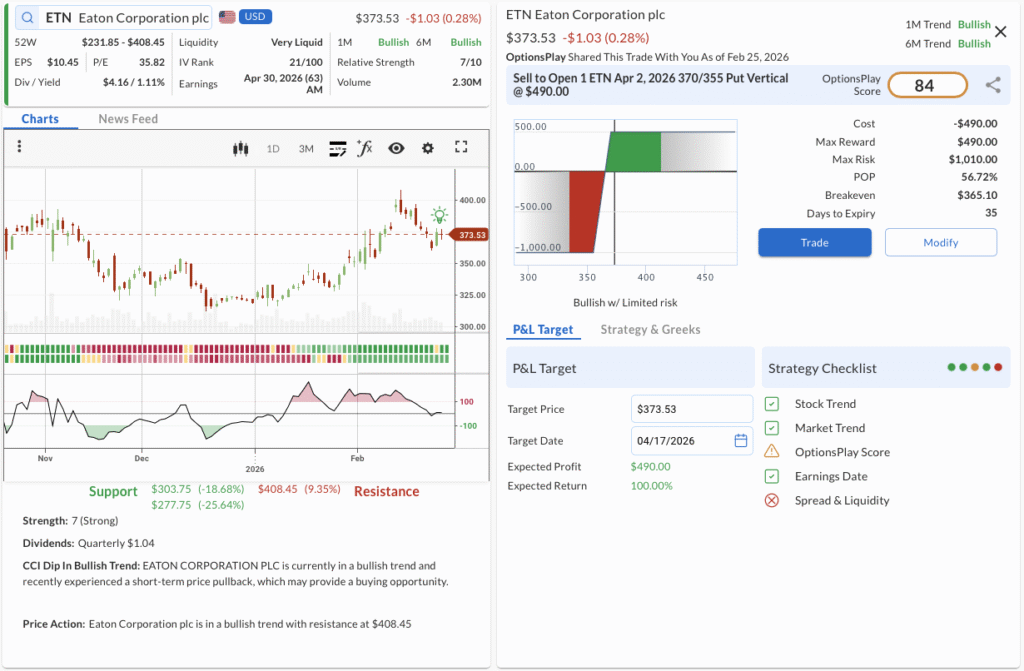
- The Trade: Sell to Open the ETN Apr 2, 2026 370/355 Put Vertical @ $4.90 Credit.
- 🟢 BUY TO OPEN Apr 02, 2026 355 Put @ $8.40
- 🔴 SELL TO OPEN Apr 02, 2026 370 Put @ $13.30
- Trade Metrics: POP: 56.72% | Collect $490.00 per contract vs. a Max Risk of $1,010.00 (2.1:1).
- The Why: Eaton remains a primary beneficiary of the multi-year data center and grid electrification supercycle, making this short-term pullback an attractive income-generation entry point on a structurally sound business.
- The Technicals: Eaton is in a confirmed Bullish Trend (1M & 6M) with a solid Relative Strength of 7/10, currently experiencing a CCI dip that offers a favorable short-term pullback opportunity while holding structural support levels, with resistance at $408.45.
- Management:
- Stop Loss: Buy back the spread at $9.80 (100% of credit received).
- Take Profit: Buy back the spread at $2.45 (50% of max gain).
2. VLO ($199.64) – Refining the Income Strategy

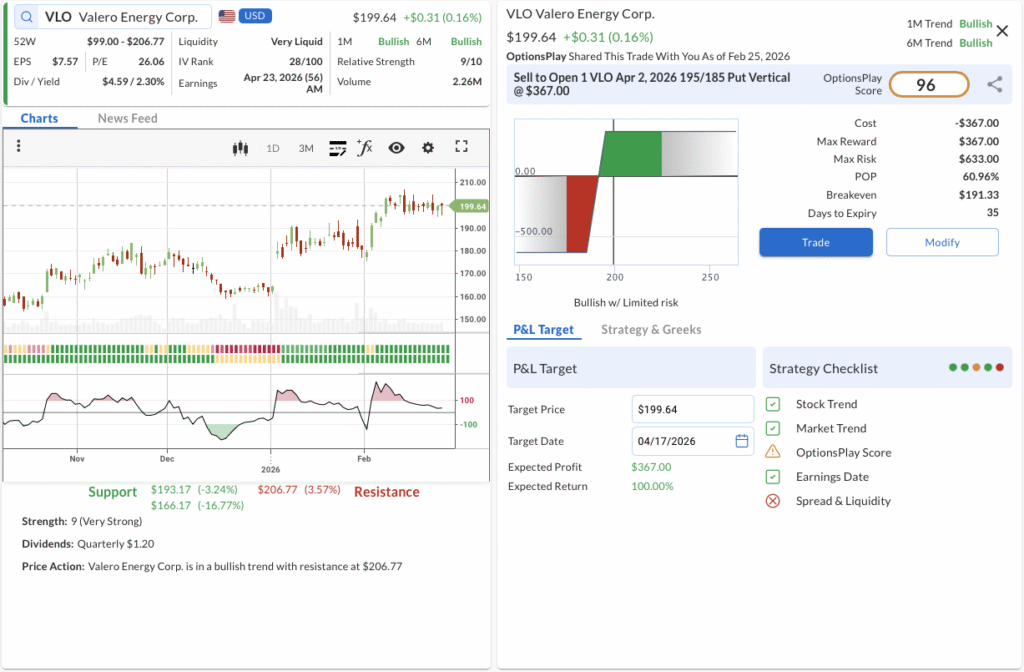
- The Trade: Sell to Open the VLO Apr 2, 2026 195/185 Put Vertical @ $3.67 Credit.
- 🟢 BUY TO OPEN Apr 02, 2026 185 Put @ $3.90
- 🔴 SELL TO OPEN Apr 02, 2026 195 Put @ $7.57
- Trade Metrics: POP: 60.96% | Collect $367.00 per contract vs. a Max Risk of $633.00 (1.7:1).
- The Why: Valero continues to demonstrate exceptional operational efficiency and strong free cash flow generation, supporting sustained shareholder returns even as energy markets stabilize.
- The Technicals: Valero remains in a strong Bullish Trend (1M & 6M) with excellent Relative Strength (9/10), consolidating in a tight range above major support at $193.17 with overhead resistance sitting at $206.77.
- Management:
- Stop Loss: Buy back the spread at $7.34 (100% of credit received).
- Take Profit: Buy back the spread at $1.84 (50% of max gain).
3. BUD ($78.59) – A Bitter Technical Breakdown

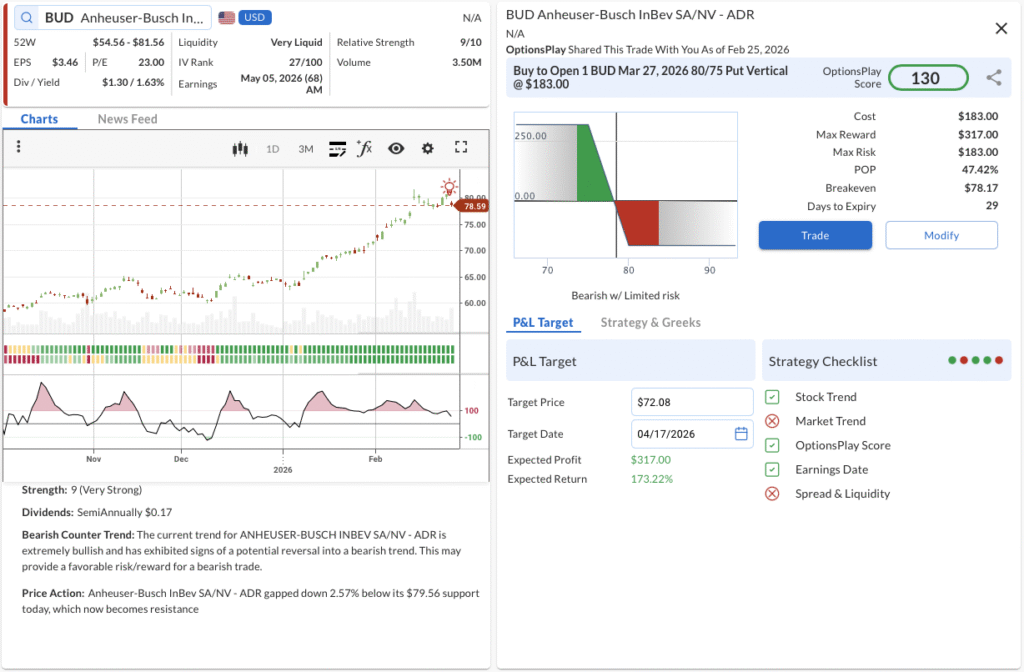
- The Trade: Buy to Open the BUD Mar 27, 2026 80/75 Put Vertical @ $1.83 Debit.
- 🔴 SELL TO OPEN Mar 27, 2026 75 Put @ $0.77
- 🟢 BUY TO OPEN Mar 27, 2026 80 Put @ $2.60
- Trade Metrics: POP: 47.42% | Pay $183.00 per contract vs. a Max Reward of $317.00 (1.7:1).
- The Why: Persistent volume pressures in key global markets and structural shifts in consumer preferences continue to create fundamental headwinds for Anheuser-Busch, justifying a bearish position following a technical breakdown.
- The Technicals: Despite a longer-term Bullish Trend (6M), the stock is exhibiting a Bearish Counter Trend and recently gapped down 2.57% below its $79.56 support level, which now acts as a firm resistance ceiling.
- Management:
- Stop Loss: Sell the spread at $0.92 (50% loss on premium).
- Take Profit: Sell the spread at $3.20 (75% gain on premium).
HOOD, REGN, NVDA
OptionsPlay DailyPlay Ideas Menu – February 25th, 2026
💰 The Income Generators (High Probability, Cash Flow)
- HOOD: Bullish Put Spread capitalizing on a potential trend reversal driven by a resurgence in retail trading and crypto volumes.
- REGN: Bullish Put Spread leveraging resilient pipeline execution and defensive biotech valuation during a technical pullback.
🚀 The Growth Seekers (Higher Risk, Max Reward)
- NVDA: Bullish Call Spread betting on continued AI infrastructure dominance and data center growth ahead of a critical earnings report.
🛡️ The Portfolio Protectors (Hedges & Bearish Bets)
- (No trades in this category today)
1. HOOD ($73.39) – The Retail Reversal

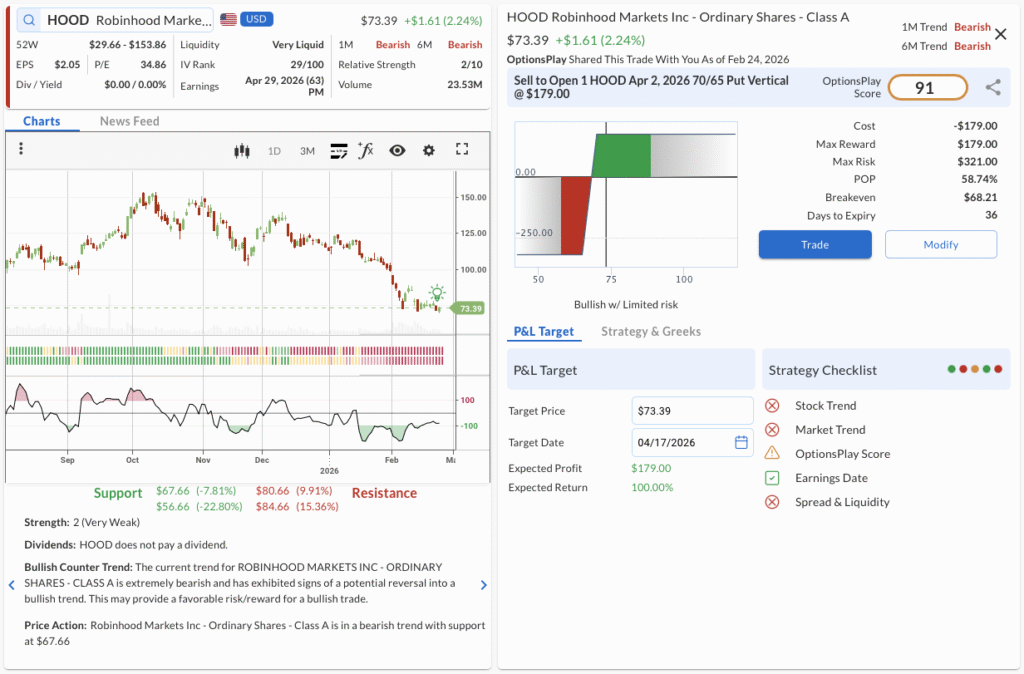
- The Trade: Sell to Open the HOOD Apr 02, 2026 70/65 Put Vertical @ $1.79 Credit.
- 🟢 BUY TO OPEN Apr 02, 2026 65 Put @ $2.84
- 🔴 SELL TO OPEN Apr 02, 2026 70 Put @ $4.63
- Trade Metrics: POP: 58.74% | Collect $179.00 per contract vs. a Max Risk of $321.00 (1.8:1).
- The Why: Despite recent bearish technicals, Robinhood’s expanding product suite and a resurgence in retail crypto trading volumes provide a strong fundamental catalyst for a stabilization and reversal.
- The Technicals: Although entrenched in a Bearish Trend (1M & 6M) with a weak Relative Strength of 2/10, the stock has recently bounced off its $67.66 support, exhibiting signs of a bullish counter-trend reversal toward the $80.66 resistance level.
- Management:
- Stop Loss: Buy back the spread at $3.58 (100% of credit received).
- Take Profit: Buy back the spread at $0.90 (50% of max gain).
2. REGN ($772.19) – Biotech Resilience


- The Trade: Sell to Open the REGN Apr 02, 2026 760/740 Put Vertical @ $7.50 Credit.
- 🟢 BUY TO OPEN Apr 02, 2026 740 Put @ $22.15
- 🔴 SELL TO OPEN Apr 02, 2026 760 Put @ $29.65
- Trade Metrics: POP: 56.13% | Collect $750.00 per contract vs. a Max Risk of $1,250.00 (1.7:1).
- The Why: Regeneron’s dominant position with Dupixent and its robust oncology pipeline continue to drive steady cash flows, making this technical pullback to support a compelling income opportunity.
- The Technicals: With a Strong Relative Strength of 9/10, the stock is currently consolidating in a Neutral 1M trend within a broader 6M Bullish Trend, experiencing a short-term dip that offers a favorable entry towards an $820 resistance target.
- Management:
- Stop Loss: Buy back the spread at $15.00 (100% of credit received).
- Take Profit: Buy back the spread at $3.75 (50% of max gain).
3. NVDA ($192.85) – The AI Infrastructure Engine

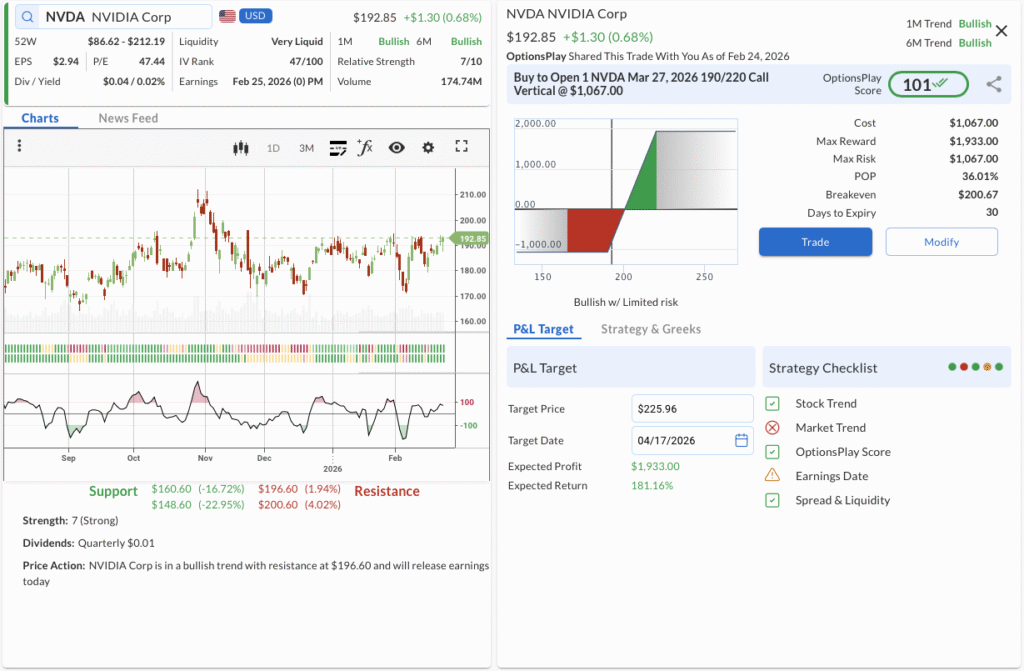
- The Trade: Buy to Open the NVDA Mar 27, 2026 190/220 Call Vertical @ $10.67 Debit.
- 🟢 BUY TO OPEN Mar 27, 2026 190 Call @ $13.05
- 🔴 SELL TO OPEN Mar 27, 2026 220 Call @ $2.38
- Trade Metrics: POP: 36.01% | Pay $1,067.00 per contract vs. a Max Reward of $1,933.00 (1.8:1).
- The Why: Nvidia remains the undisputed leader in AI accelerators, and persistent hyper-scaler CapEx spending on data centers provides a massive fundamental tailwind to support a post-earnings breakout.
- The Technicals: The stock is maintaining a confirmed Bullish Trend (1M & 6M) with a solid Relative Strength of 7/10, currently testing overhead resistance at $196.60 ahead of an imminent earnings catalyst.
- Management:
- ⚠️ Warning: Earnings is scheduled for Feb 25, which may require active management.
- Stop Loss: Sell the spread at $5.34 (50% loss on premium).
- Take Profit: Sell the spread at $18.67 (75% gain on premium).
GLD, HCA, LOW
OptionsPlay DailyPlay Ideas Menu – February 24th, 2026
💰 The Income Generators (High Probability, Cash Flow)
- GLD: Bullish Put Spread capitalizing on robust safe-haven demand and continued central bank accumulation driving gold to sustained highs.
- HCA: Bullish Put Spread leveraging resilient patient volume growth and stabilizing labor costs within a defensive healthcare sector.
🚀 The Growth Seekers (Higher Risk, Max Reward)
- LOW: Bullish Call Spread betting on a long-term stabilization in housing turnover and resilience in the pro-contractor segment.
🛡️ The Portfolio Protectors (Hedges & Bearish Bets)
- (No trades in this category today)
1. GLD ($481.28) – The Golden Breakout

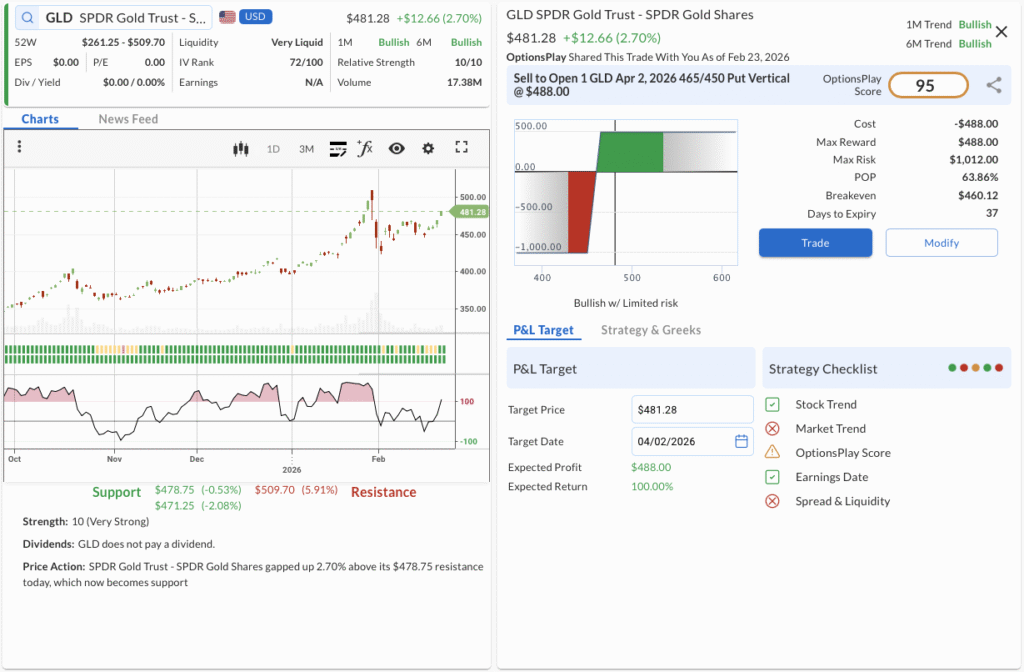
- The Trade: Sell to Open the GLD Apr 02, 2026 465/450 Put Vertical @ $4.88 Credit.
- 🟢 BUY TO OPEN Apr 02, 2026 450 Put @ $7.85
- 🔴 SELL TO OPEN Apr 02, 2026 465 Put @ $12.73
- Trade Metrics: POP: 63.86% | Collect $488.00 per contract vs. a Max Risk of $1,012.00 (2.1:1).
- The Why: Macroeconomic uncertainties and persistent inflation concerns are driving strong safe-haven flows into gold, providing a fundamental tailwind for continuous price appreciation.
- The Technicals: Displaying maximum Relative Strength (10/10) within a confirmed Bullish Trend (1M & 6M), the ETF has gapped up above its $470 resistance level after consolidating over the past couple of weeks towards its $510 all-time highs.
- Management:
- Stop Loss: Buy back the spread at $9.76 (100% of credit received).
- Take Profit: Buy back the spread at $2.44 (50% of max gain).
2. HCA ($535.97) – Defensive Healthcare Yield

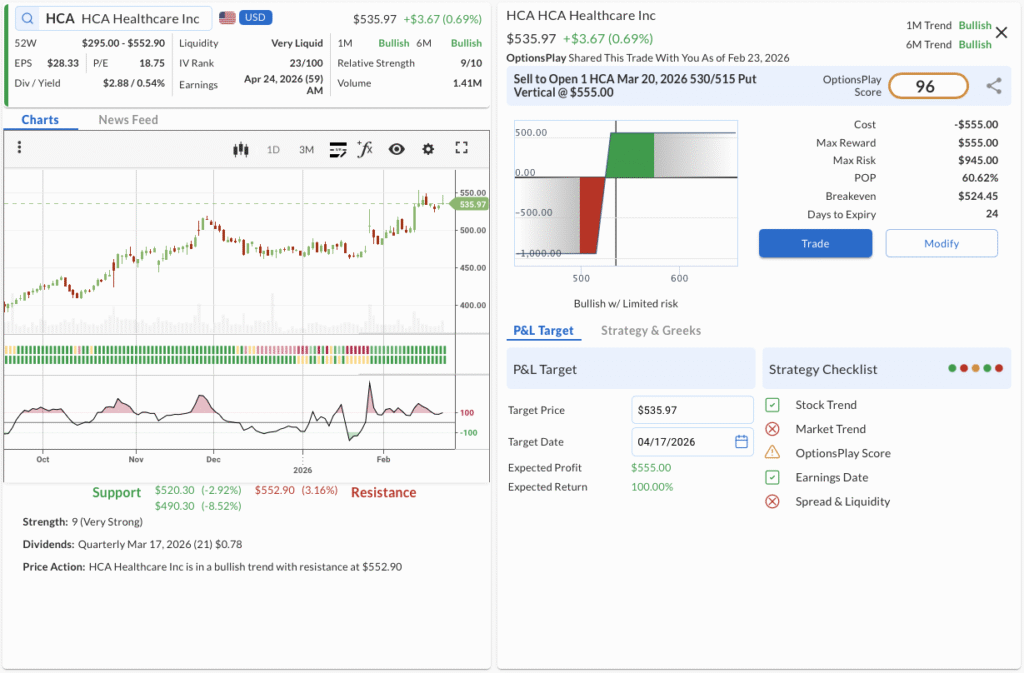
- The Trade: Sell to Open the HCA Mar 20, 2026 530/515 Put Vertical @ $5.55 Credit.
- 🟢 BUY TO OPEN Mar 20, 2026 515 Put @ $6.30
- 🔴 SELL TO OPEN Mar 20, 2026 530 Put @ $11.85
- Trade Metrics: POP: 60.62% | Collect $555.00 per contract vs. a Max Risk of $945.00 (1.7:1).
- The Why: Hospital operators are experiencing sustained admissions growth and margin expansion as contract labor costs normalize, establishing a strong fundamental base for income trades.
- The Technicals: HCA exhibits strong momentum with a Relative Strength of 9/10 in a dual Bullish Trend (1M & 6M), consolidating constructively above its $520.30 support level before its next leg up.
- Management:
- Stop Loss: Buy back the spread at $11.10 (100% of credit received).
- Take Profit: Buy back the spread at $2.78 (50% of max gain).
3. LOW ($274.36) – Building the Rebound

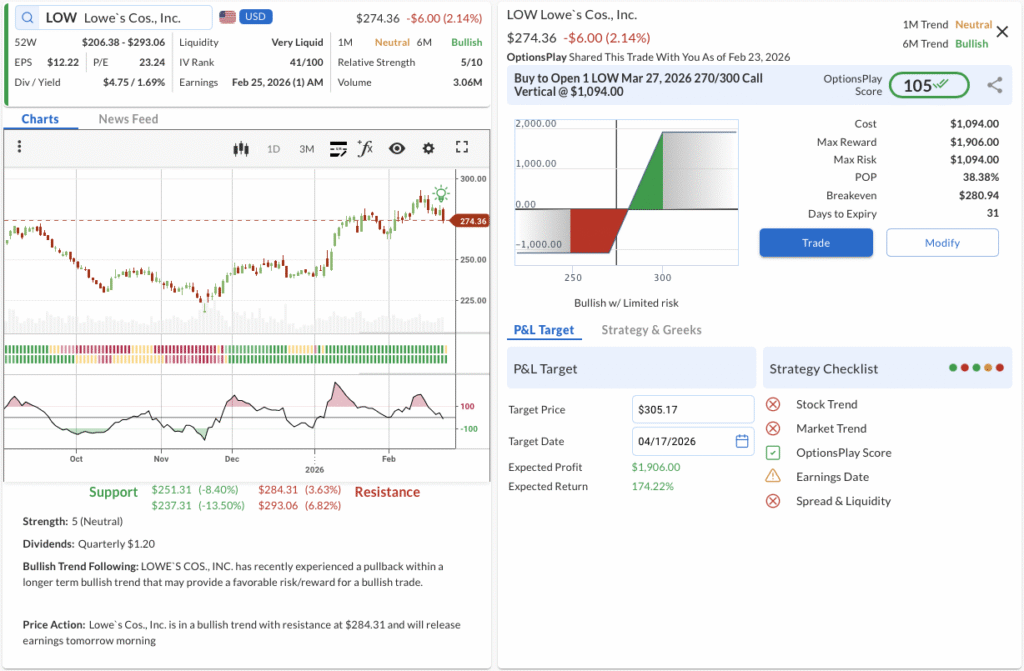
- The Trade: Buy to Open the LOW Mar 27, 2026 270/300 Call Vertical @ $10.94 Debit.
- 🟢 BUY TO OPEN Mar 27, 2026 270 Call @ $13.30
- 🔴 SELL TO OPEN Mar 27, 2026 300 Call @ $2.36
- Trade Metrics: POP: 38.38% | Pay $1,094.00 per contract vs. a Max Reward of $1,906.00 (1.7:1).
- The Why: Despite near-term DIY retail softness, Lowe’s continues to capture market share in the high-value Pro segment, positioning the company for a strong fundamental rebound as housing turnover begins to normalize.
- The Technicals: Currently experiencing a pullback within a broader 6M Bullish Trend, the stock has reset to a Neutral 1M trend and is resting above its $251.31 support, offering a favorable entry ahead of testing $284.31 resistance.
- Management
- ⚠️ Warning: Earnings is scheduled for Feb 25, which may require active management.
- Stop Loss: Sell the spread at $5.47 (50% loss on premium).
- Take Profit: Sell the spread at $19.15 (75% gain on premium).
MSFT, CLX, W
OptionsPlay DailyPlay Ideas Menu – February 23rd, 2026
💰 The Income Generators (High Probability, Cash Flow)
- MSFT: Bullish Put Vertical as continued enterprise AI monetization and robust Azure cloud growth provide a strong fundamental floor for the tech giant.
🚀 The Growth Seekers (Higher Risk, Max Reward)
- CLX: Bullish Call Vertical as strong consumer staples pricing power and cost-saving initiatives expand margins.
🛡️ The Portfolio Protectors (Hedges & Bearish Bets)
- W: Bearish Call Vertical as lingering macroeconomic headwinds and weakened consumer discretionary spending on home goods pressure near-term revenue prospects.
1. MSFT ($397.23) – Azure Cloud Strength Supports the Floor

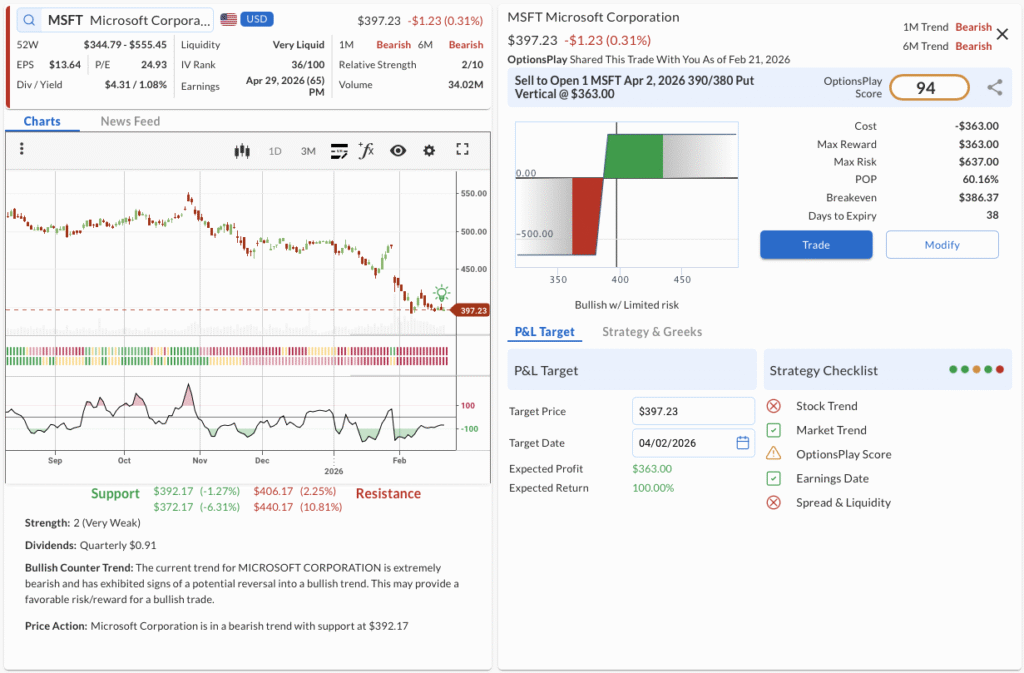
- The Trade: Sell to Open the MSFT Apr 02, 2026 390/380 Put Vertical @ $3.63 Credit.
- 🔴 SELL TO OPEN Apr 02, 2026 390 Put @ $11.03
- 🟢 BUY TO OPEN Apr 02, 2026 380 Put @ $7.40
- Trade Metrics: POP: 60.16% | Collect $363.00 per contract vs. a Max Risk of $637.00 (1.8:1).
- The Why: Continued enterprise AI monetization and robust Azure cloud growth provide a strong fundamental floor for the tech giant.
- The Technicals: Microsoft’s steep bearish downtrend is showing key signs of exhaustion, potentially reversing off near-term support at $392.17 to favor a bullish income strategy.
- Management:
- Stop Loss: Buy to close the spread at $7.26 (100% of credit received).
- Take Profit: Buy to close the spread at $1.82 (50% of max gain).
2. CLX ($123.60) – Margins Expand in Consumer Staples

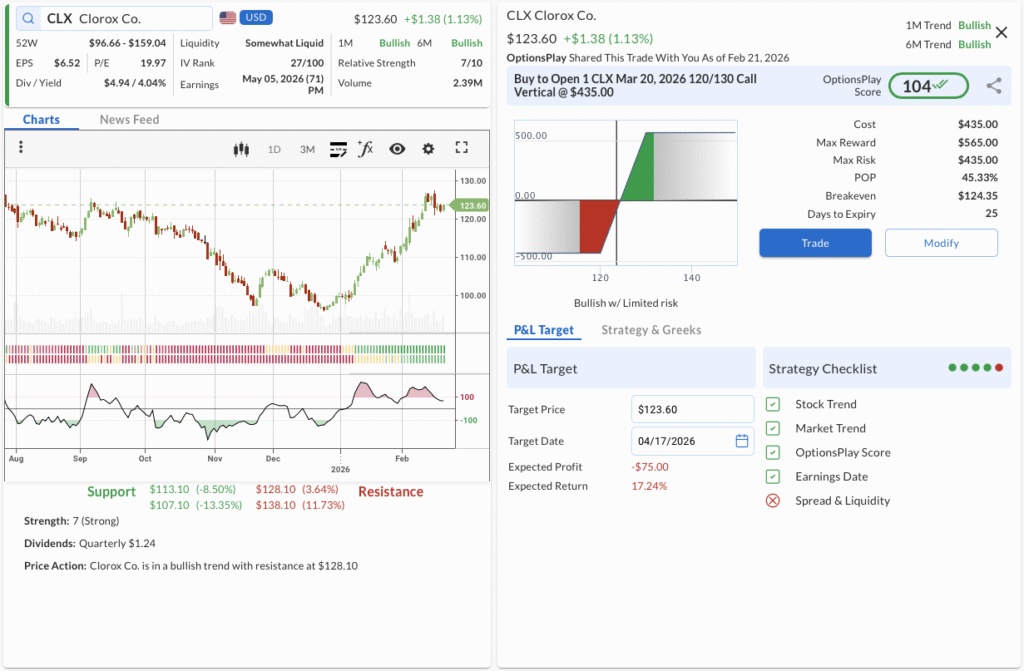
- The Trade: Buy to Open the CLX Mar 20, 2026 120/130 Call Vertical @ $4.35 Debit.
- 🟢 BUY TO OPEN Mar 20, 2026 120 Call @ $5.40
- 🔴 SELL TO OPEN Mar 20, 2026 130 Call @ $1.05
- Trade Metrics: POP: 45.33% | Pay $435.00 per contract vs. a Max Reward of $565.00 (1.3:1).
- The Why: Strong consumer staples pricing power and cost-saving initiatives are expanding margins.
- The Technicals: Clorox exhibits a strong bullish 1-month and 6-month trend, with room to run toward the $128.10 resistance level following recent consolidation.
- Management:
- Stop Loss: Sell to close the spread at $2.18 (50% loss on premium).
- Take Profit: Sell to close the spread at $7.61 (75% gain on premium).
3. W ($81.43) – Discretionary Spending Headwinds Persist

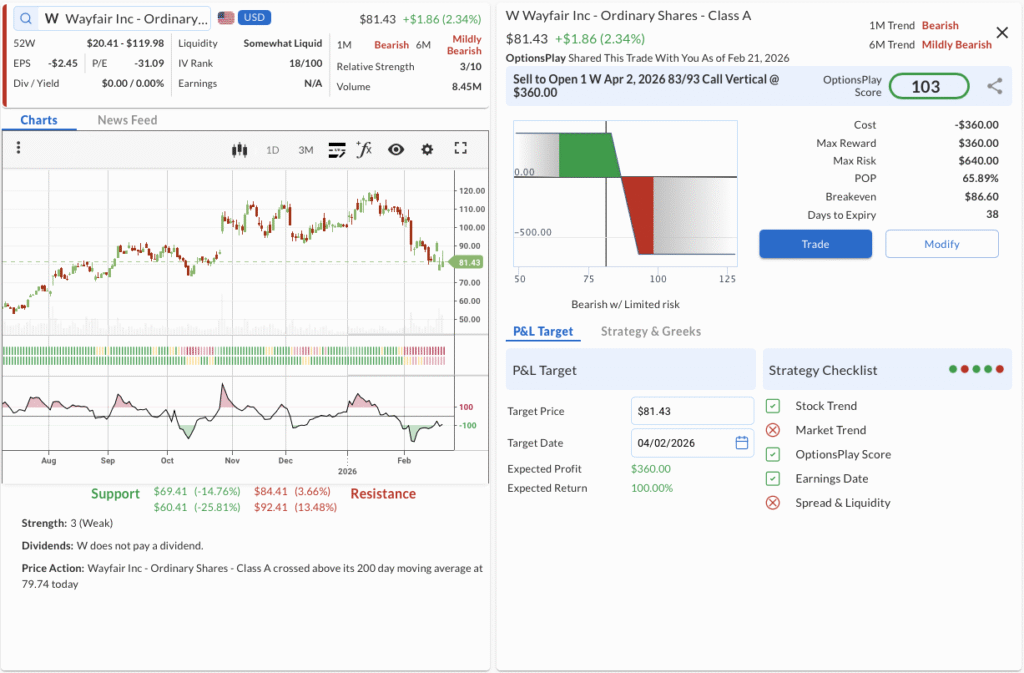
- The Trade: Sell to Open the W Apr 02, 2026 83/93 Call Vertical @ $3.60 Credit.
- 🔴 SELL TO OPEN Apr 02, 2026 83 Call @ $6.60
- 🟢 BUY TO OPEN Apr 02, 2026 93 Call @ $3.00
- Trade Metrics: POP: 65.89% | Collect $360.00 per contract vs. a Max Risk of $640.00 (1.8:1).
- The Why: Lingering macroeconomic headwinds and weakened consumer discretionary spending on home goods pressure near-term revenue prospects.
- The Technicals: Despite a recent moving average crossover, Wayfair remains in a longer-term bearish trend and is approaching a heavy resistance zone near $84.41.
- Management:
- Stop Loss: Buy to close the spread at $7.20 (100% of credit received).
- Take Profit: Buy to close the spread at $1.80 (50% of max gain).
UAL, EOG, MRNA
OptionsPlay DailyPlay Ideas Menu – February 20th, 2026
💰 The Income Generators (High Probability, Cash Flow)
- UAL: Bullish Put Spread leveraging United Airlines’ strong premium cabin demand and record bookings as it consolidates near moving average support.
- EOG: Bullish Put Spread capitalizing on disciplined capital allocation and robust free cash flow generation as EOG consolidates near recent highs.
🚀 The Growth Seekers (Higher Risk, Max Reward)
- MRNA: Bullish Call Spread betting on a renewed growth narrative as Moderna’s non-COVID pipeline (including personalized cancer vaccines) shows promising clinical momentum.
🛡️ The Portfolio Protectors (Hedges & Bearish Bets)
- (No trades in this category today)
1. UAL ($110.05) – Cruising Altitude Income

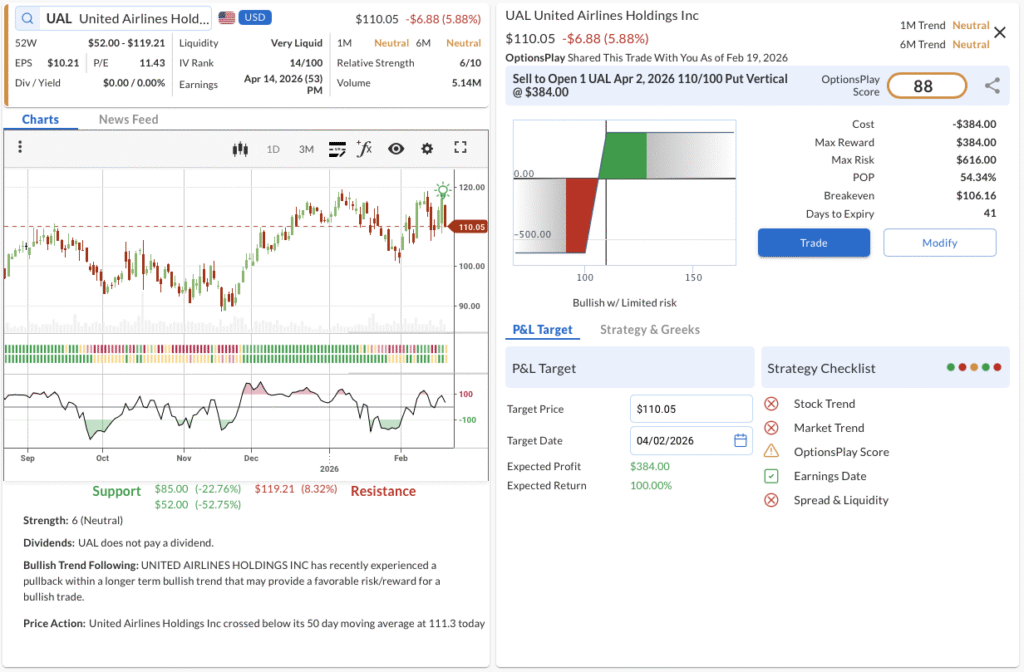
- The Trade: Sell to Open the UAL Apr 2, 2026 110/100 Put Vertical @ $3.84 Credit.
- 🟢 BUY TO OPEN Apr 02, 2026 100 Put @ $3.41
- 🔴 SELL TO OPEN Apr 02, 2026 110 Put @ $7.25
- Trade Metrics: POP: 54.34% | Collect $384.00 per contract vs. a Max Risk of $616.00 (1.6:1).
- The Why: Despite temporary capacity constraints, United Airlines is demonstrating resilient pricing power and generating strong free cash flow from elevated travel demand, providing a solid fundamental floor for premium collection.
- The Technicals: UAL is in a Neutral Trend (1M & 6M) with a Relative Strength of 6/10, currently experiencing a pullback to its $110 support level that was prior resistance, providing an attractive risk to reward for a bullish setup.
- Management:
- Stop Loss: Buy back the spread at $7.68 (100% of credit received).
- Take Profit: Buy back the spread at $1.92 (50% of max gain).
2. EOG ($123.87) – Disciplined Energy Yield

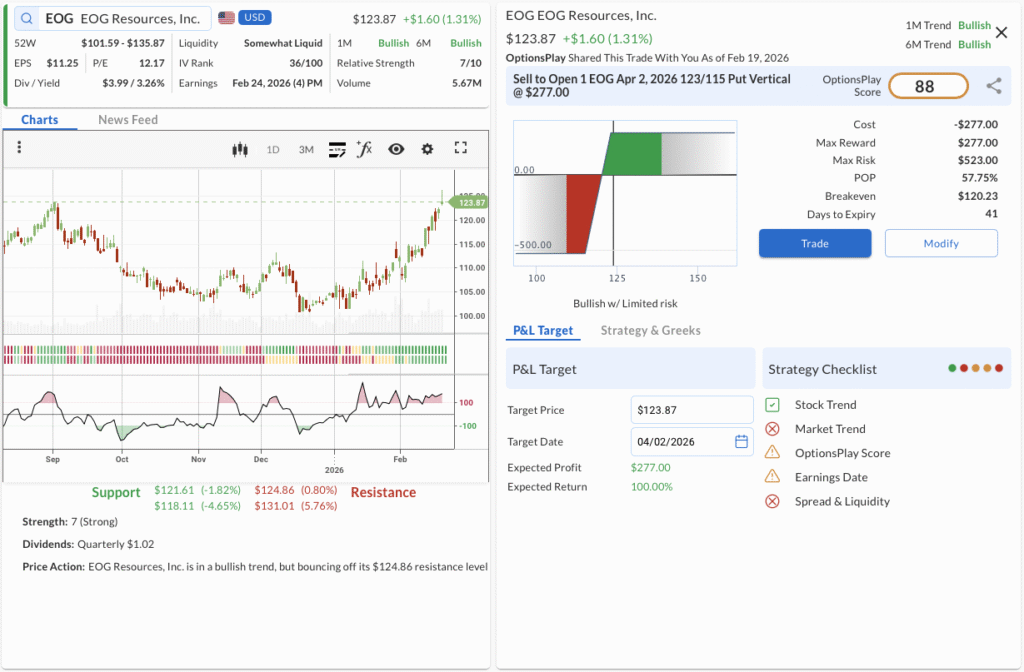
- The Trade: Sell to Open the EOG Apr 2, 2026 123/115 Put Vertical @ $2.77 Credit.
- 🟢 BUY TO OPEN Apr 02, 2026 115 Put @ $1.98
- 🔴 SELL TO OPEN Apr 02, 2026 123 Put @ $4.75
- Trade Metrics: POP: 57.75% | Collect $277.00 per contract vs. a Max Risk of $523.00 (1.9:1).
- The Why: EOG Resources remains a premier operator in the energy space, and its commitment to returning capital to shareholders via special dividends creates an attractive setup for income generation amidst stabilized crude prices.
- The Technicals: EOG is in a confirmed Bullish Trend (1M & 6M) with a Relative Strength of 7/10 and breaking out above its $120 resistance level on strong momentum with a $131 resistance target.
- Management:⚠️ Warning: Earnings is scheduled for Feb 24, which may require active management.
- Stop Loss: Buy back the spread at $5.54 (100% of credit received).
- Take Profit: Buy back the spread at $1.38 (50% of max gain).
3. MRNA ($49.70) – Biotech Breakout View Trade in OptionsPlay

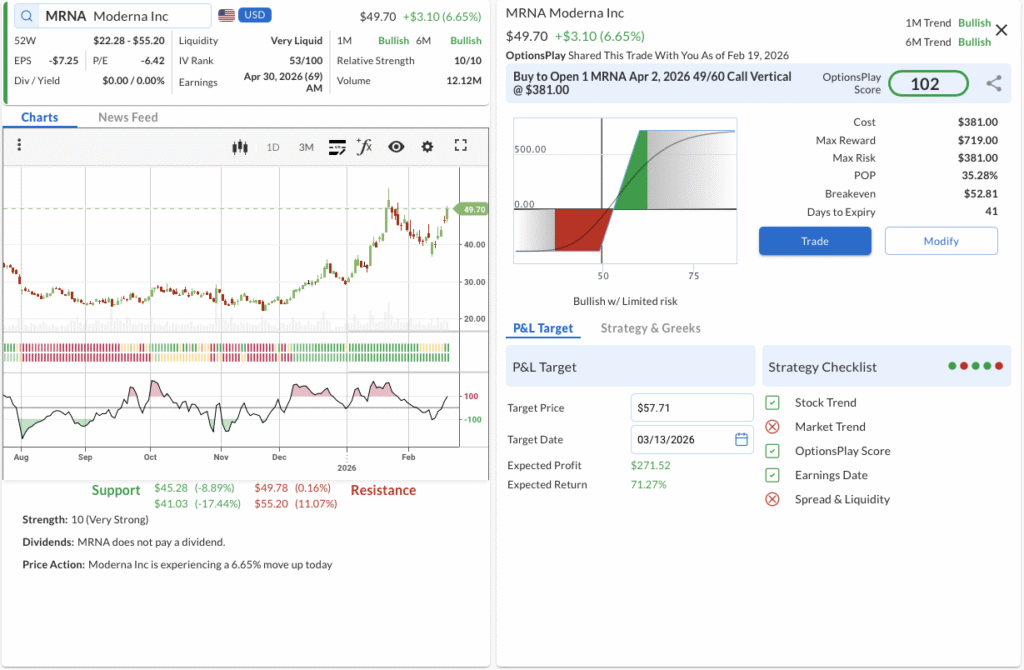
- The Trade: Buy to Open the MRNA Apr 2, 2026 49/60 Call Vertical @ $3.81 Debit.
- 🟢 BUY TO OPEN Apr 02, 2026 49 Call @ $5.90
- 🔴 SELL TO OPEN Apr 02, 2026 60 Call @ $2.09
- Trade Metrics: POP: 35.28% | Pay $381.00 per contract vs. a Max Reward of $719.00 (1.9:1).
- The Why: The market is beginning to re-rate Moderna as the focus shifts from legacy COVID revenues toward its expansive mRNA pipeline and upcoming commercial launches in oncology and rare diseases.
- The Technicals: Moderna exhibits extremely strong momentum (10/10 RS) within a Bullish Trend (1M & 6M), pushing up over 6% today to immediately challenge resistance at $49.78 above a solid support floor at $45.28.
- Management:
- Stop Loss: Sell the spread at $1.90 (50% loss on premium).
- Take Profit: Sell the spread at $6.66 (75% gain on premium).
ALGN, MCD, TFC
OptionsPlay DailyPlay Ideas Menu – February 19th, 2026
💰 The Income Generators (High Probability, Cash Flow)
- ALGN: Bullish Put Spread capitalizing on resilient clear aligner demand and digital ecosystem growth during a technical pullback.
- MCD: Bullish Put Spread leveraging McDonald’s defensive value-menu strategy and consistent foot traffic within a strong uptrend.
🚀 The Growth Seekers (Higher Risk, Max Reward)
- TFC: Long Call betting on net interest income expansion and cost rationalization driving a continued technical breakout.
🛡️ The Portfolio Protectors (Hedges & Bearish Bets)
- (No trades in this category today)
1. ALGN ($190.82) – Smiling Through the Dip

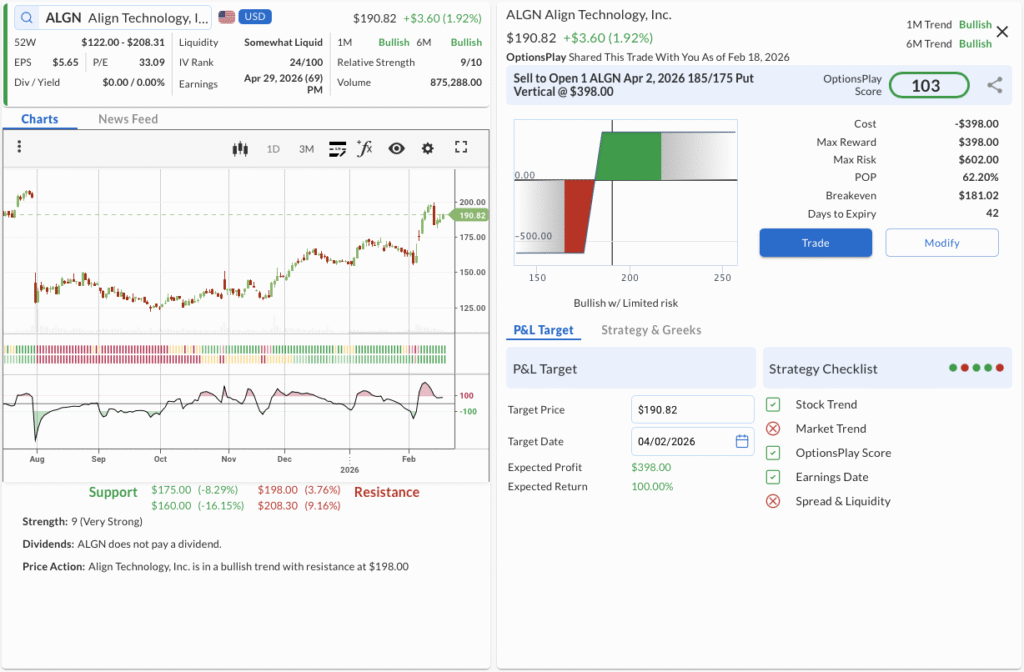
- The Trade: Sell to Open the ALGN Apr 2, 2026 185/175 Put Vertical @ $3.98 Credit.
- 🟢 BUY TO OPEN Apr 02, 2026 175 Put @ $4.02
- 🔴 SELL TO OPEN Apr 02, 2026 185 Put @ $8.00
- Trade Metrics: POP: 62.20% | Collect $398.00 per contract vs. a Max Risk of $602.00 (1.5:1).
- The Why: Align Technology is seeing resilient demand in teen clear aligner adoption and margin expansion from its digital scanning ecosystem, making this technical pullback an attractive entry.
- The Technicals: The stock boasts a Very Strong Relative Strength of 9/10 within a confirmed Bullish Trend (1M & 6M), currently experiencing a pause after breaking out above $175, providing a strong risk to reward entry for a continuation higher.
- Management:
- Stop Loss: Buy back the spread at $7.96 (100% of credit received).
- Take Profit: Buy back the spread at $1.99 (50% of max gain).
2. MCD ($327.89) – Defensive Value Momentum

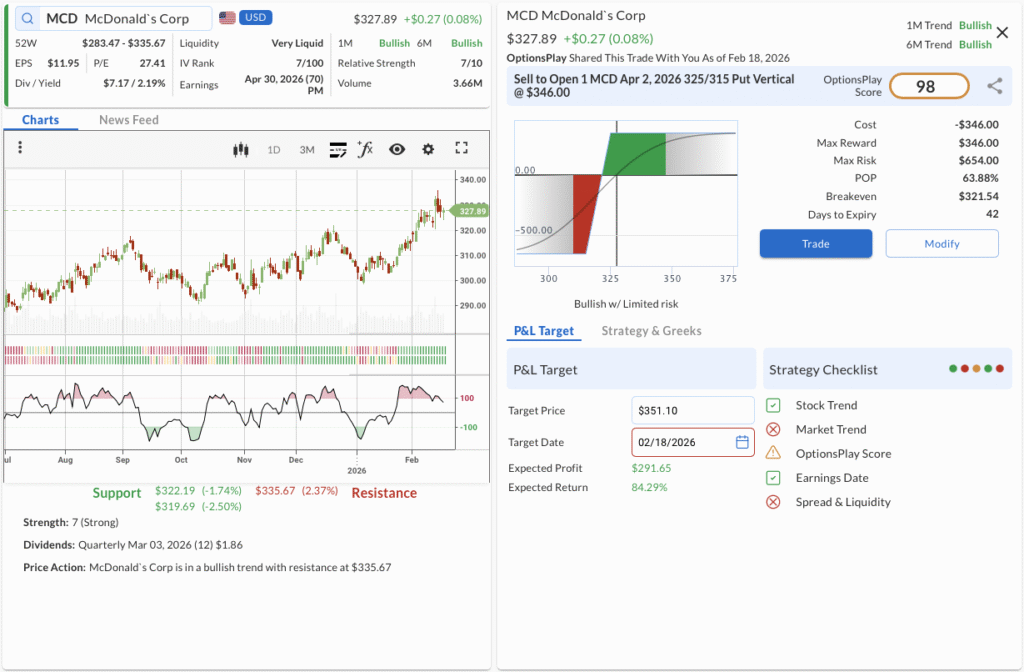
- The Trade: Sell to Open the MCD Apr 2, 2026 325/315 Put Vertical @ $3.46 Credit.
- 🟢 BUY TO OPEN Apr 02, 2026 315 Put @ $3.19
- 🔴 SELL TO OPEN Apr 02, 2026 325 Put @ $6.65
- Trade Metrics: POP: 63.88% | Collect $346.00 per contract vs. a Max Risk of $654.00 (1.9:1).
- The Why: McDonald’s robust value-menu strategy is successfully driving foot traffic and defending market share despite a softer consumer discretionary environment.
- The Technicals: Maintaining a solid Bullish Trend (1M & 6M) with a Relative Strength of 7/10, the stock has recently bounced off its $322.19 support level and is aiming to retest resistance at $335.67.
- Management:
- Stop Loss: Buy back the spread at $6.92 (100% of credit received).
- Take Profit: Buy back the spread at $1.73 (50% of max gain).
3. TFC ($52.69) – Banking on the Breakout

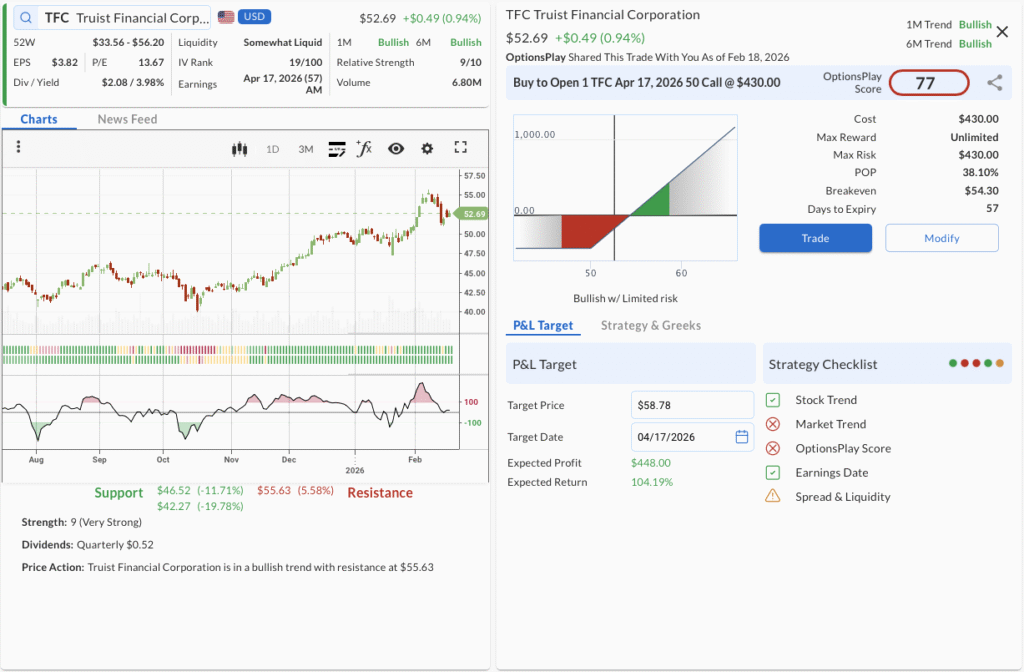
- The Trade: Buy to Open the TFC Apr 17, 2026 50 Call @ $4.30 Debit.
- 🟢 BUY TO OPEN Apr 17, 2026 50 Call @ $4.30
- Trade Metrics: POP: 38.10% | Pay $430.00 per contract vs. a Max Reward of Unlimited.
- The Why: Truist Financial is benefiting from a steeper yield curve and successful post-merger cost rationalization, driving strong net interest income growth potential.
- The Technicals: Demonstrating exceptional momentum with a Relative Strength of 9/10, the stock is consolidating within a broad Bullish Trend (1M & 6M) above its $46.52 support, setting up for a potential breakout toward $55.63 resistance.
- Management:⚠️ Warning: Earnings is scheduled for Apr 17, which may require active management.
- Stop Loss: Sell the call at $2.15 (50% loss on premium).
- Take Profit: Sell the call at $7.53 (75% gain on premium).
CME, ETN, AMZN
OptionsPlay DailyPlay Ideas Menu – February 18th, 2026
💰 The Income Generators (High Probability, Cash Flow)
- CME: Bullish Put Spread capitalizing on record-breaking global derivatives volume and structural revenue growth from non-U.S. trading hours.
- ETN: Bullish Put Spread leveraging a dip in a high-conviction secular winner, supported by confident 2026 guidance for 7-9% organic growth driven by data center electrification.
🚀 The Growth Seekers (Higher Risk, Max Reward)
- AMZN: Bullish Call Spread betting on a mean-reversion bounce as the stock hits multi-year valuation lows and extreme oversold technical conditions.
🛡️ The Portfolio Protectors (Hedges & Bearish Bets)
- (No trades in this category today)
1. CME ($303.23) – Volatility is the Product

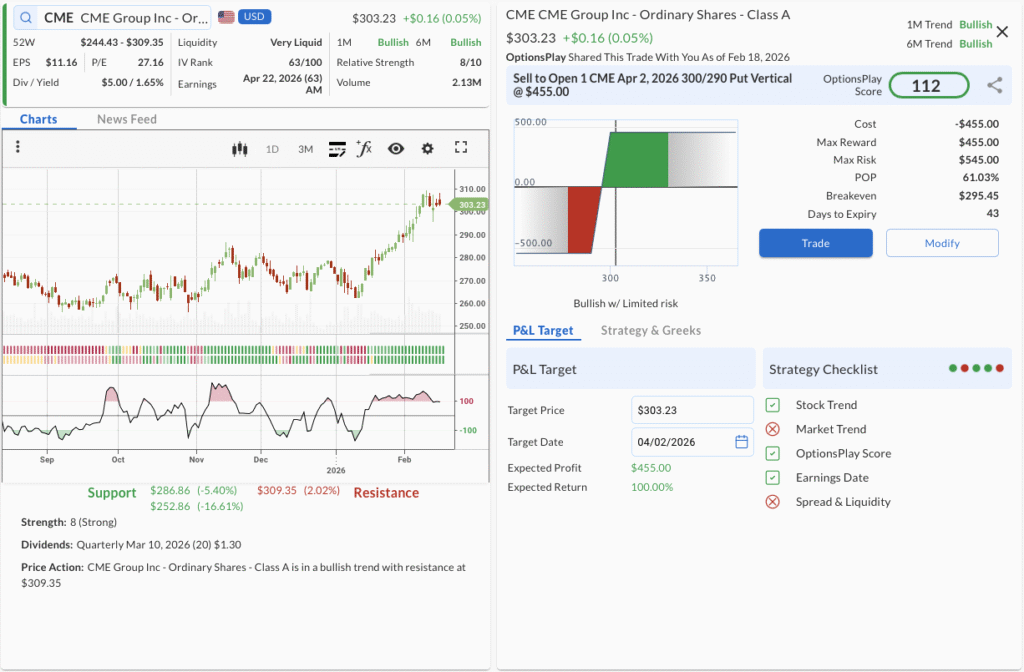
- The Trade: Sell to Open the CME Apr 02, 2026 300/290 Put Vertical @ $4.55 Credit.
- 🔴 SELL TO OPEN Apr 02, 2026 300 Put @ $11.00
- 🟢 BUY TO OPEN Apr 02, 2026 290 Put @ $6.45
- Trade Metrics: POP: 61.03% | Collect $455.00 per contract vs. a Max Risk of $545.00 (1.2:1).
- The Why: CME Group is seeing record average daily volume in equity and commodity options, particularly outside U.S. hours; this structural volatility demand supports a bullish thesis despite short-term fluctuations.
- The Technicals: The stock remains in a confirmed Bullish Trend (1M & 6M) and is currently finding support at the $300 level (previous resistance turned support) after a minor pullback, aiming for a retest of highs near $310.
- Management:
- Stop Loss: Buy back the spread at $9.10 (100% of credit received).
- Take Profit: Buy back the spread at $2.28 (50% of max gain).
2. ETN ($391.50) – Electrification Supercycle

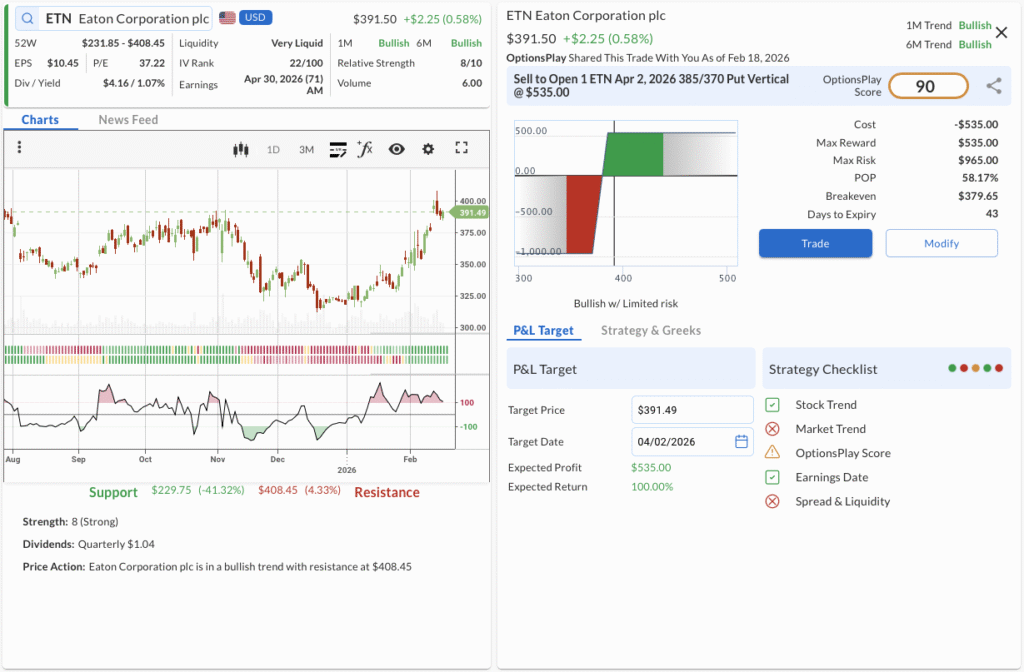
- The Trade: Sell to Open the ETN Apr 02, 2026 385/370 Put Vertical @ $5.35 Credit.
- 🔴 SELL TO OPEN Apr 02, 2026 385 Put @ $14.80
- 🟢 BUY TO OPEN Apr 02, 2026 370 Put @ $9.45
- Trade Metrics: POP: 58.17% | Collect $535.00 per contract vs. a Max Risk of $965.00 (1.8:1).
- The Why: Management recently reaffirmed confident 2026 guidance, citing strong backlogs in aerospace and data centers; we view the recent sell-off as a temporary reaction to conservative outlooks rather than a broken thesis.
- The Technicals: Eaton is maintaining a robust Bullish Trend (1M & 6M) with a Relative Strength of 8/10, currently consolidating above major support at $380, providing a high-probability entry for trend continuation.
- Management:
- Stop Loss: Buy back the spread at $10.70 (100% of credit received).
- Take Profit: Buy back the spread at $2.68 (50% of max gain).
3. AMZN ($201.15) – The Valuation Disconnect

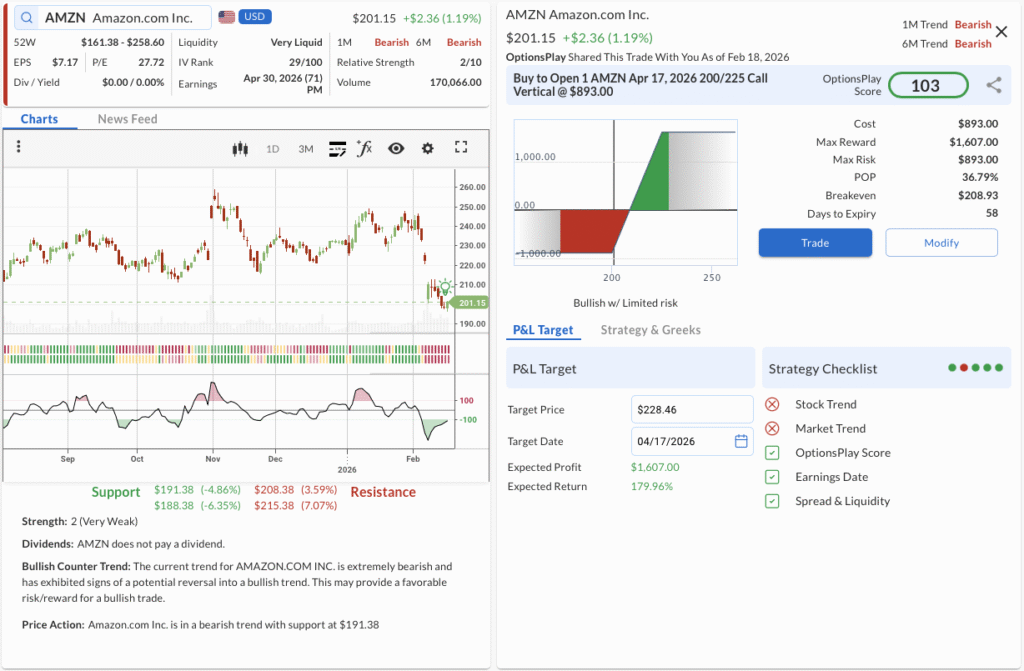
- The Trade: Buy to Open the AMZN Apr 17, 2026 200/225 Call Vertical @ $8.93 Debit.
- 🟢 BUY TO OPEN Apr 17, 2026 200 Call @ $12.08
- 🔴 SELL TO OPEN Apr 17, 2026 225 Call @ $3.15
- Trade Metrics: POP: 36.79% | Pay $893.00 per contract vs. a Max Reward of $1,607.00 (1.8:1).
- The Why: Market fears over $200B in CapEx have driven Amazon’s valuation to multi-year lows, ignoring the acceleration in AWS and ad revenue that analysts believe will drive a significant rerating once sentiment stabilizes.
- The Technicals: While the trend is Bearish (1M & 6M), the RSI has hit historically oversold levels (low 20s) that have previously preceded 60% rallies, signaling a potential capitulation bottom near $200 support.
- Management:
- Stop Loss: Sell the spread at $4.47 (50% loss on premium).
- Take Profit: Sell the spread at $15.63 (75% gain on premium).
CARR, COHR, TSN
OptionsPlay DailyPlay Ideas Menu – February 17th, 2026
💰 The Income Generators (High Probability, Cash Flow)
- CARR: Bullish Put Spread capitalizing on a technical pullback to support as data center cooling demand provides a structural fundamental tailwind.
- COHR: Bullish Put Spread leveraging elevated implied volatility and robust AI-driven margin expansion during a classic technical dip.
🚀 The Growth Seekers (Higher Risk, Max Reward)
- TSN: Long Call betting on improved operational execution and stabilizing protein margins driving a technical breakout.
🛡️ The Portfolio Protectors (Hedges & Bearish Bets)
- (No trades in this category today)
1. CARR ($65.40) – Cooling Demand Tailwind

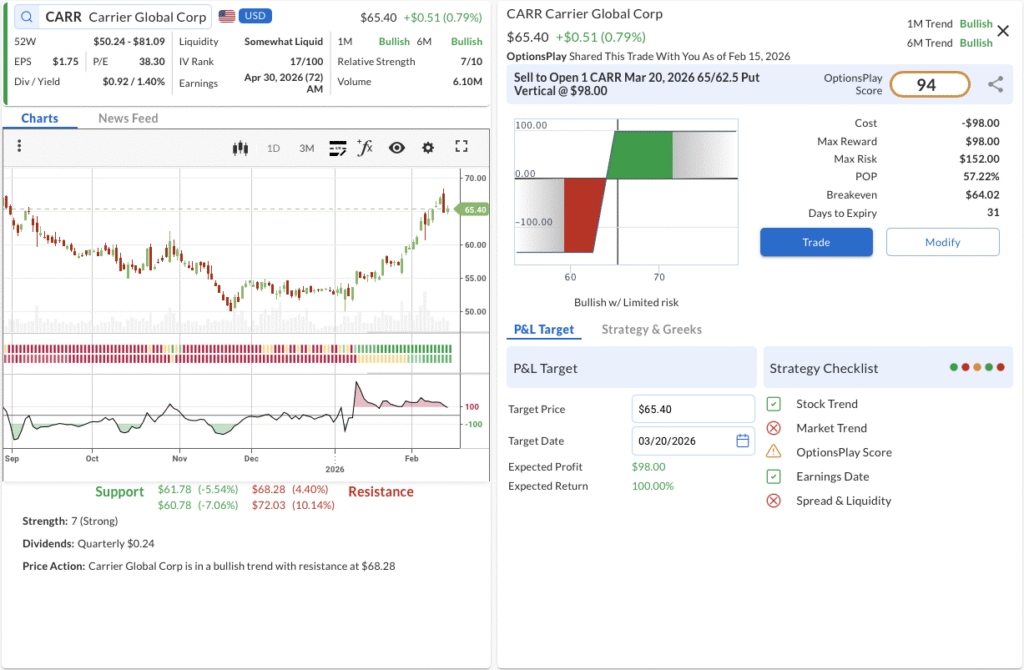
- The Trade: Sell to Open the CARR Mar 20, 2026 65/62.5 Put Vertical @ $0.98 Credit.
- 🟢 BUY TO OPEN Mar 20, 2026 62.5 Put @ $1.15
- 🔴 SELL TO OPEN Mar 20, 2026 65 Put @ $2.13
- Trade Metrics: POP: 57.22% | Collect $98.00 per contract vs. a Max Risk of $152.00 (1.6:1).
- The Why: Carrier Global is successfully focusing on its higher-margin HVAC and climate solutions business, and the surging demand for data center cooling offers a structural growth tailwind that makes this pullback an attractive income-generation entry point.
- The Technicals: The stock is in a confirmed Bullish Trend (1M & 6M) with a Relative Strength of 7/10 and recently broke out above its $60 resistance level, targeting $70 to the upside.
- Management:
- Stop Loss: Buy back the spread at $1.96 (100% of credit received).
- Take Profit: Buy back the spread at $0.49 (50% of max gain).
2. COHR ($217.23) – The AI Hardware Dip

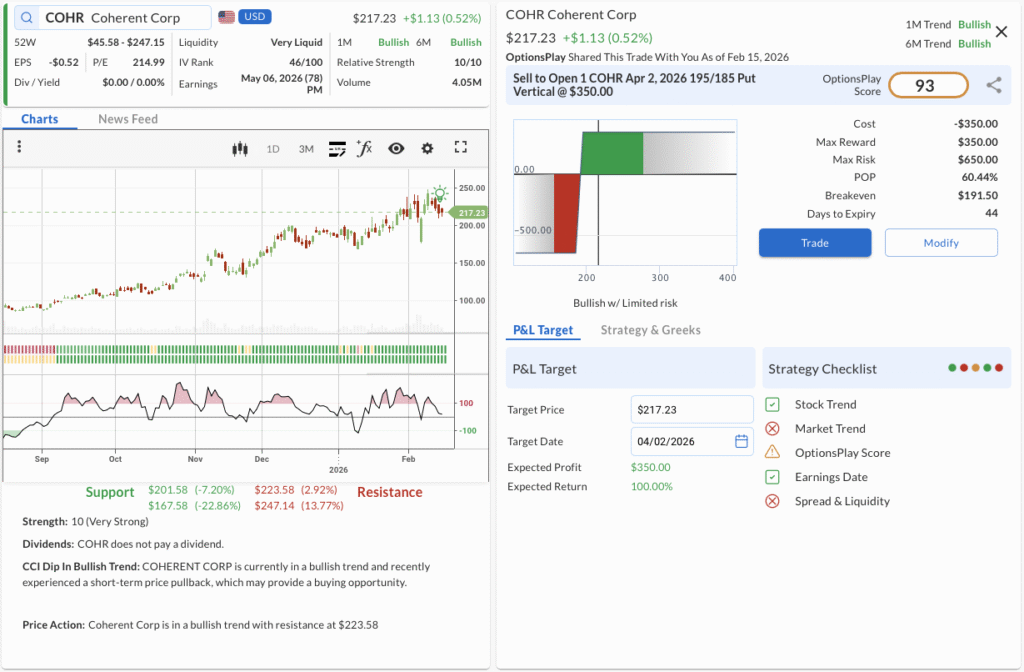
- The Trade: Sell to Open the COHR Apr 2, 2026 195/185 Put Vertical @ $3.50 Credit.
- 🟢 BUY TO OPEN Apr 02, 2026 185 Put @ $11.10
- 🔴 SELL TO OPEN Apr 02, 2026 195 Put @ $14.60
- Trade Metrics: POP: 60.44% | Collect $350.00 per contract vs. a Max Risk of $650.00 (1.9:1).
- The Why: Coherent’s dominant position in optical transceivers for AI data centers is driving robust margin expansion, making this recent technical dip a prime opportunity to sell premium against elevated implied volatility.
- The Technicals: Demonstrating extremely strong Relative Strength (10/10) within a dual 1M and 6M Bullish Trend, the stock is pulling back toward its $201.58 support zone, presenting a classic buying opportunity before its next leg toward $223.58 resistance.
- Management:
- Stop Loss: Buy back the spread at $7.00 (100% of credit received).
- Take Profit: Buy back the spread at $1.75 (50% of max gain).
3. TSN ($63.94) – Stabilizing the Margins

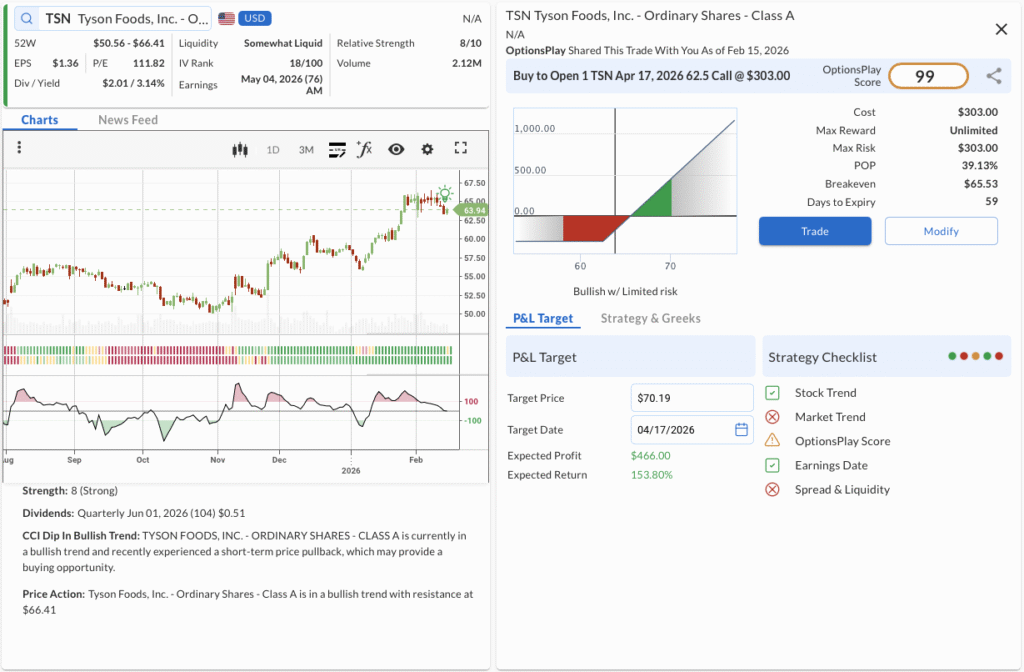
- The Trade: Buy to Open the TSN Apr 17, 2026 62.5 Call @ $3.03 Debit.
- 🟢 BUY TO OPEN Apr 17, 2026 62.5 Call @ $3.03
- Trade Metrics: POP: 39.13% | Pay $303.00 per contract vs. a Max Reward of Unlimited.
- The Why: Tyson Foods is demonstrating improved operational execution and stabilizing protein margins through aggressive cost-cutting initiatives, positioning the stock for a breakout as consumer demand for chicken and beef normalizes.
- The Technicals: Consolidating within a steady Bullish Trend (1M & 6M) and maintaining a solid Relative Strength of 8/10, the stock has pulled back to its $63 support level, providing a strong entry for further upside.
- Management:
- Stop Loss: Sell the call at $1.52 (50% loss on premium).
- Take Profit: Sell the call at $5.30 (75% gain on premium).