

DailyPlay – Portfolio Review – November 10, 2025
DailyPlay Portfolio Review
Our Trades
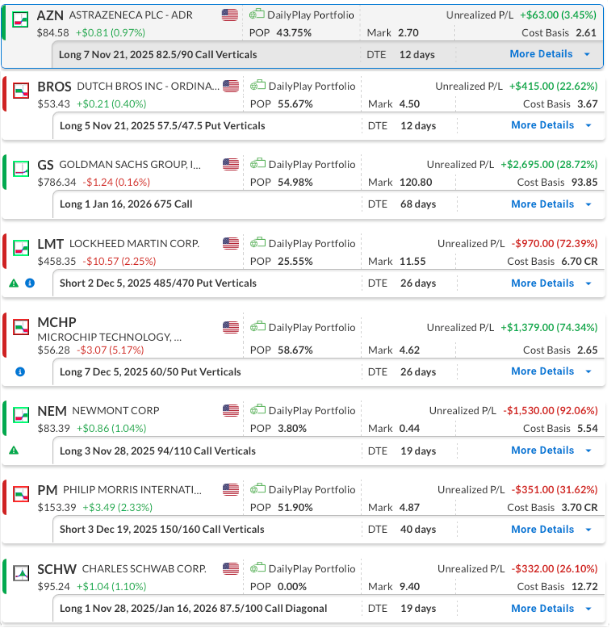
AZN – 12 DTE
Bullish Debit Spread – AstraZeneca PLC (AZN) – The company reported earnings last week, with strong Q3 2025 results. Top-line total revenue was up 11% YTD, supporting full-year high single-digit growth guidance. Bottom-line core EPS rose 15% to $7.04, aligning with low double-digit annual expectations. The position is at a slight gain, but expiration is nearing, so we may need to close early in the week.
BROS – 12 DTE
Bearish Debit Spread – Dutch Bros Inc. (BROS) – This position is showing a solid gain, and we plan to hold for now. The company reported earnings on Wednesday, November 5. Dutch Bros reported Q3 revenue up 25% YoY, with system same shop sales growth of 5.7% and company-operated same shop growth of 7.4%. Management raised 2025 revenue and comp guidance, reaffirmed the 2,029 shop goal by 2029, and highlighted strong early traction from its food program and digital initiatives. With expiration nearing, we may look to close early in the week.
GS – 68 DTE
Bullish Long Call, Goldman Sachs Group, Inc. (GS), we remain bullish on the stock. The cost basis has been reduced by selling a shorter-term call that expired worthless, and we may look to close and capture the gain in the near future as expiration is nearing. If we close in the short term, we may look to open a new longer-term position in GS at a later date.
LMT – 26 DTE
Bullish Credit Spread – Lockheed Martin Corp. (LMT) – This position gave up its recent gains following the company’s strong earnings report. The primary driver appears to be escalating concerns over the ongoing US government shutdown, the longest in history, which has led to delays in defense contracts, budget approvals, and payments for contractors like LMT. We plan to hold the position, expecting that if the shutdown is resolved, the stock could rebound from this week’s decline, though there is a risk we could be stopped out before that happens.
MCHP – 26 DTE
Bearish Debit Spread – Microchip Technology (MCHP) – We established this position ahead of last week’s earnings and plan to maintain it. Shares fell after Q3 results, which met revenue and beat EPS expectations, as weak Q4 guidance signaled ongoing weakness in the analog semiconductor sector.
NEM – 19 DTE
Bullish Debit Spread – Newmont Corporation (NEM) – The stock moved too quickly to the downside for us to close the position, as we only post closing trades overnight. The position is now showing nearly a 100% loss, but with many days still remaining until expiration, we will hold and hope for a recovery given the current situation.
PM – 40 DTE
Bearish Credit Spread – Philip Morris (PM) – Bearish Credit Spread – Philip Morris (PM) – The stock rallied last week on optimism for smoke-free products, but our outlook remains bearish as cigarette volumes decline, transition growth slows, margins compress, and regulations tighten. Technicals show overbought conditions and bearish patterns, indicating potential near-term pullbacks in a volatile sector. We will maintain the position in the short term, with ample time remaining until expiration.
SCHW – 19 DTE & 68 DTE
Bullish Diagonal Debit Spread – Charles Schwab Corp. (SCHW) – We remain bullish on the stock. After realizing gains on our initial long call, we rolled into a higher strike with a longer expiration and later sold a short-term out-of-the-money call to lower our cost basis.
PM

DailyPlay – Opening Trade (PM) – November 07, 2025
PM Bearish Opening Trade Signal
Investment Rationale
Investment Thesis
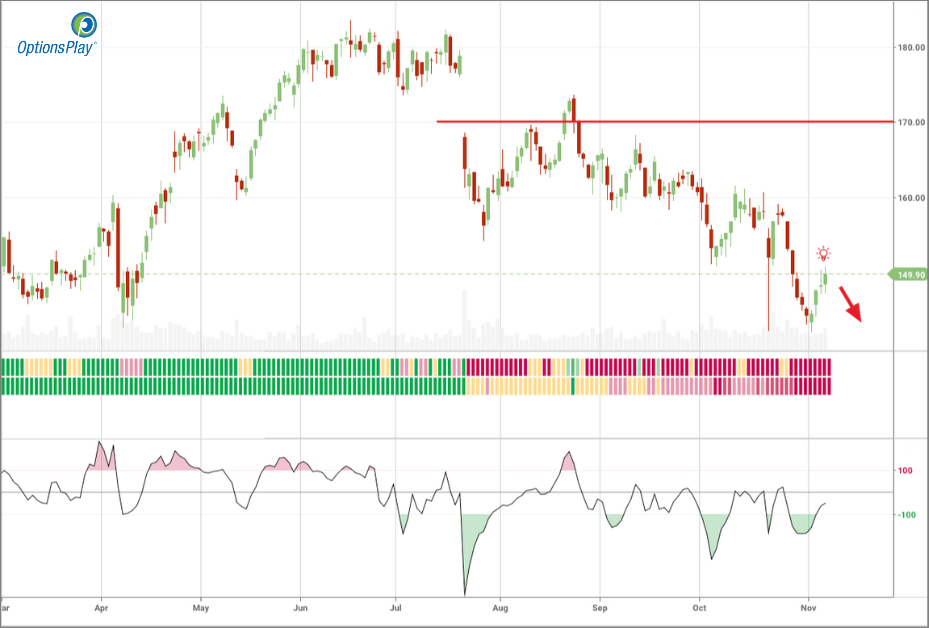
Philip Morris International (PM) continues to display structural weakness following its failed breakout attempts earlier this year and ongoing deterioration in momentum. The company’s premium valuation has become increasingly difficult to justify amid slowing profitability trends and mounting regulatory risks across global tobacco markets. With sentiment softening and price action confirming bearish control, PM presents an appealing opportunity for downside exposure targeting the $130 area. The risk/reward dynamic favors short-biased positioning as the stock remains under heavy technical pressure and faces limited near-term fundamental catalysts.
Technical Analysis
Philip Morris is now trading below its 20-day, 50-day, and 200-day moving averages, underscoring persistent bearish momentum. Both the 20-day and 50-day averages have recently crossed below the 200-day, forming a “death cross” pattern that reinforces the longer-term downtrend. RSI readings around 42 indicate weak but not yet oversold conditions, leaving room for additional downside without an imminent technical reversal. With the stock failing to reclaim any major moving averages, the path of least resistance remains lower, and the next key support zone lies near the $130 target area.
Fundamental Analysis
While Philip Morris maintains a leadership position in the global tobacco sector, its valuation premium over peers looks stretched given slowing profitability and ongoing regulatory challenges. Growth in smoke-free products provides some cushion, but compressed margins and limited operating leverage constrain upside potential.
- Forward PE Ratio: 17.26x vs. Industry Median 15.20x
- Expected EPS Growth: 11.56% vs. Industry Median 7.98%
- Expected Revenue Growth: 7.28% vs. Industry Median 3.74%
- Net Margins: 21.57% vs. Industry Median 32.47%
Options Trade
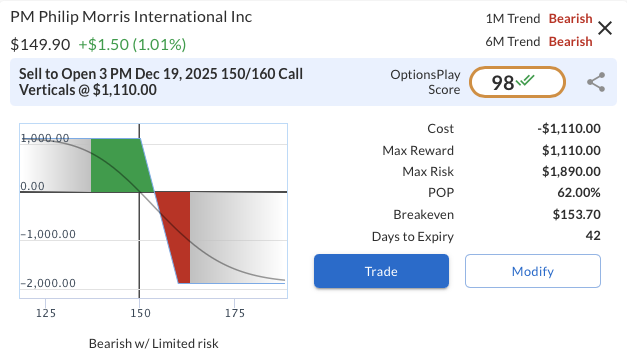
A defined-risk bearish strategy such as a call credit spread offers an efficient way to express a downside view. The proposed trade is to sell the Dec 19, 2025 $150 call and buy the $160 call for a net credit of $3.70. This structure yields a maximum profit of $370 if PM remains below $150 at expiration, with a maximum risk of $630 if PM rises above $160. The trade benefits from time decay and continued weakness below resistance, aligning with the technical setup targeting $130 and offering a favorable risk/reward profile for bearish exposure.
PM – Daily
Trade Details
Strategy Details
Strategy: Short Call Vertical Spread
Direction: Bearish Credit Spread
Details: Sell to Open 3 PM Dec 19 $150/$160 Call Vertical Spreads @ $3.70 Credit per Contract.
Total Risk: This trade has a max risk of $1,890 (3 Contracts x $630) based on a hypothetical $100k portfolio risking 2%. We suggest risking only 2% of the value of your portfolio and divide it by $630 to select the # contracts for your portfolio.
Trend Continuation Signal: This is a bearish trade on a stock that is expected to continue lower over the duration of this trade.
1M/6M Trends: Bearish/Bearish
Relative Strength: 2/10
OptionsPlay Score: 98
Stop Loss: @ $7.40 (100% loss to value of premium)
View PM Trade
Entering the Trade
Use the following details to enter the trade on your trading platform. Please note that whenever there is a multi-leg option strategy, it should be entered as a single trade.
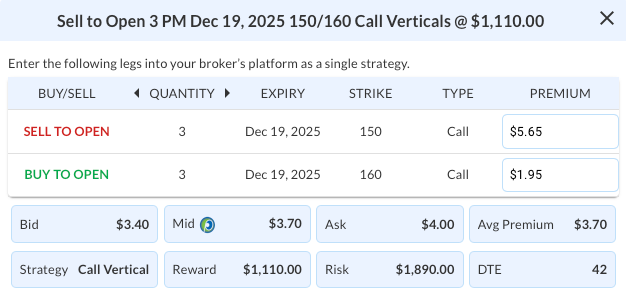
PLEASE NOTE that these prices are based on Thursday’s closing prices. Should the underlying move significantly during the pre-market hours, we will likely adjust the strikes and prices to reflect a more accurate trade entry.
View PM Trade
RIVN

DailyPlay – Closing Trade (RIVN) – November 06, 2025
Closing Trade
- RIVN – 73% loss: Sell to Close 11 Contracts (or 100% of your Contracts) Dec 05 $14 Puts @ $0.46 Credit. DailyPlay Portfolio: By Closing 11 Contracts, we will be collecting $506. We initially opened these 11 contracts on October 31 @ $1.71 Debit. Our loss, therefore, is $125 per contract.
MCHP
DailyPlay – Opening Trade (MCHP) – November 05, 2025
MCHP Bearish Opening Trade Signal
Investment Rationale
Investment Thesis
Microchip Technology Inc. (MCHP) is showing structural underperformance within the semiconductor sector, driven by both cyclical weakness and valuation pressure. The company reports earnings this Thursday, November 6th, after the close, which could act as a catalyst for further downside if results or guidance fail to justify its elevated valuation. While MCHP continues to deliver steady top-line growth, profitability pressures and weakening technical momentum suggest near-term risk outweighs potential reward. As investors favor higher-margin, AI-focused semiconductor names, Microchip’s relative weakness underscores its loss of leadership within the group. The recent break of key support levels reinforces a bearish outlook, positioning the stock for continued downside participation.
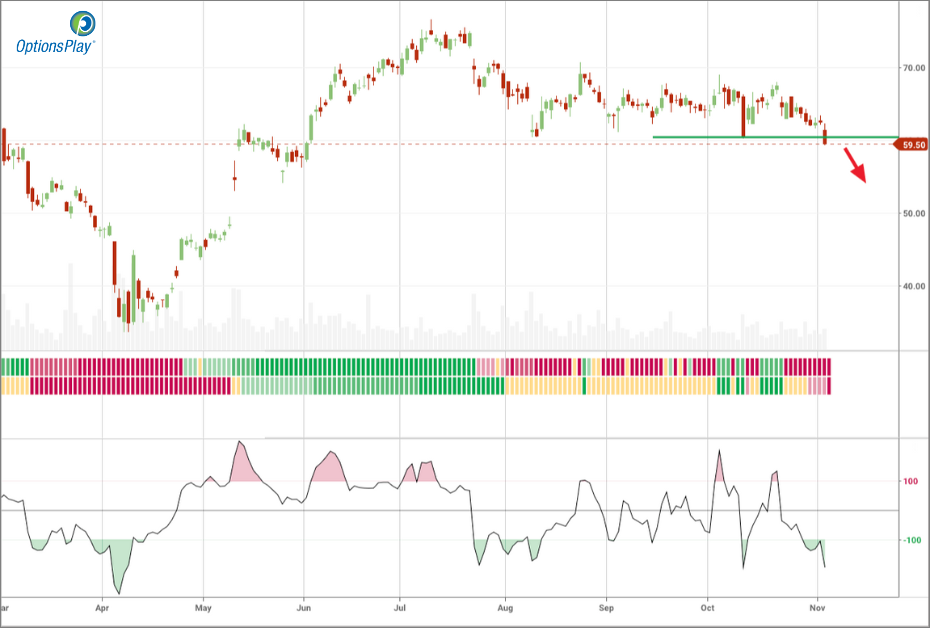
Technical Analysis
Since early August, the 200-day moving average around $60 has acted as key support, holding multiple times before the recent close below $59.50. Trading now beneath its 20-, 50-, and 200-day moving averages, all trending lower, MCHP shows clear bearish momentum. The RSI near 35 signals ongoing weakness but not yet oversold conditions, leaving room for further downside toward the next support area around $50.
Fundamental Analysis
Microchip’s valuation remains elevated relative to peers despite declining margins and slowing profitability. A premium multiple combined with negative net margins creates a challenging setup in a risk-averse environment. Without improvement in earnings quality, MCHP may continue to face valuation pressure and multiple contraction.
- Forward PE Ratio: 42.49x vs. Industry Median 26.41x
- Expected EPS Growth: 40.98% vs. Industry Median 18.61%
- Expected Revenue Growth: 14.54% vs. Industry Median 10.60%
- Net Margins: -3.50% vs. Industry Median 14.16%
Options Trade
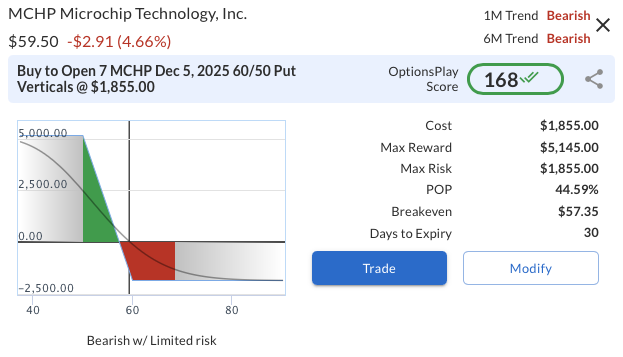
A bearish put vertical spread can be initiated using the Dec 5, 2025, $60/$50 strikes at a net debit of $2.65. This defined-risk position offers a maximum reward of $7.35 versus a maximum loss of $2.65, yielding a risk/reward ratio of approximately 2.8 to 1. The trade benefits from continued downside momentum, particularly if MCHP extends its decline below $60 following earnings, providing a limited-risk way to express a bearish view ahead of a potential volatility-driven move.
MCHP – Daily
Trade Details
Strategy Details
Strategy: Long Put Vertical Spread
Direction: Bearish Debit Spread
Details: Buy to Open 7 MCHP Dec 05 $60/$50 Put Vertical Spreads @ $2.65 Debit per Contract.
Total Risk: This trade has a max risk of $1,855 (7 Contracts x $265) based on a hypothetical $100k portfolio risking 2%. We suggest risking only 2% of the value of your portfolio and divide it by $265 to select the # contracts for your portfolio.
Trend Continuation Signal: This is a bearish trade on a stock that is expected to continue lower over the duration of this trade.
1M/6M Trends: Bearish/Bearish
Relative Strength: 7/10
OptionsPlay Score: 168
Stop Loss: @ $1.33 (50% loss of premium)
View MCHP Trade
Entering the Trade
Use the following details to enter the trade on your trading platform. Please note that whenever there is a multi-leg option strategy, it should be entered as a single trade.

PLEASE NOTE that these prices are based on Tuesday’s closing prices. Should the underlying move significantly during the pre-market hours, we will likely adjust the strikes and prices to reflect a more accurate trade entry.
View MCHP Trade
GOOGL
DailyPlay – Closing Trade (GOOGL) – November 04, 2025
Closing Trade
- GOOGL – 54% gain: Buy to Close 3 Contracts (or 100% of your Contracts) Nov 28 $270/$260 Put Vertical Spreads @ $1.86 Debit. DailyPlay Portfolio: By Closing 3 Contracts, we will be paying $558. We initially opened these 3 contracts on October 30 @ $4.05 Credit. Our gain, therefore, is $657.
$META
DailyPlay – Closing Trade (META) & Portfolio Review – November 03, 2025
Closing Trade
- META – 50% loss: Buy to Close 1 Contract (or 100% of your Contracts) Dec 19 $750/$700 Put Vertical Spreads @ $40.61 Debit. DailyPlay Portfolio: By Closing 1 Contract, we will be paying $4,061. We initially opened this position on October 7 @ $11.10 Debit and rolled it on October 29, realizing a $4.62 gain from the initial trade and entering a new short put at $20.35 per contract. Our net loss, therefore, is $1,564 per contract.
DailyPlay Portfolio Review
Our Trades
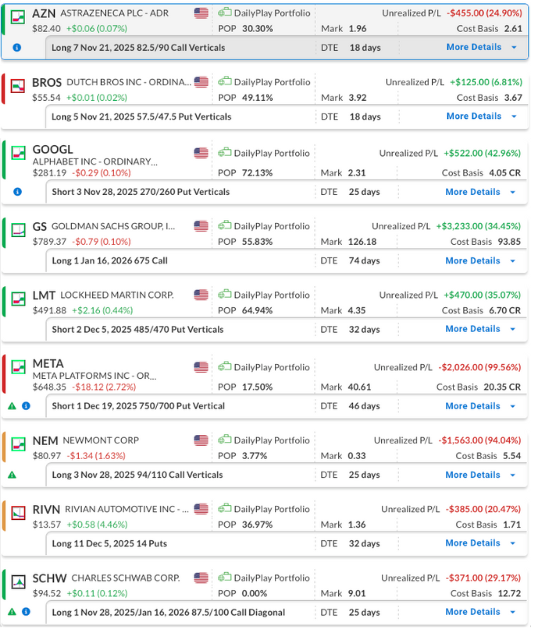
AZN – 18 DTE
Bullish Debit Spread – AstraZeneca PLC (AZN) – This position is currently showing a loss, and we plan to maintain it for now. The company is set to release its earnings report on Thursday, November 6th, before the open.
BROS – 18 DTE
Bearish Debit Spread – Dutch Bros Inc. (BROS) – This position is showing a minor gain, and we plan to hold it for now. The company is approaching its upcoming earnings report on Wednesday, November 5, after the close.
GOOGL – 25 DTE
Bullish Credit Spread – Alphabet Inc. (GOOGL) – Alphabet recently reported earnings that exceeded both revenue and profit expectations. The stock has built up bullish momentum ever since the announcement, and we plan to stay the course.
GS – 74 DTE
Bullish Long Call – Goldman Sachs Group, Inc. (GS) – We remain bullish on the stock over the longer term and intend to hold the position. The cost basis has been reduced by selling a shorter-term call that expired worthless, and we may look to sell another call in the near future.
LMT – 32 DTE
Bullish Credit Spread – Lockheed Martin Corp. (LMT) – This position, which we recently opened, is showing a solid gain. The company’s recent strong third-quarter earnings report reinforced our bullish outlook. We plan to hold the position and may look to roll up if strength continues.
META – 46 DTE
Bullish Credit Spread – Meta Platforms, Inc. (META) – We are closing the position today.
NEM – 25 DTE
Bullish Debit Spread – Newmont Corporation (NEM) – The stock moved too quickly to the downside for us to close the position, as we only post closing trades overnight. The position is now showing nearly a 100% loss, but with many days still remaining until expiration, we will hold and hope for a recovery given the current situation.
RIVN – 32 DTE
Bearish Long Put – Rivian Automotive Inc. (RIVN) – We recently opened this position, which is currently showing a loss, and we plan to maintain it for now. Rivian is set to report earnings on Tuesday, November 4th, after the close, and the setup into the event remains bearish.
SCHW – 25 DTE & 74 DTE
Bullish Diagonal Debit Spread – Charles Schwab Corp. (SCHW) – Schwab reported solid earnings that exceeded both revenue and profit expectations. We remain bullish on the stock. After realizing gains on our initial long call, we rolled into a higher strike with a longer expiration and later sold a short-term out-of-the-money call to lower our cost basis.
RIVN
DailyPlay – Opening Trade (RIVN) – October 31, 2025
RIVN Bearish Opening Trade Signal
Investment Rationale
Investment Thesis
Rivian Automotive, Inc. (RIVN) is set to report earnings on Tuesday, November 4, 2025, after the close, and the setup into the event remains distinctly bearish. Despite a modest delivery beat in the prior quarter, the reduction in full-year delivery guidance signals a more cautious management tone and suggests potential demand headwinds. A series of analyst downgrades and lower price targets in recent weeks have compounded the negative sentiment, with consensus expectations indicating limited upside into the print. Meanwhile, the combination of persistent losses, inventory drawdowns used to sustain deliveries, and the gradual expiration of industry incentives point toward continued structural challenges rather than improvement. Together, these factors suggest the upcoming report could act as a catalyst for renewed downside momentum.
Technical Analysis
The stock continues to exhibit technical deterioration, with price action confirming that bearish momentum remains intact following a brief rebound attempt. The breakdown below key moving averages highlights weakening structure, as shares now trade beneath their 20-day, 50-day, and 200-day moving averages. Notably, inside the OptionsPlay platform yesterday, a “CCI Rally in Bearish Trend” alert was generated, signaling a short-term momentum bounce within a broader downtrend, often a precursor to renewed selling pressure once the relief rally fades. With both the 1-month and 6-month trends turning negative, the technical landscape remains aligned with a sustained bearish bias into earnings.
Fundamental Analysis
Rivian’s fundamentals continue to reflect margin compression, rising costs, and limited operating efficiency despite strong top-line expansion. The narrowed delivery outlook and heavy dependence on inventory reductions underscore imbalance between production and end-market demand. Investor confidence has weakened amid persistent losses and valuation compression risks within the EV sector. The data below highlights the company’s ongoing profitability concerns relative to peers:
- Forward PE Ratio: -4.84x vs. Industry Median 10.65x
- Expected EPS Growth: 19.06% vs. Industry Median 9.70%
- Expected Revenue Growth: 32.58% vs. Industry Median 3.57%
- Net Margins: -69.87% vs. Industry Median 2.92%
These metrics reinforce the warning that, while growth remains elevated, profitability metrics remain negative and unsustainable without a major cost structure improvement.
Options Trade
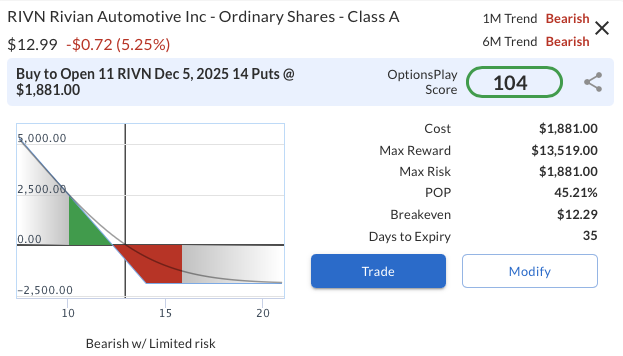
A practical bearish approach is to purchase the RIVN Dec 5, 2025 $14 Put, currently priced around $1.71. This trade provides straightforward downside exposure with clearly defined risk both into and after the earnings release. The maximum loss is capped at the $171 premium per contract, while the position offers meaningful upside potential if the stock continues to weaken. The structure also allows flexibility, traders can capture gains ahead of earnings if selling pressure builds, or maintain the position through the report should bearish momentum and sentiment persist.
RIVN – Daily

Trade Details
Strategy Details
Strategy: Long Put
Direction: Bearish Put
Details: Buy to Open 11 RIVN Dec 05 $14 Puts @ $1.71 Debit per Contract.
Total Risk: This trade has a max risk of $1,881 (11 Contracts x $171) based on a hypothetical $100k portfolio risking 2%. We suggest risking only 2% of the value of your portfolio and divide it by $171 to select the # contracts for your portfolio.
Trend Continuation Signal: This is a bearish trade on a stock that is expected to continue lower over the duration of this trade.
1M/6M Trends: Bearish/Bearish
Relative Strength: 2/10
OptionsPlay Score: 104
Stop Loss: @ $0.86 (50% loss of premium)
View RIVN Trade
Entering the Trade
Use the following details to enter the trade on your trading platform. Please note that whenever there is a multi-leg option strategy, it should be entered as a single trade.

PLEASE NOTE that these prices are based on Thursday’s closing prices. Should the underlying move significantly during the pre-market hours, we will likely adjust the strikes and prices to reflect a more accurate trade entry.
View RIVN Trade
GOOGL

DailyPlay – Opening Trade (GOOGL) & Closing Trade (KR) – October 30, 2025
Closing Trade
- KR – 45% gain: Buy to Close 10 Contracts (or 100% of your Contracts) Nov 07 $67/$70 Call Vertical Spreads @ $0.56 Debit. DailyPlay Portfolio: By Closing 10 Contracts, we will be paying $560. We initially opened these 10 contracts on October 02 @ $1.02 Credit. Our gain, therefore, is $460.
GOOGL Bullish Opening Trade Signal
Investment Rationale
Investment Thesis
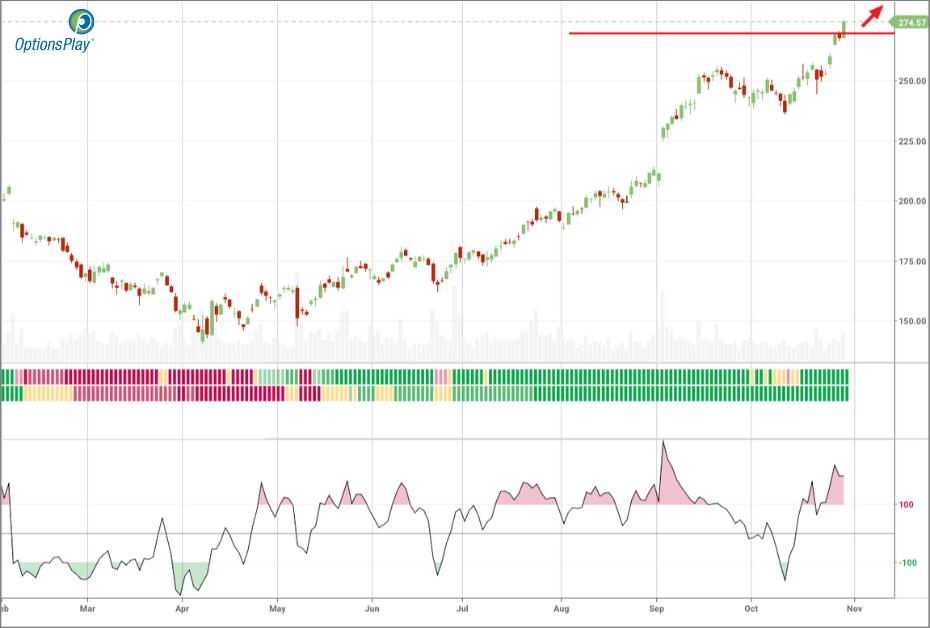
Alphabet Inc. (GOOGL) continues to demonstrate strong momentum following its latest earnings beat, reinforcing confidence in the company’s long-term growth trajectory. The 16% year-over-year revenue increase and 27% earnings surprise highlight the strength of its diversified business model, underpinned by expanding AI-driven demand and resilience in digital advertising. Alphabet’s balanced exposure to both cyclical ad revenue and structural cloud growth positions it as one of the most attractive large-cap technology holdings. With sentiment turning decisively bullish and the stock breaking out to new highs, the setup offers favorable risk/reward for continuation higher toward the $300 level.
Technical Analysis
GOOGL’s breakout above the $270 level confirms strong, sustained bullish momentum following heavy post-earnings buying. The stock remains trades above its 20-day, 50-day, and 200-day moving averages, underscoring robust trend strength across all timeframes. The surge through prior resistance on elevated volume highlights persistent demand and points to the potential for continued upside.
Fundamental Analysis
Alphabet’s Q3 results reinforce its leadership across multiple growth vectors, combining accelerating revenue expansion with disciplined cost management and superior profitability. Despite its dominant position and robust growth profile, GOOGL continues to trade at a valuation broadly in line with the industry, underscoring its relative value appeal.
- Forward PE Ratio: 24.30x vs. Industry Median 24.26x
- Expected EPS Growth: 14.69% vs. Industry Median 14.57%
- Expected Revenue Growth: 11.73% vs. Industry Median 14.85%
- Net Margins: 31.12% vs. Industry Median 8.85%
Options Trade
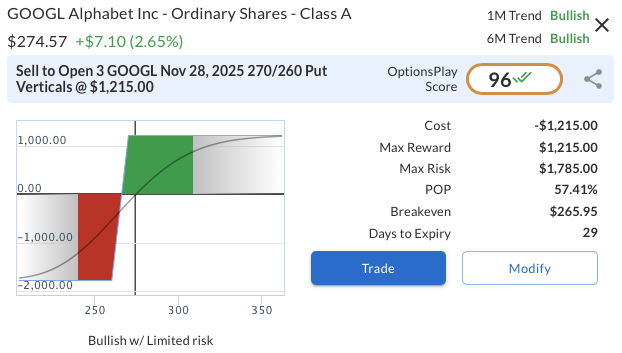
The recommended strategy is to sell the GOOGL Nov 28, 2025 $270/$260 Put Vertical Spread at $4.05, collecting $405 in premium with $595 of defined risk. This bullish credit spread benefits from continued price stability or further upside. The maximum profit of $405 is achieved if GOOGL remains above $270 through expiration, while the maximum loss of $595 occurs below $260. With 29 days to expiry, this setup offers an appealing risk/reward ratio of approximately 1:1.47, providing a balanced combination of defined risk and attractive premium income.
GOOGL – Daily
Trade Details
Strategy Details
Strategy: Short Put Vertical Spread
Direction: Bullish Credit Spread
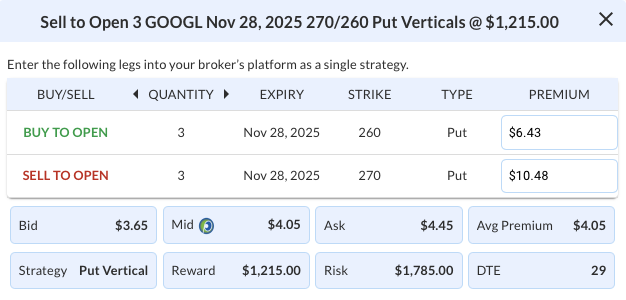
Details: Sell to Open 3 GOOGL Nov 28 $270/$260 Put Vertical Spreads @ $4.05 Credit per Contract.
Total Risk: This trade has a max risk of $1,785 (3 Contracts x $595) based on a hypothetical $100k portfolio risking 2%. We suggest risking only 2% of the value of your portfolio and divide it by $595 to select the # contracts for your portfolio.
Trend Continuation Signal: This is a bullish trade on a stock that is expected to continue higher over the duration of this trade.
1M/6M Trends: Bullish/Bullish
Relative Strength: 10/10
OptionsPlay Score: 96
Stop Loss: @ $8.10 (100% loss to value of premium)
View GOOGL Trade
Entering the Trade
Use the following details to enter the trade on your trading platform. Please note that whenever there is a multi-leg option strategy, it should be entered as a single trade.
PLEASE NOTE that these prices are based on Wednesday’s closing prices. Should the underlying move significantly during the pre-market hours, we will likely adjust the strikes and prices to reflect a more accurate trade entry.
View GOOGL Trade
META
DailyPlay – Adjusting Trade (META) – October 29, 2025
META Bullish Trade Adjustment Signal
Investment Rationale
Adjustment Rationale:
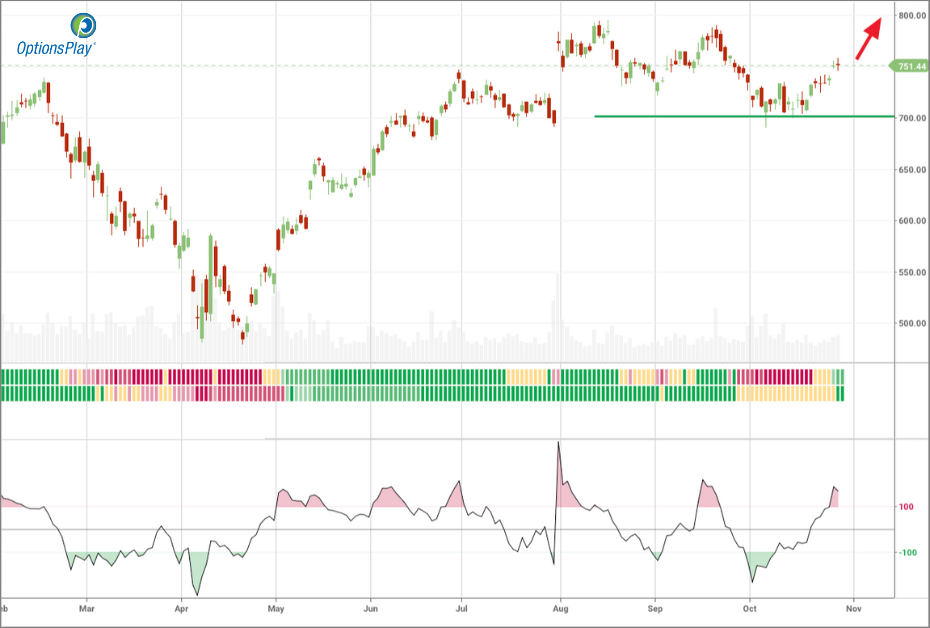
META has rallied meaningfully from our initial entry point, but as we approach earnings later this afternoon, we are going to roll our position up to the Dec 19 $750/$700 Put Vertical to lock in some profits and re-center the trade for a potential continuation of this trade to the upside. We remain constructive on META at 24x forward earnings, especially with revenue growth rates around 17% and net profit margins approaching 40%, META remains one of our top picks within the AI space.
Adjustment Trade
META @ $751.44
Days to Expiration (DTE): 51
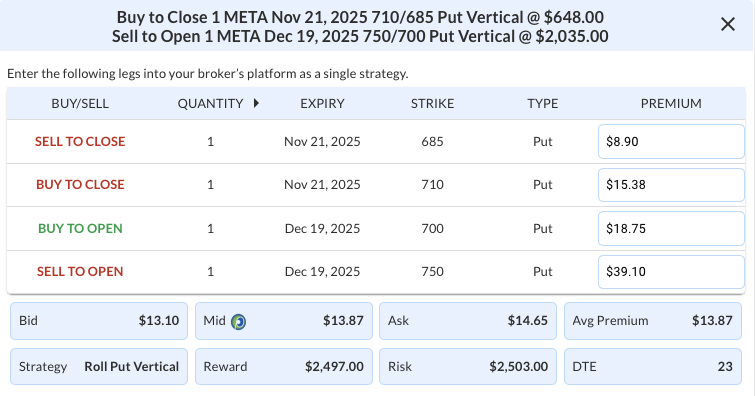
BUY TO CLOSE 1 Nov 21, 2025 $710/$685 Put Vertical Spreads @ $6.48
SELL TO OPEN 1 Dec 19, 2025 $750/$700 Put Vertical Spreads @ $20.35
META – Daily
Trade Details
Strategy Details
Strategy: Rolling a Short Put Vertical up and out
Direction: Resulting in a new Bullish Credit Spread
Details: Buy to Close 1 META Nov 21 $710/$685 Put Vertical Spreads @6.48 Debit and Sell to Open 1 META Dec 19 $750/$700 Put Vertical Spreads @ $20.35 Credit.
Total Risk: The resulting position has a maximum risk of $2,503 (2,965-462), calculated as the new max risk of the spread sold ($2,965) minus the premium gained from the closing the initial trade ($462).
Trend Continuation Signal: This is a bullish trade on a stock that is expected to continue higher over the duration of the trade.
1M/6M Trends: Bullish/Bullish
Relative Strength: 9/10
Stop Loss: @ $40.70 (100% loss to value of premium)
Entering the Trade
Use the following details to enter the trade on your trading platform. Please note that whenever there is a multi-leg option strategy, it should be entered as a single trade.
PLEASE NOTE that these prices are based on Tuesday’s closing prices. Should the underlying move significantly during the pre-market hours, we will likely adjust the strikes and prices to reflect a more accurate trade entry.
LMT
DailyPlay – Opening Trade (LMT) – October 28, 2025
LMT Bullish Opening Trade Signal
Investment Rationale
Investment Thesis
Lockheed Martin Corp. (LMT) remains a core beneficiary of escalating global defense spending, supported by ongoing geopolitical instability and rising commitments to military modernization among NATO and allied nations. The company’s strong Q3 results Third Quarter 2025 earnings report on October 21st, featuring revenue of $18.6 billion and an upward revision in full-year EPS guidance to $22.15–$22.35, reaffirm confidence in its resilient order book and execution strength. With a diversified defense portfolio spanning aeronautics, missiles, and space systems, LMT offers a compelling long-term value opportunity as defense budgets continue to expand globally.
Technical Analysis
After rallying on Q3 earnings, LMT reclaimed its 50-day moving average near $478, which now serves as a solid support level. The 50-day recently crossed above the 200-day, underscoring renewed bullish momentum. With RSI sitting midrange at 46, the setup leaves room for further upside. Current trading behavior suggests steady accumulation and improving performance relative to the S&P 500.
Fundamental Analysis
LMT trades at a steep valuation discount relative to its industry peers despite superior earnings growth expectations. The company’s long-term contracts, strong free cash flow generation, and elevated backlog position it well for sustained dividend growth and share repurchases. Continued global demand for air defense and tactical systems should underpin top-line expansion through 2026.
- Forward PE Ratio: 16.63x vs. Industry Median 33.85x
- Expected EPS Growth: 32.80% vs. Industry Median 12.30%
- Expected Revenue Growth: 4.29% vs. Industry Median 9.54%
- Net Margins: 5.73% vs. Industry Median 7.94%
Options Trade
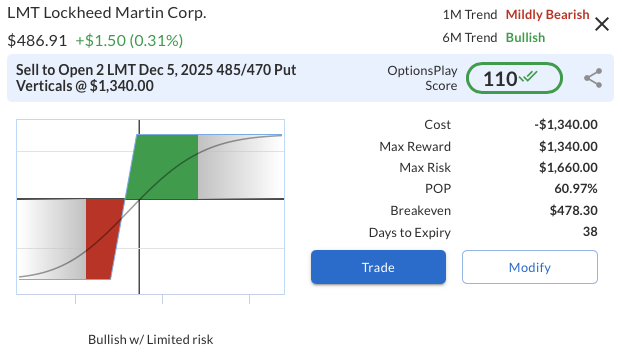
Sell to Open 1 LMT Dec 5, 2025 485/470 Put Vertical @ $6.70 Credit. This bullish put vertical spread involves selling the 485 strike put and buying the 470 strike put to collect a net credit of $670, defining a maximum risk of $830. The setup offers a favorable risk/reward profile of approximately 0.8:1, with a breakeven point at $478.30. The position benefits from time decay and stable or rising prices, allowing for full profit potential if LMT remains above $485 through expiration. Given the stock’s constructive technical outlook and supportive fundamentals, this spread represents a high-probability income trade that aligns with continued strength into year-end.
LMT – Daily

Trade Details
Strategy Details
Strategy: Short Put Vertical Spread
Direction: Bullish Credit Spread
Details: Sell to Open 2 LMT Dec 05 $485/$470 Put Vertical Spreads @ $6.70 Credit per Contract.
Total Risk: This trade has a max risk of $1,660 (2 Contracts x $830) based on a hypothetical $100k portfolio risking 2%. We suggest risking only 2% of the value of your portfolio and divide it by $830 to select the # contracts for your portfolio.
Trend Continuation Signal: This is a bullish trade on a stock that is expected to continue higher over the duration of this trade.
1M/6M Trends: Mildly Bearish/Bullish
Relative Strength: 3/10
OptionsPlay Score: 110
Stop Loss: @ $13.40 (100% loss to value of premium)
View LMT Trade
Entering the Trade
Use the following details to enter the trade on your trading platform. Please note that whenever there is a multi-leg option strategy, it should be entered as a single trade.

PLEASE NOTE that these prices are based on Monday’s closing prices. Should the underlying move significantly during the pre-market hours, we will likely adjust the strikes and prices to reflect a more accurate trade entry.