

DailyPlay – Portfolio Review – February 15, 2024
DailyPlay Portfolio Review
Investment Rationale
After Tuesday’s CPI print and a volatile trading session, markets have already started to shrug off rate cut expectations. Despite bond markets now shifting a rate cut in July, the S&P looks ready to reclaim $5,000 again and continue grinding higher. Despite Tuesday’s selloff having hurt our long positions, we are going to maintain our current positions and look for equities to continue its melt-up.
Our Trades
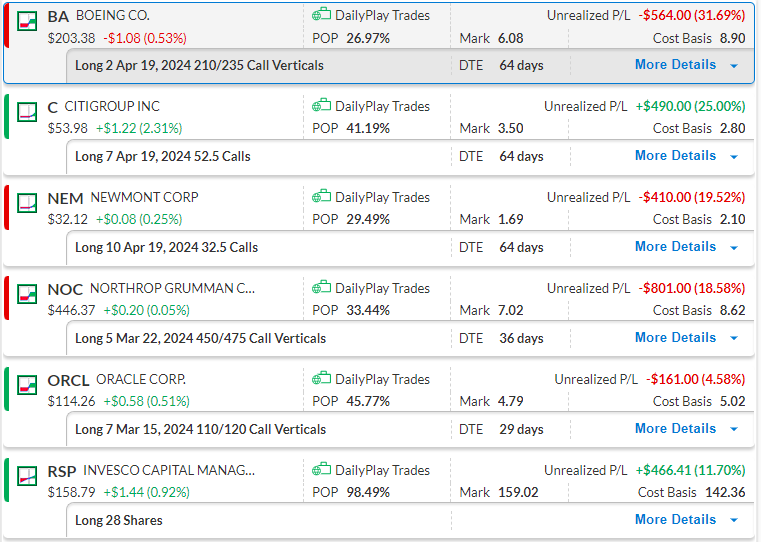
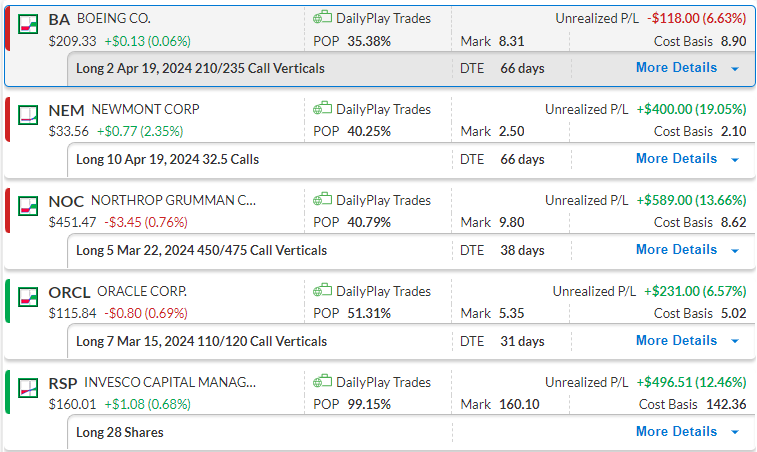
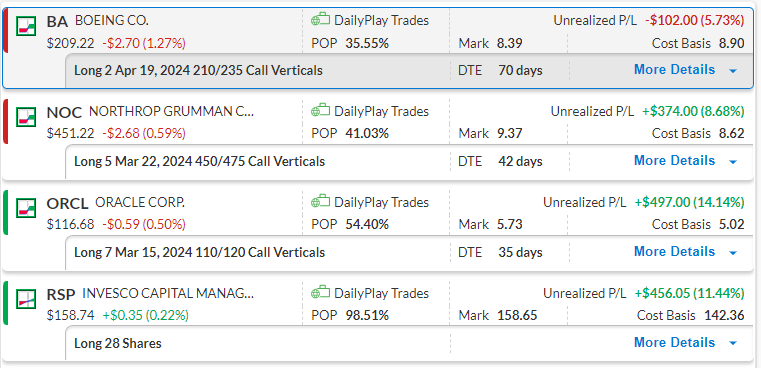
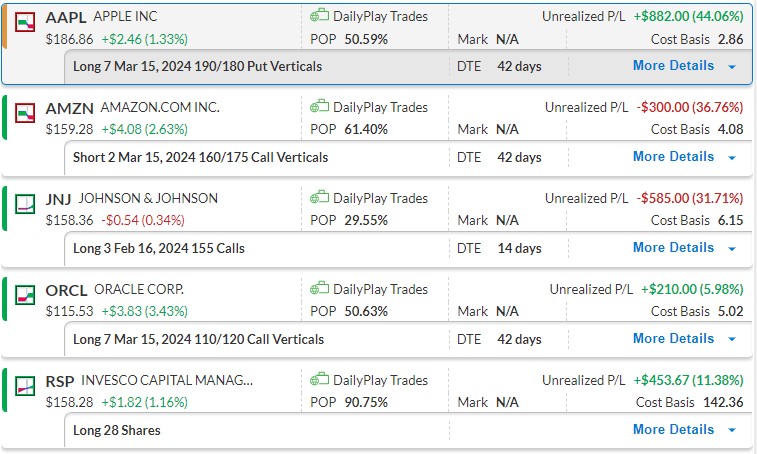
BA
Bullish Debit Spread. Boeing continues to consolidate but stays within a trading range. Our trade is structured to profit from a potential breakout above this range towards its $240 gap fill. We are still waiting for the breakout and will monitor this position closely.
C
Bullish Calls. This trade was opened yesterday and is trending well after our initial entry. If C gets above $55, we will look to add further exposure to this trade by opening more contracts.
NEM
Bullish Calls. This new trade was established as an attempt to call a bottom in Newmont. With the drop in the S&P500 and equities, this trade closed lower yesterday and we expect to see a speedy recovery to the upside.
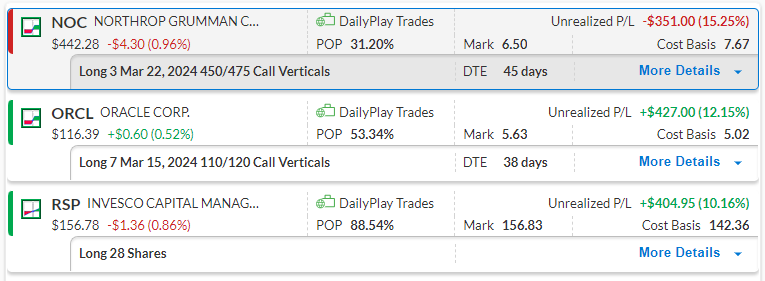
NOC
Bullish Debit Spread. We added another 2 contracts to our NOC trade as this trade was performing well as the price has broken above the $450 level. We expect NOC to bounce back above this level and to continue higher.
ORCL
Bullish Debit Spread. This trade was essentially a free debit spread as we had rolled up and out from the previous ORCL trade. It is currently trading around break-even and we expect a continued bullish trend.
RSP
Long-term play on the S&P Equal Weighted Index. Price consolidated in the last 2 weeks but showing bullish price action at the $155 level. We will continue to hold this position.
$C

DailyPlay – Opening Trade (C) – February 14, 2024
C Bullish Opening Trade Signal
Investment Rationale
Citigroup has been working on a turnaround for nearly 20 years. There has been a revolving door of CEOs, but Jane Fraser has seemed to catch investor’s attention finally. As they shed unprofitable businesses and focus on generating revenue growth, the stock has not underperformed over the last 10 months. Signs that a potential turnaround is starting to take shape, and an opportunity to start adding a small position to a portfolio.
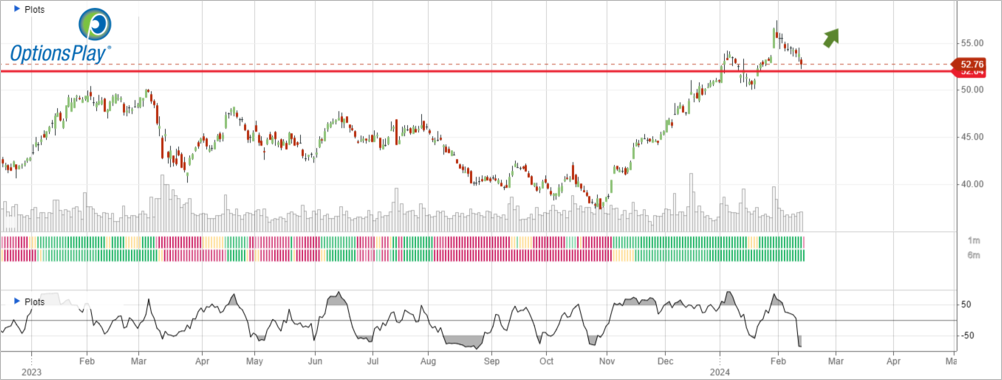
Technical Analysis
Citigroup has traded within a band of roughly $35 and $80 over the past 12 years, after tumbling 98% after the financial crisis. Its most recent visit to the bottom of the trading range was in Oct of last year. And after clearing above a $52 resistance level, yesterday’s selloff brings us back to this $52 level that now acts as support. Adding a small position provides an extremely attractive risk/reward. A break below $52 would trigger a stop loss and a small amount risked, while our upside target is $68 initially and $80 as extended targets.
C – Daily
Fundamental Analysis
The story gets even more attractive when we take a look at valuations. C currently trades at only 0.6x book value, while its peers typically trade at twice or three times that. Additionally, I am quite comfortable as an investor buying into a bank that is trading at 7x forward earnings. I feel a lot more confident that there will be less likely to be a significant downside with such rock-bottom valuations.
C Trade Details
Strategy Details
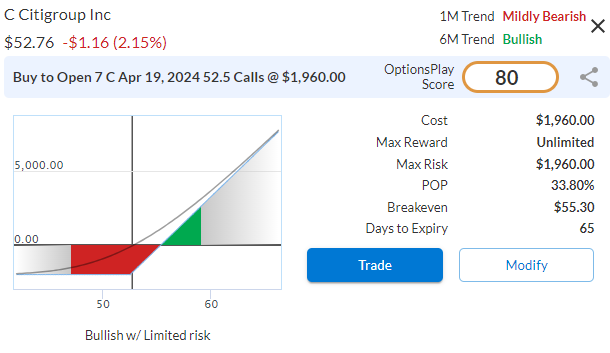
Strategy: Long Call
Direction: Bullish Calls
Details: Buy to Open 7 Contracts April 19th $52.50 Calls @ $2.80 Debit per contract.
Total Risk: This trade has a max risk of $1,960 (7 Contracts x $280) based on a hypothetical $100,000 portfolio risking 2%. We suggest using 2% of your portfolio value and divide it by $280 to select the # contracts for your portfolio.
Trend Continuation Signal: This is a bullish trade on a stock that is trading in a bullish trend and is expected to bounce higher from this level.
1M/6M Trends: Mildly Bearish/ Bullish
Relative Strength: 9/10
OptionsPlay Score: 80
Stop Loss: @ $1.40 Credit. (50% loss of premium)
Entering the Trade
Use the following details to enter the trade on your trading platform. Please note that whenever there is a multi-leg option strategy, it should be entered as a single trade.
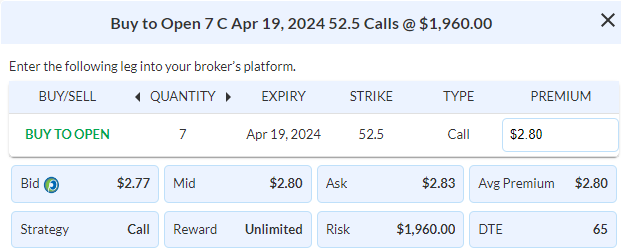
Please note that these prices are based on Tuesday’s closing prices. Should the underlying move significantly during the pre-market hours, we will likely adjust the strikes and prices to reflect a more accurate trade entry.
DailyPlay – Portfolio Review – February 13, 2024
DailyPlay Portfolio Review
Investment Rationale
After reviewing our Technical, Fundamental, and Liquidity Scans, we do not have any new positions that we are looking to establish as of today. We are watching a few symbols such as HD, DELL, and U for potential entries over the next few trading sessions.
Our Trades
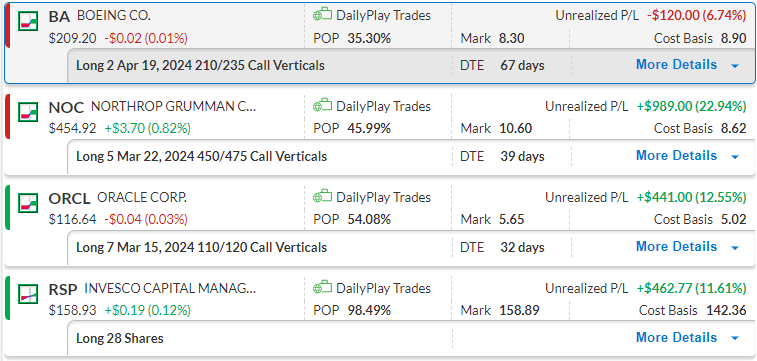
BA
Bullish Debit Spread. Boeing continues to consolidate but stays within a trading range. Our trade is structured to profit from a potential breakout above this range towards its $240 gap fill. We are still waiting for the breakout and will monitor this position closely.
NEM
Bullish Calls. A new trade established yesterday as an attempt to call a bottom in Newmont. The stock rallied significantly yesterday, putting our calls up around 20% so far. If this rally continues for a couple of more sessions, we will look to add further exposure and ride this rally up into the low $40’s.
NOC
Bullish Debit Spread. We added another 2 contracts to our NOC trade as this trade was performing well as price has broken above the $450 level. It is one of our strategies to add more exposure to winning trades, as we did with NOC.
ORCL
Bullish Debit Spread. Our ORCL trade is up by another few percentage points this week, with the next major resistance level is at $120. This trade was essentially a free debit spread as we had rolled up and out from the previous ORCL trade.
RSP
Long-term play on the S&P Equal Weighted Index. Price consolidated in the last 2 weeks but showing bullish price action at the $155 level. We will continue to hold this position.
$NEM
DailyPlay – Opening Trade & Portfolio Review – February 12, 2024
DailyPlay Portfolio Review
Our Trades
BA
Bullish Debit Spread. We entered a small position to see if Boeing has bottomed here. Looking for a breakout to close its $245 gap.
NOC
Bullish Debit Spread. After adding another 2% exposure, NOC is breaking out to new recent highs and looks closer to closing the gap that is our target.
ORCL
Bullish Debit Spread. We are waiting for a breakout above $118 towards the $128 highs.
RSP
Long-term play on the S&P Equal Weighted Index. Price consolidated in the last 2 weeks but showing bullish price action at the $155 level. We will continue to hold this position.
NEM Bullish Opening Trade Signal
Investment Rationale
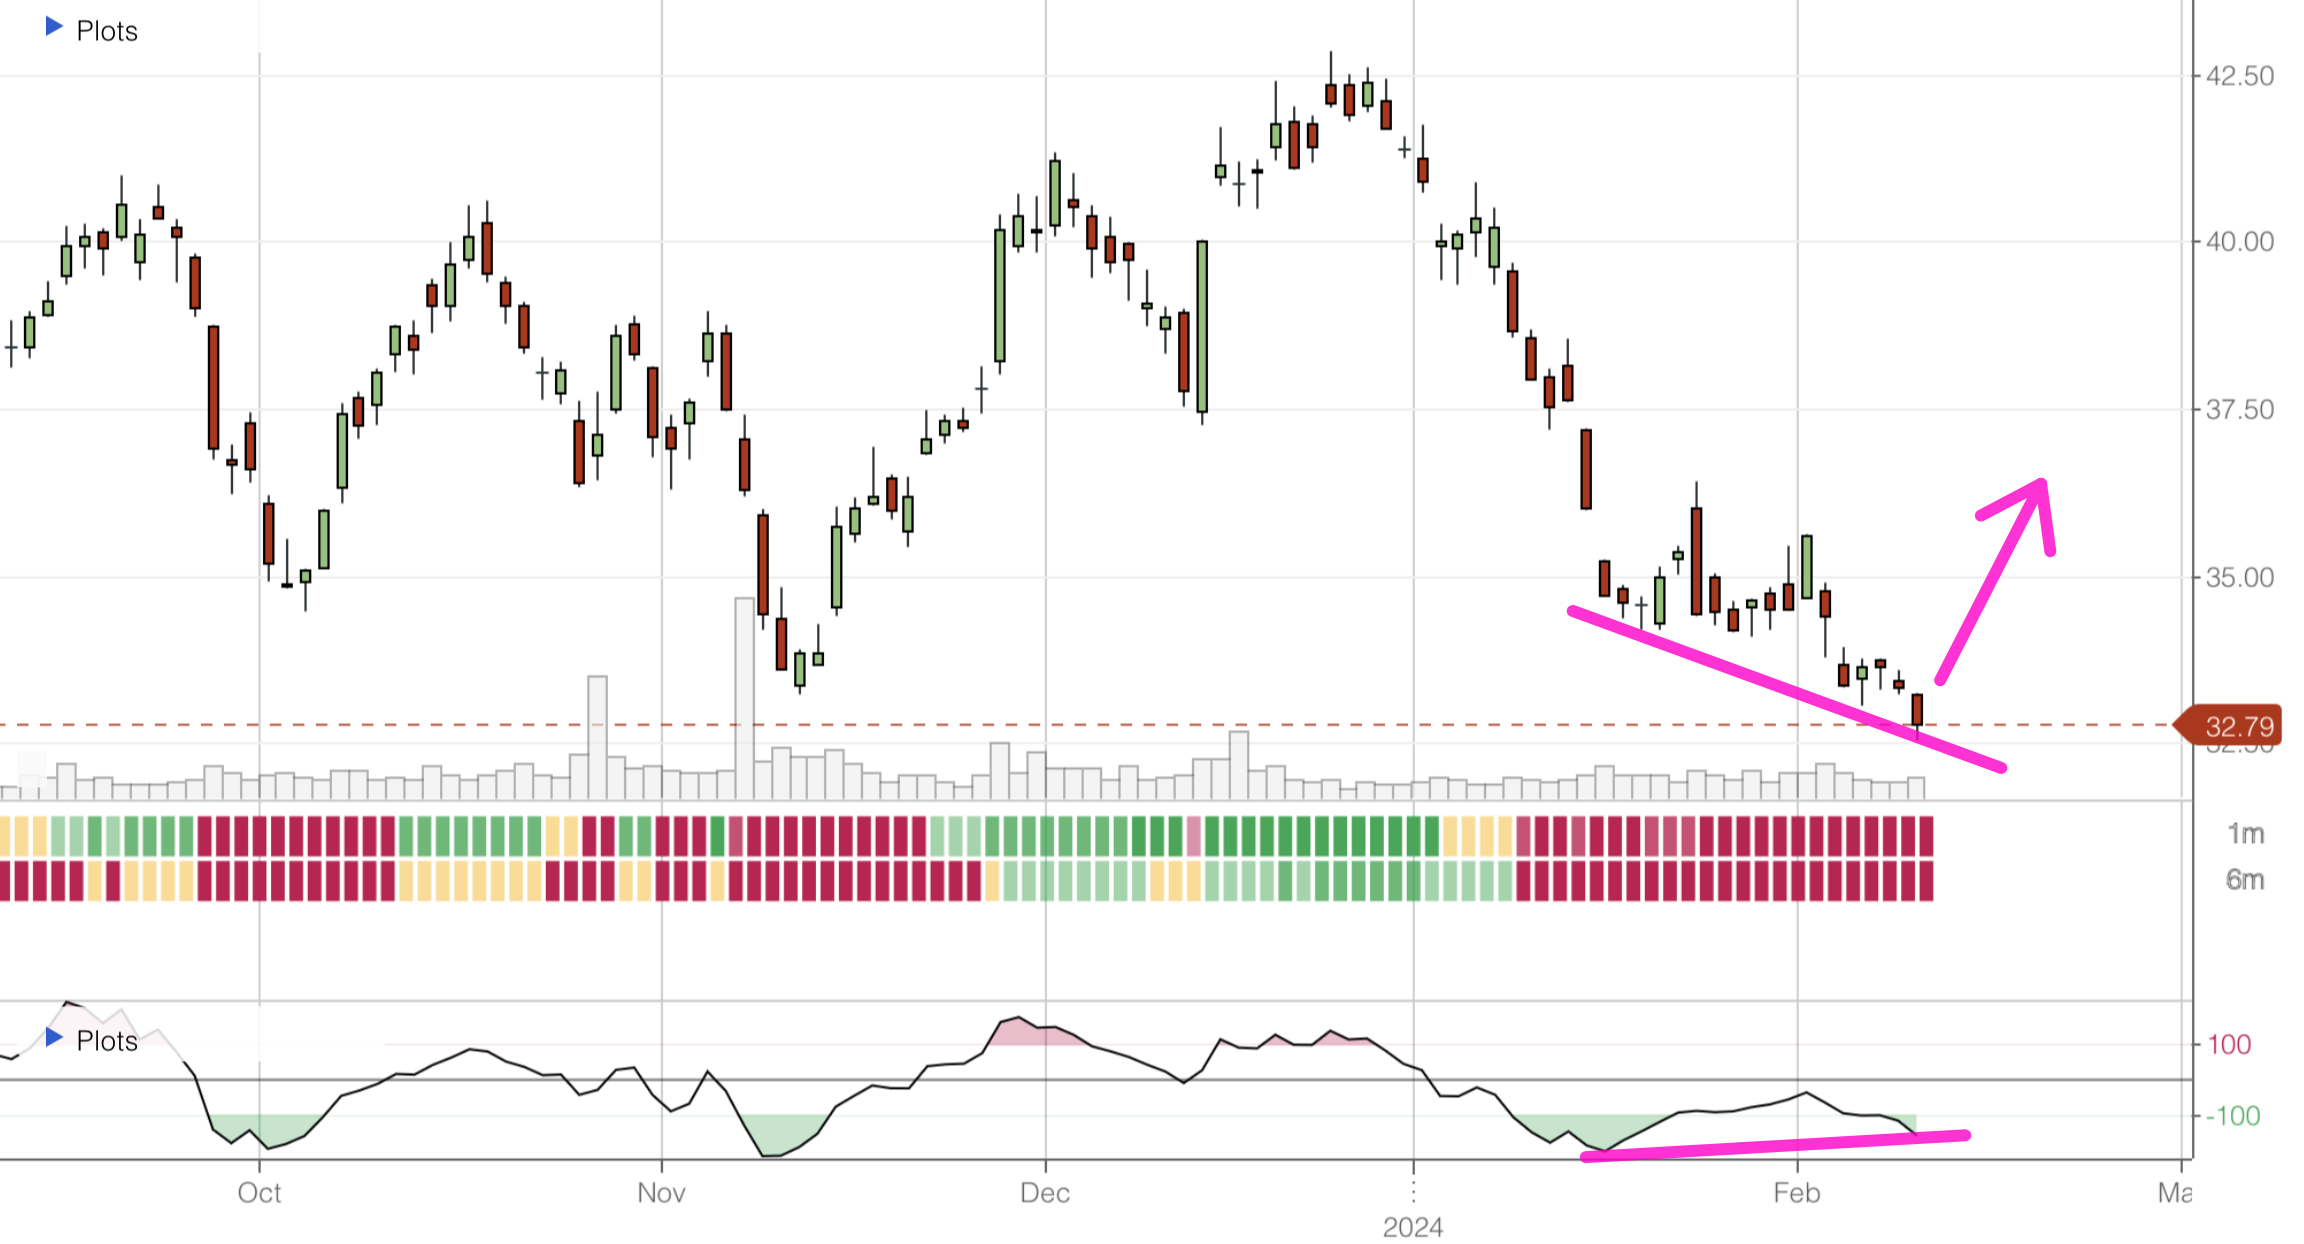
Gold mining has had a tough year to the year, tumbling 13% to start 2024, while the equity markets raced to new all-time highs. However, the selloff has gotten so bad, there are some signs of exhaustion and a potential opportunity to play for a bounce. Gold itself continues to trade within spitting dance of all-time highs but miners have not held up as well. As NEM trades to a new 52-week low, I see this as an opportunity to add a small amount of exposure in gold miners.
Technical Analysis
There is no way to sugarcoat it, NEM’s chart looks terrible. However, signs that there is exhaustion on the selloff suggests that we may have potentially hit rock bottom. Since the stock made 52-week low in Aug 2022, subsequent lows made on the weekly chart has been coupled with positive divergence. Momentum no longer confirms new lows in price, which suggests a potential for a bounce. We also see this on the Daily Chart as well. Even a bounce back to its Dec highs represents a 30% rally, making the risk/reward quite attractive.
NEM – Daily
Fundamental Analysis
NEM’s selloff has pushed its valuation to under 15x forward earnings, despite analysts expecting revenue growth of 50% growth and 40% in EPS. This makes the valuation compelling when attempting to “catch a falling knife.” The downside in my opinion is limited due to its valuation and nearly 5% dividend yield, which provides further support for this stock.
NEM Trade Details
Strategy Details
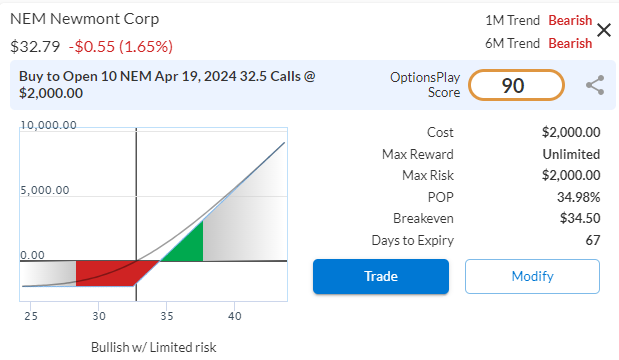
Strategy: Long Call
Direction: Bullish Calls
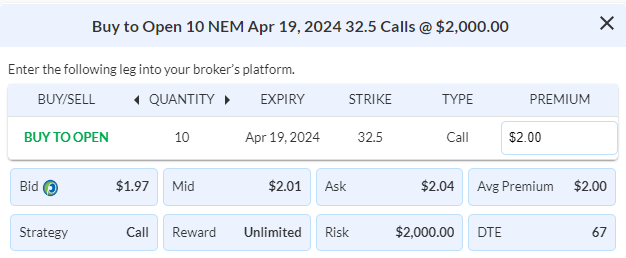
Details: Buy to Open 10 Contracts April 19th $32.50 Calls @ $2.00 Debit per contract.
Total Risk: This trade has a max risk of $2,000 (10 Contracts x $200) based on a hypothetical $100,000 portfolio risking 2%. We suggest using 2% of your portfolio value and divide it by $200 to select the # contracts for your portfolio.
Counter Trend Signal: This is a bullish trade on a stock that found support and is expected to bounce higher.
1M/6M Trends: Bearish/Bearish
Relative Strength: 2/10
OptionsPlay Score: 90
Stop Loss: @ $1.00 Credit. (50% loss of premium paid)
Entering the Trade
Use the following details to enter the trade on your trading platform. Please note that whenever there is a multi-leg option strategy, it should be entered as a single trade.
Please note that these prices are based on Wednesday’s closing prices. Should the underlying move significantly during the pre-market hours, we will likely adjust the strikes and prices to reflect a more accurate trade entry.
DailyPlay – Portfolio Review – February 9, 2024
DailyPlay Portfolio Review
Investment Rationale
Based on the criteria of our scans, no new trading opportunities have crossed our radar for today. Our four trades are performing according to expectations and we will continue to monitor them for any needed adjustments.
Our Trades
BA
Bullish Debit Spread. This trade was only placed two days ago and a bounce higher is to be expected over the next few trading days.
NOC
Bullish Debit Spread. We added another 2 contracts to our NOC trade as this trade was performing well as price has broken above the $450 level. It is one of our strategies to add more exposure to winning trades, as we did with NOC.
ORCL
Bullish Debit Spread. Our ORCL trade is up by another few percentage points this week, with the next major resistance level is at $120. This trade was essentially a free debit spread as we had rolled up and out from the previous ORCL trade.
RSP
Long-term play on the S&P Equal Weighted Index. Price consolidated in the last 2 weeks but showing bullish price action at the $155 level. We will continue to hold this position.
$NOC
DailyPlay – Opening Trade (NOC) – February 8, 2024
NOC Bullish Opening Trade Signal
Investment Rationale
Our bullish NOC trade is at 36% profit based on pre-market data, and we will, therefore, add more exposure to this winning position. When managing our portfolio of trades, we always ensure to cut our losses quickly, like with the AMZN trade, and to add to winners. We do this to increase our odds of profitability by ensuring that our losses remain small and by continuing to put ourselves in opportunities to potentially hit home runs with winning trades such as with NOC. As NOC has broken out above its $450 resistance level, we’re more confident that it will continue higher to fill the gap at $463 which is our next upside target.
As such, we will be adding another 2 contracts to our existing 3 contracts, based on an account size of $100k. We will keep the strike prices and expiry dates the same.
NOC – Daily
NOC Trade Details
Strategy Details
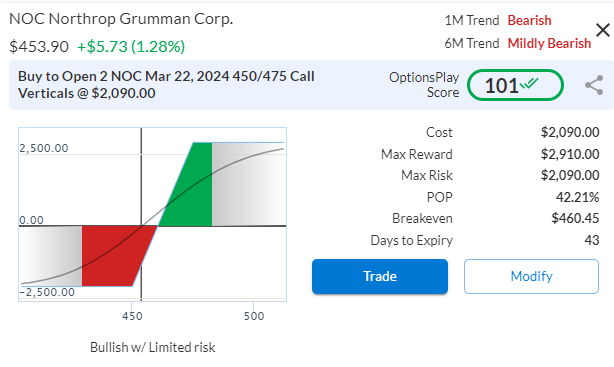
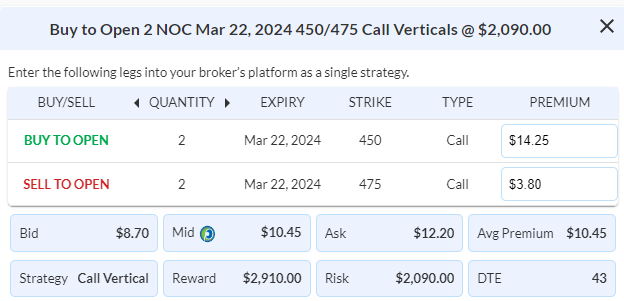
Strategy: Long Call Vertical Spread
Direction: Bullish Debit Spread
Details: Buy to Open 2 Contracts March 22nd $450/$475 Call Vertical Spreads @ $10.45 Debit per contract.
Total Risk: This trade has a max risk of $2,090 (2 Contracts x $1,045) based on a hypothetical $100,000 portfolio risking 2%. We suggest using 2% of your portfolio value and divide it by $1,045 to select the # contracts for your portfolio.
Counter Trend Signal: This is a bullish trade on a stock that broke above an area of resistance.
1M/6M Trends: Bearish/Bearish
Relative Strength: 3/10
OptionsPlay Score: 101
Stop Loss: @ $5.23 Credit. (50% loss of the premium)
Entering the Trade
Use the following details to enter the trade on your trading platform. Please note that whenever there is a multi-leg option strategy, it should be entered as a single trade.
Please note that these prices are based on Wednesday’s closing prices. Should the underlying move significantly during the pre-market hours, we will likely adjust the strikes and prices to reflect a more accurate trade entry.
$BA
DailyPlay – Opening Trade (BA) – February 7, 2024
BA Bullish Opening Trade Signal
Investment Rationale
Boeing simply has had a terrible few years and just can’t seem to catch a break. And the incident on an Alaskan Airlines 737 Max 9 in January was simply rubbing salt into the wound. While the task of turning around Boeing requires a culture change, I see reasons to be bullish while many investors may be losing faith. I believe that we have an opportunity to add Boeing to a portfolio when the risk/reward looks very attractive.
Technical Analysis
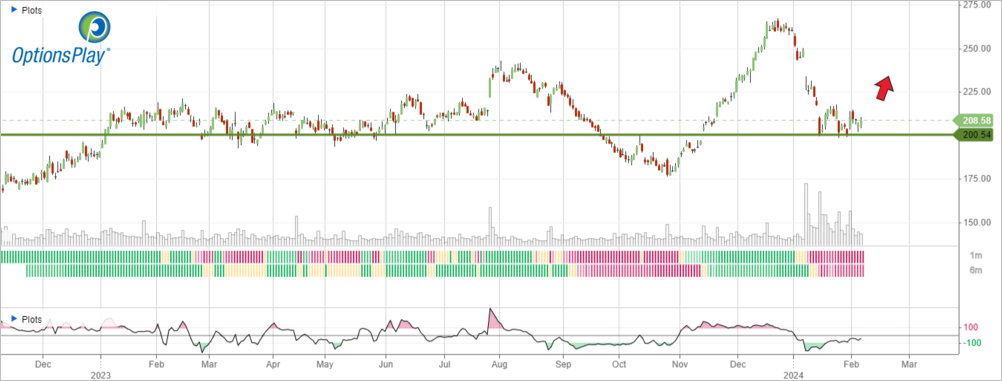
After breaking out to new multi-year highs above $240 at the end of last year, the stock came crashing down after the Jan 5 incident. However, now that over 90% of the grounded 737 Max 9’s have already returned to service, we have likely seen the bottom for BA at $200. Momentum has also turned positive and has the potential to fill its gap back up to $240.
BA – Daily
Fundamental Analysis
With the expectation that BA will turn a profit in FY 2024 and revenue double-digit revenue growth, BA’s fundamental picture is starting to turn around since its 2018 decline. While BA is not out of the woods yet, it is likely that the 737 Max 9 will likely not require reengineering and return to service quickly. This would allow BA to focus on fixing its culture of safety, executing on its huge backlog, and returning to profitability.
BA Trade Details
Strategy Details
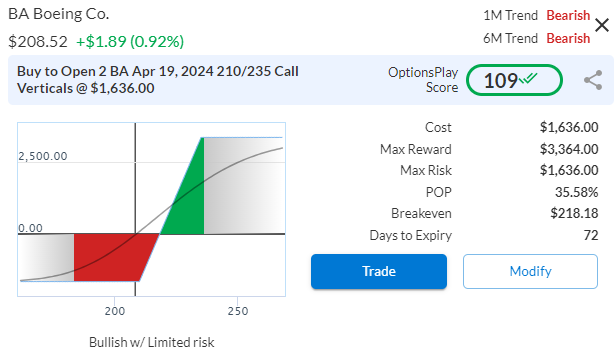
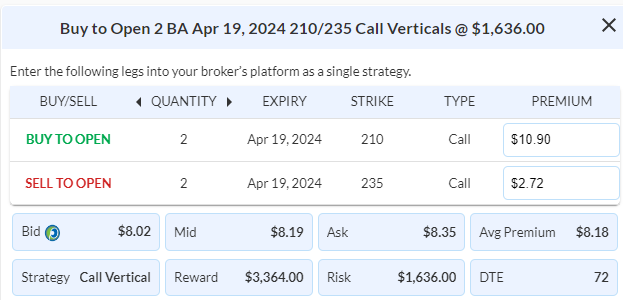
Strategy: Long Call Vertical Spread
Direction: Bullish Debit Spread
Details: Buy to Open 2 Contracts April 19th $210/$235 Call Vertical Spreads @ $8.18 Debit per contract.
Total Risk: This trade has a max risk of $1,636 (2 Contracts x $818) based on a hypothetical $100,000 portfolio risking 2%. We suggest using 2% of your portfolio value and divide it by $818 to select the # contracts for your portfolio.
Counter Trend Signal: This is a bullish trade on a stock that is bearish and which found support.
1M/6M Trends: Bearish/Bearish
Relative Strength: 3/10
OptionsPlay Score: 109
Stop Loss: @ $4.10 Credit. (50% loss of the premium)
Entering the Trade
Use the following details to enter the trade on your trading platform. Please note that whenever there is a multi-leg option strategy, it should be entered as a single trade.
Please note that these prices are based on Tuesday’s closing prices. Should the underlying move significantly during the pre-market hours, we will likely adjust the strikes and prices to reflect a more accurate trade entry.
DailyPlay – Portfolio Review – February 6, 2024
DailyPlay Portfolio Review
Our Trades
NOC
Bullish Debit Spread. NOC is holding support about the $430 region as we await a move higher from this area of support. Targeting the $480 resistance zone.
ORCL
Bullish Debit Spread. ORCL is currently making its way higher with our trade being at 12%. Further upside is expected over the next few days while we continue to monitor this trade. The next major resistance level is at $120.
RSP
Long-term play on the S&P Equal Weighted Index. Price consolidated in the last 2 weeks but showing bullish price action at the $155 level. We will continue to hold this position.
$NOC
DailyPlay – Opening Trade (NOC) Closing Trades (AAPL, JNJ) – February 5, 2024
Closing Trades
- AAPL – 50.70% Gain: Sell to Close 7 Contracts (or 100% of your Contracts) March 15th $190/$180 Put Vertical Spreads @ $4.31 Credit. DailyPlay Portfolio: By Closing all 7 Contracts, we will receive $30.17. We initially opened these 7 Contracts on Jan 30 @ $2.86 Debit. Our average gain, therefore, is $145 per contract.
- JNJ – 55.28% Loss: Sell to Close 3 Contracts (or 100% of your Contracts) Feb 16th $155 Calls @ $2.75 Credit. DailyPlay Portfolio: By Closing all 3 Contracts, we will receive $825. We initially opened these 3 Contracts on Dec 15 @ $6.15 Debit. Our average loss, therefore, is $340 per contract.
NOC Bullish Opening Trade Signal
Investment Rationale
As geopolitical tensions and the risk of a wider regional conflict in the Middle East rise, defense stocks have been lagging on the sidelines. Despite reporting better-than-expected earnings, investors sold NOC after earnings on the back of an uncertain outlook and guidance. With defense stocks trading closer to their 52-week lows, it presents an opportunity to potentially look for a bounce.
Technical Analysis
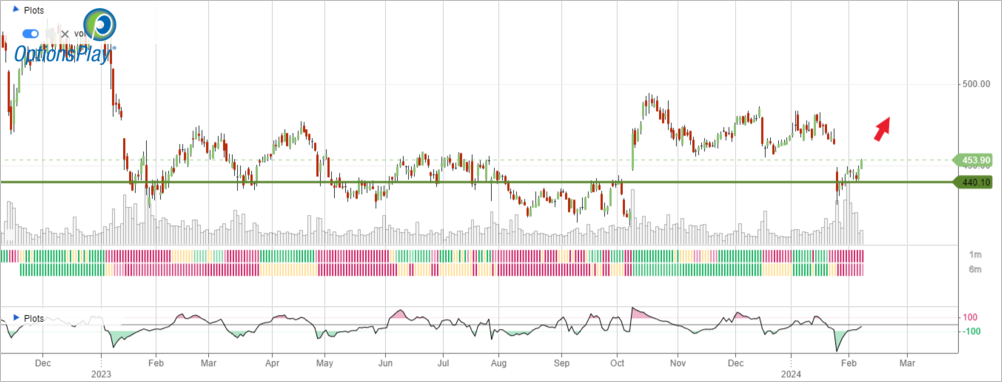
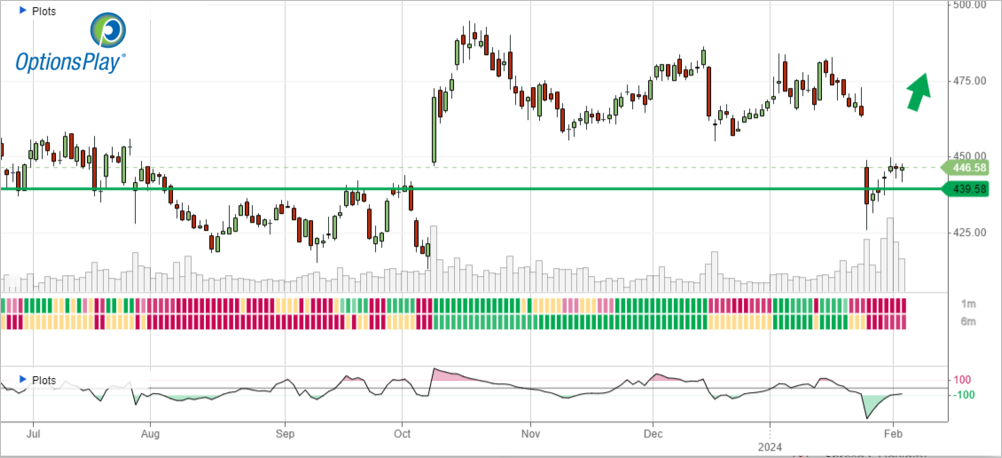
For the past year, NOC has largely traded within a range from $430 to $480 and its recent earnings announcement triggered a slide to the lows. The stock has since bounced off those lows and starting to show strength and now looks to close the gap at $463 before potentially reaching the $480 top of the trading range.
NOC – Daily
Fundamental Analysis
Currently, analysts are expecting about 6% EPS growth this year on the back of 5% revenue growth, which is very modest. However, this is reflected in the valuation at 18x forward earnings, NOC is inexpensive relative to itself and the market. With these types of valuations, the downside is limited and the upside remains sizable, especially given the propensity for defense stocks to outperform during periods of war.
AMZN Trade Details
Strategy Details
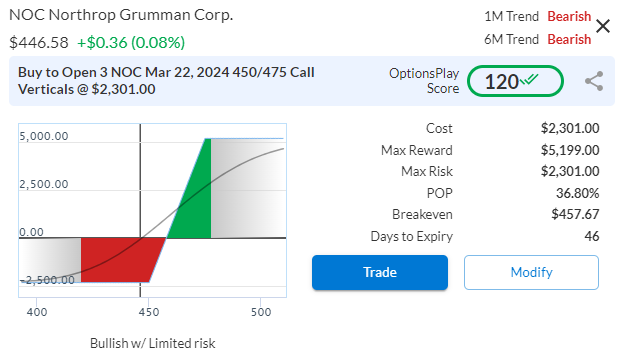
Strategy: Long Call Vertical Spread
Direction: Bullish Debit Spread
Details: Buy to Open 3 Contracts March 22nd $450/$475 Call Vertical Spreads @ $7.67 Debit per contract.
Total Risk: This trade has a max risk of $2,301 (1 Contracts x $767) based on a hypothetical $100,000 portfolio risking 2%. We suggest using 2% of your portfolio value and divide it by $767 to select the # contracts for your portfolio.
Counter Trend Signal: This is a bullish trade on a stock that found support and is expected to bounce higher.
1M/6M Trends: Bearish/Bearish
Relative Strength: 4/10
OptionsPlay Score: 120
Stop Loss: @ $3.84 Credit. (50% loss of premium paid)
Entering the Trade
Use the following details to enter the trade on your trading platform. Please note that whenever there is a multi-leg option strategy, it should be entered as a single trade.
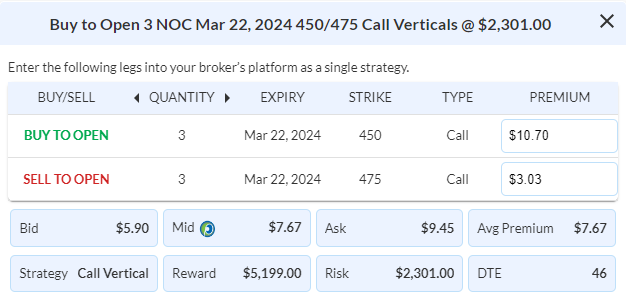
Please note that these prices are based on Wednesday’s closing prices. Should the underlying move significantly during the pre-market hours, we will likely adjust the strikes and prices to reflect a more accurate trade entry.
$AMZN

DailyPlay – Closing Trade (AMZN) and Portfolio Review – February 2, 2024
Closing Trade (updated pricing)
- AMZN – 112% Loss: Buy to Close 2 Contracts (or 100% of your Contracts) March 15th $160/$175 Call Vertical Spreads @ $8.67 Debit. DailyPlay Portfolio: By Closing both Contracts, we will be paying $17.34. We initially opened these 2 Contracts on Feb 1 @ $4.08 Credit. Our average loss, therefore, is $459 per contract.
Investment Rationale
Yesterday afternoon provided investors with plenty of fireworks as 3 major tech companies reported earnings. We had two open positions that were reported after the close yesterday, AAPL and AMZN. Let’s first review the trade that did not move in the expected direction, AMZN. When an earnings trade proves your thesis incorrect, we must cut losses immediately and prevent any further downside. Our goal with the DailyPlay is to show you how to manage your positions to put yourself on the path of profitability. This entails ensuring losses remain small while seizing every opportunity to hit potential home runs. Our view on AAPL on the other hand has proven to be correct. It is trading near our lower strike price and presents an opportunity to add further exposure. We will update you with a closing price for the AMZN spread after the open and monitor the AAPL position for an opportunity to add more exposure.
DailyPlay Portfolio Review
Our Trades
AAPL
Bearish Debit Spread. As expected, AAPL is pulling back from recent highs around $195. Positive earnings yesterday pushed the price of AAPL higher during the day, so we will closely monitor this trade to see if the pullback continues.
AMZN
Bearish Credit Spread. We are closing this position today. Please refer to the Investment Rationale for more information.
JNJ
Long Call (bullish). JNJ dipped below $160 last week Friday and we will continue to monitor this position to see if it breaks over this level. We do see signs of a reversal higher with price-finding support at the $157 level.
ORCL
Bullish Debit Spread. We rolled ORCL last week to extend our gains on this trade. We expect to see a continuation of its bullish trend. With 42 DTE, we will be keeping this trade open for now.
RSP
Long-term play on the S&P Equal Weighted Index. Price consolidated in the last 2 weeks but showing bullish price action at the $155 level. We will continue to hold this position.