$BMY

DailyPlay – Opening Trade (BMY) – November 27, 2023

BMY Bullish Opening Trade Signal
View BMY Trade
Strategy Details
Strategy: Long Call Vertical Spread
Direction: Bullish
Details: Buy to Open 15 Contracts Jan 19th $50/$55 Call Vertical Spreads @ $1.32 Debit per contract.
Total Risk: This trade has a max risk of $1,980 (15 Contracts x $132) based on a hypothetical $100,000 portfolio risking 2%. We suggest using 2% of your portfolio value and divide it by $132 to select the # contracts for your portfolio.
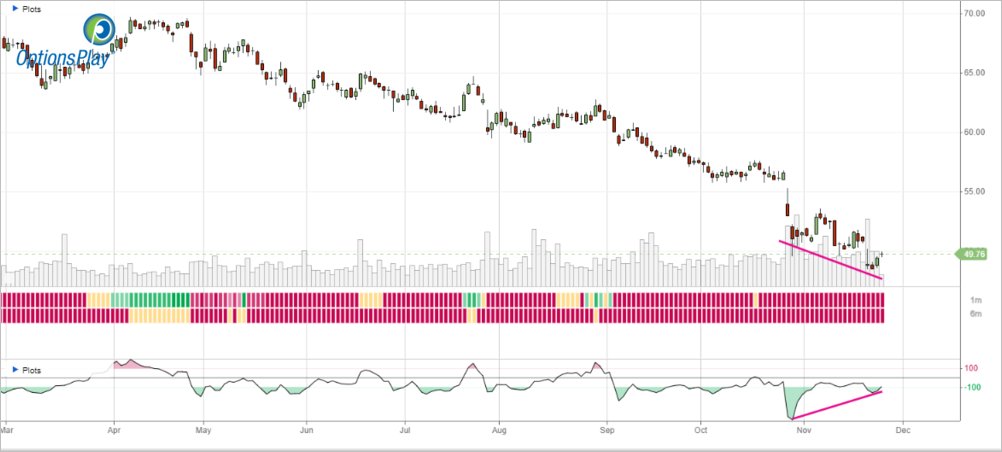
Counter Trend Signal: This is a bullish trade on a stock that is bullish but expected to pull back to lower levels.
1M/6M Trends: Bearish/Bearish
Relative Strength: 2/10
OptionsPlay Score: 118
Stop Loss: @ $0.66 Credit. (50% loss on premium paid)
Entering the Trade
Use the following details to enter the trade on your trading platform. Please note that whenever there is a multi-leg option strategy, it should be entered as a single trade.
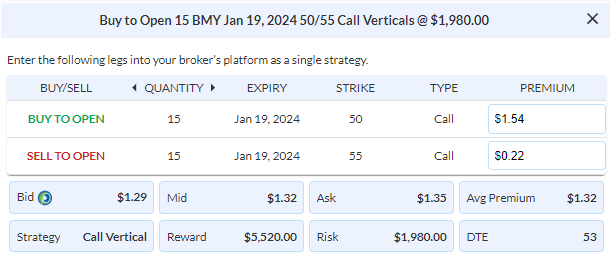
Please note that these prices are based on Friday’s closing prices. Should the underlying move significantly during the pre-market hours, we will likely adjust the strikes and prices to reflect a more accurate trade entry.
Investment Rationale
BMY has recently acquired multiple pharmaceutical companies with some starting to pay off with an FDA approval just this week for their lung cancer drug Augtyro. Additionally, multiple drugs in their pipeline that have been approved this past year are starting to see stellar QoQ sales growth. So, as analysts turn sour on BMY, I believe now is the best time to have an eye on this 136-year-old pharmaceutical company. The share price for BMY has now stabilized after this FDA announcement and we therefore believe that it is now a good time to enter this trade.
A simple way to play for a potential bounce is to simply look out to Buy the Jan 19th $50/55 Call Vertical @ $1.32 Debit. With a hypothetical portfolio of $100,000, I recommend risking 2% of the portfolio’s value to this trade, which is 15 Contracts for a risk of $1,980. We will set a stop loss on the put spread at around 50% of the premium paid @ $0.66 Credit.
BMY – Daily

DailyPlay Updates – November 22, 2023

Heading into a light volume of trading today, we are going to hold off from adding further exposure to our DailyPlay portfolio. At the moment, none of our open positions warrants adjusting so we will not be making any trades in our DailyPlay portfolio. We will also not add additional trades on Friday’s half day of trading, but will monitor the DailyPlay portfolio for potential adjustments to our existing trades and send updates accordingly. From everyone at the OptionsPlay team, we wish you and your family a Happy Thanksgiving!

DailyPlay – Opening Trade (MGM) Closing Trade (TMUS) – November 21, 2023

Closing Trade
- TMUS – 56.01% Gain: Buy to Close 6 Contracts (or 100% of your Contracts) Dec 15th $145/$140 Put Vertical Spreads @ $0.75 Debit. DailyPlay Portfolio: By Closing all 6 Contracts, we will be paying $450. We initially opened these 6 Contracts on Nov 2 @ $1.71 Credit. Our average gain, therefore, is $96 per contract.
MGM Bearish Opening Trade Signal
View MGM Trade
Strategy Details
Strategy: Short Call Vertical Spread
Direction: Bearish
Details: Sell to Open 10 Contracts Dec 29th $40/$43 Call Vertical Spreads @ $1.20 Credit per contract.
Total Risk: This trade has a max risk of $1,800 (10 Contracts x $180) based on a hypothetical $100,000 portfolio risking 2%. We suggest using 2% of your portfolio value and divide it by $180 to select the # contracts for your portfolio.
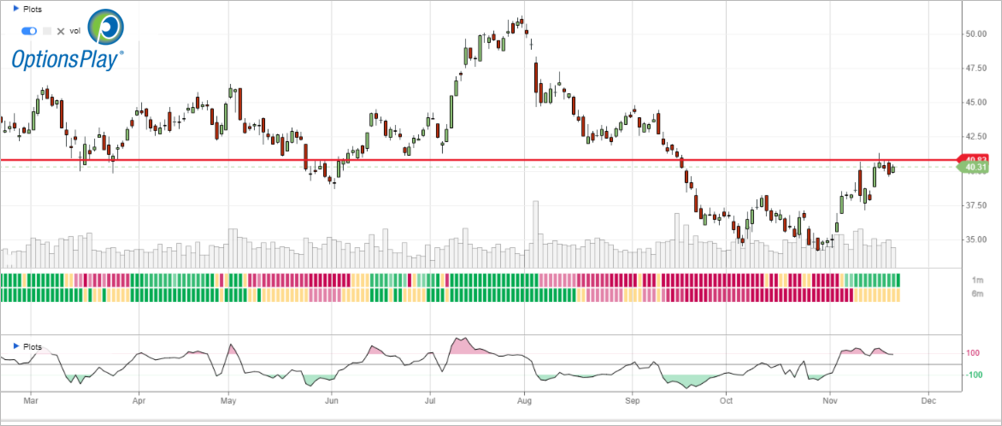
Counter Trend Signal: This is a bearish trade on a stock that is bullish and expected to pull back lower.
1M/6M Trends: Bullish/Neutral
Relative Strength: 6/10
OptionsPlay Score: 100
Stop Loss: @ $2.42 Debit. (100% loss on premium paid)
Entering the Trade
Use the following details to enter the trade on your trading platform. Please note that whenever there is a multi-leg option strategy, it should be entered as a single trade.
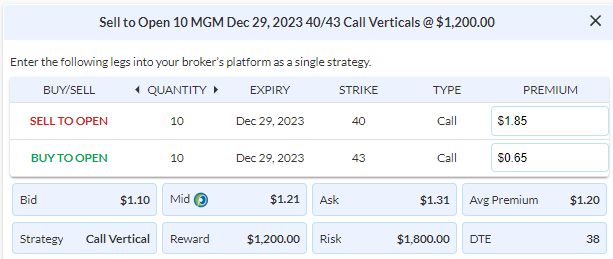
Please note that these prices are based on Monday’s closing prices. Should the underlying move significantly during the pre-market hours, we will likely adjust the strikes and prices to reflect a more accurate trade entry.
Investment Rationale
MGM has been bullish recently, partly due to the Formula 1 race in Las Vegas which boosted its income and share price. Equities in general have also seen a rally over the same period, but this rally has run out of steam as the S&P500 topped out at 4560.
With MGM trading into an area of resistance between $40 and $41 and it being in an overbought condition, we expect to see a pullback from this level. We would therefore make use of this opportunity to collect a premium on a bearish Credit Spread. Let’s look to Sell the Dec 29 $40/$43 Call Vertical Spread at $1.20 Credit per share. With a hypothetical portfolio of $100,000, I recommend risking 2% of the portfolio’s value to this trade, which is 10 Contracts for a risk of $1,800. We will set a stop loss on this spread at around 100% loss to the value of the premium paid @ $2.42 Debit.
MGM – Daily
$BMY

DailyPlay – Opening Trade (BMY) – November 20, 2023

BMY Bullish Opening Trade Signal
View BMY Trade
Strategy Details
Strategy: Long Call Vertical Spread
Direction: Bullish
Details: Buy to Open 32 Contracts Jan 19th $52.5/$55 Call Vertical Spreads @ $0.61 Debit per contract.
Total Risk: This trade has a max risk of $1,952 (32 Contracts x $61) based on a hypothetical $100,000 portfolio risking 2%. We suggest using 2% of your portfolio value and divide it by $61 to select the # contracts for your portfolio.
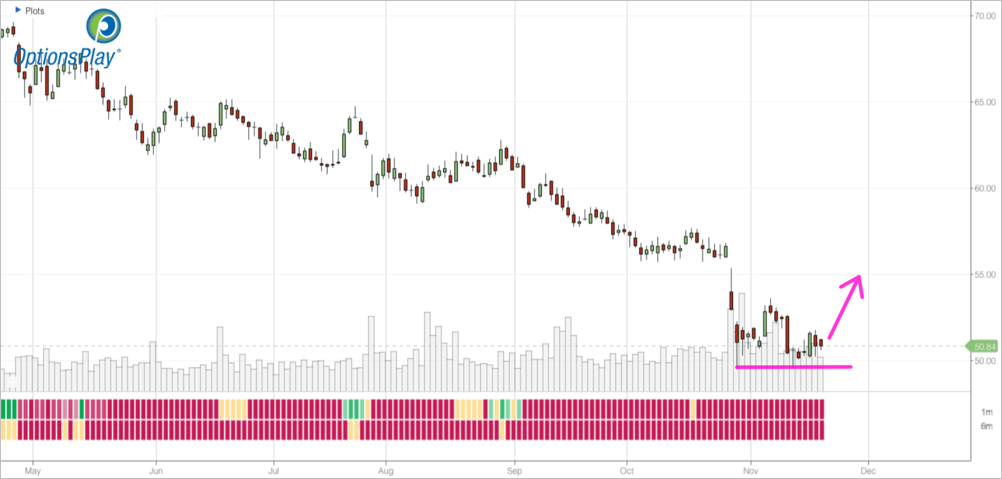
Trend Continuation Signal: This is a bullish trade on a stock that is bearish and expected to bounce higher off support.
1M/6M Trends: Bearish/Bearish
Relative Strength: 2/10
OptionsPlay Score: 130
Stop Loss: @ $0.30 Credit. (50% loss on premium paid)
Entering the Trade
Use the following details to enter the trade on your trading platform. Please note that whenever there is a multi-leg option strategy, it should be entered as a single trade.
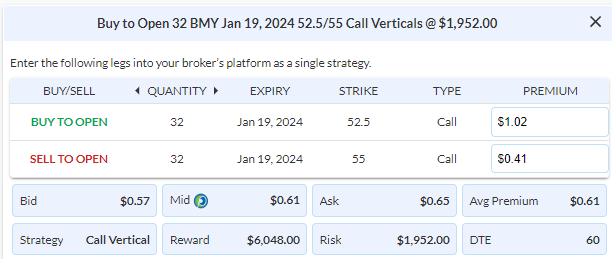
Please note that these prices are based on Friday’s closing prices. Should the underlying move significantly during the pre-market hours, we will likely adjust the strikes and prices to reflect a more accurate trade entry.
Investment Rationale
After declining nearly 40% over the past 12 months, BMY is starting to approach levels that should interest a long term investor. With declining sales of their generics business having eroded shareholder value, BMY trades at just 7x forward earnings despite stable revenues, EPS and free cash flow. I believe that it warrants this stock warrants further inspection and presents a possible opportunity. BMY have recently acquired multiple pharmaceutical companies with some starting to pay off with an FDA approval just this week for their lung cancer drug Augtyro. Additionally multiple drugs in their pipeline that have been approved this past year are starting to see stellar QoQ sales growth. So, as analysts turn sour on BMY, I believe now is the best time to have any eye on this 136 year old pharmaceutical company. A simple way to play for a potential bounce is to simply look out to buy the Jan $52.5/$55 Call Vertical @ $0.61 Debit. With a hypothetical portfolio of $100,000, I recommend risking 2% of the portfolio’s value to this trade, which is 32 Contracts for a risk of $1,952. We will set a stop loss on the put spread at around 50% of the premium paid @ $0.30 Credit.
BMY – Daily
$HAL

DailyPlay – Opening Trade (HAL) – November 17, 2023

HAL Bearish Opening Trade Signal
View HAL Trade
Strategy Details
Strategy: Long Put Vertical Spread
Direction: Bearish
Details: Buy to Open 13 Contracts Jan 19th $38/$34 Put Vertical Spreads @ $1.53 Debit per contract.
Total Risk: This trade has a max risk of $1,989 (13 Contracts x $153 based on a hypothetical $100,000 portfolio risking 2%. We suggest using 2% of your portfolio value and divide it by $153 to select the # contracts for your portfolio.
Trend Continuation Signal: This is a bearish trade on a stock that is bearish and expected to continue lower.
1M/6M Trends: Bearish/Mildly Bearish
Relative Strength: 9/10
OptionsPlay Score: 119
Stop Loss: @ $0.77 Credit. (50% loss on premium paid)
Entering the Trade
Use the following details to enter the trade on your trading platform. Please note that whenever there is a multi-leg option strategy, it should be entered as a single trade.
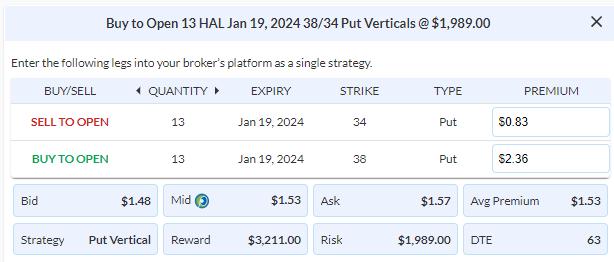
Please note that these prices are based on Thursday’s closing prices. Should the underlying move significantly during the pre-market hours, we will likely adjust the strikes and prices to reflect a more accurate trade entry.
Investment Rationale
As we approach the end of the trading week, our $HAL position reflects an unrealized gain of 24%. With oil on the decline, the Energy sector has been the weakest sector in the S&P 500. $HAL broke below the $38 major support level yesterday which has confirmed our bearish thesis. As we expect a continuation lower, we will be adding another 2% to this position (Buy 13 Jan 19, $38/$34 Put Verticals @ $1.53 Debit). The next support zone for $HAL sits at $34.
Equities continue to push higher with the $SPX now at the $4500 level. Given the extent of the rally in the last 2 weeks, we view equities as slightly overbought in the short term and still expect a quick pullback in the next few days. However, the risk-on rally has seen a strong shift in price structure with a breakout above the $4400 previous swing high. Despite beating on revenue and EPS expectations, Walmart ($WMT) experienced a 8% decline yesterday due to poor forecasts regarding consumer spending.
$UAL

DailyPlay – Closing Trade (UAL) – November 16, 2023

- UAL – 84.16% Gain: Sell to Close 31 Contracts (or 100% of your Contracts) Dec 15th $35/$40 Call Vertical Spreads @ $3.72 Credit. DailyPlay Portfolio: By Closing all 31 Contracts, we will be receiving $11,532. We initially opened 13 Contracts on Oct 31 @ $1.58 Debit, and then another 10 Contracts on Nov 3 @ $1.95 Debit, and another 8 Contracts on Nov 8 @ $2.47 Debit. Our average gain, therefore, is $179.10 per contract.
$MA, RY

DailyPlay – Closing Trades (MA, RY) – November 15, 2023

Closing Trades
- MA – 30.22% Loss: Buy to Close 2 Contracts (or 100% of your Contracts) Dec 22nd $390/$405 Call Vertical Spreads @ $9.05 Debit. DailyPlay Portfolio: By Closing both Contracts, we will be paying $1,810. We initially opened this trade on Nov 9 @ $6.95 Credit. Our average loss, therefore, is $210 per contract.
- RY – 72.26% Loss: Buy to Close 6 Contracts (or 100% of your Contracts) Dec 15th $85/$90 Call Vertical Spreads @ $2.67 Debit. DailyPlay Portfolio: By Closing all 6 Contracts, we will be paying $1,602. We initially opened these 6 Contracts on Nov 7 @ $1.55 Credit. Our average loss, therefore, is $112 per contract.

DailyPlay Updates – November 14, 2023

Every investor has their eyes on the CPI print this morning that is set to release at 9:30AM to provide a better outlook to the Fed’s interest rate path. While we do not expect to see a significant surprise in the number, there has been a meaningful uptick in inflation in Oct that will show that the fight to 2% isn’t done just yet. While we wait for this important economic number, we will refrain from adding any further exposure in our DailyPlay portfolio. There are 2 positions that a potentially near take-profit levels, TMUS and UAL, which we will monitor closely after the CPI print and send out an alert if necessary intraday to close them out.
$HAL

DailyPlay – Opening Trade (HAL) – November 13, 2023

HAL Bearish Opening Trade Signal
View HAL Trade
Strategy Details
Strategy: Long Put Vertical Spread
Direction: Bearish
Details: Buy to Open 16 Contracts Jan 19th $38/$34 Put Vertical Spreads @ $1.22Debit per contract.ct.
Total Risk: This trade has a max risk of $1,952 (16 Contracts x $122) based on a hypothetical $100,000 portfolio risking 2%. We suggest using 2% of your portfolio value and divide it by $122 to select the # contracts for your portfolio.
Trend Continuation Signal: This is a bearish trade on a stock that is bearish and expected to continue lower.
1M/6M Trends: Bearish/Neutral
Relative Strength: 10/10
OptionsPlay Score: 131
Stop Loss: @ $0.61 Credit. (50% loss on premium paid)
Entering the Trade
Use the following details to enter the trade on your trading platform. Please note that whenever there is a multi-leg option strategy, it should be entered as a single trade.
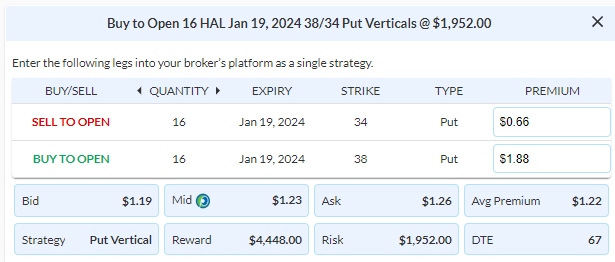
Please note that these prices are based on Friday’s closing prices. Should the underlying move significantly during the pre-market hours, we will likely adjust the strikes and prices to reflect a more accurate trade entry.
Investment Rationale
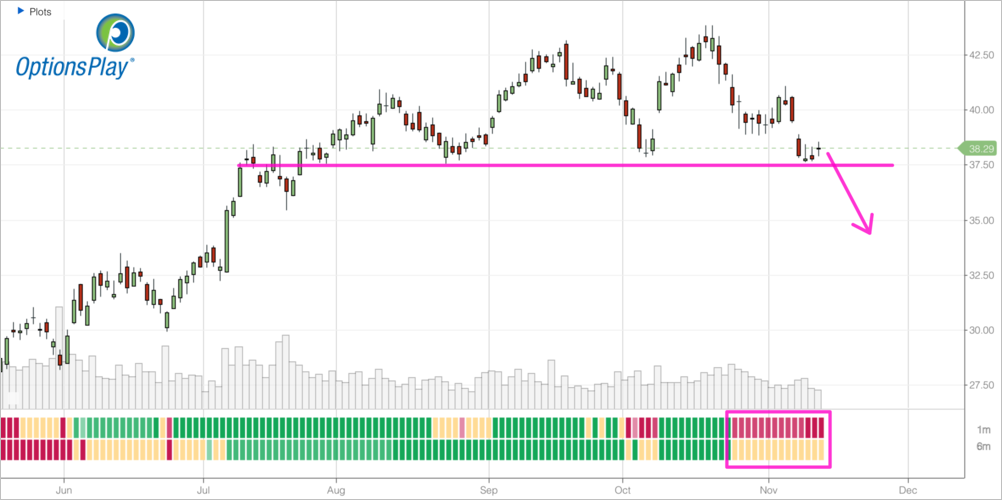
An unexpected outcome of the war in Israel has been the decline in oil prices. This has put significant pressure on oil field services companies such as HAL and SLB as shale producers seek to manage budgets into the close of 2023, a huge turnaround from Q2. The energy sector has lost its relative strength faster than it gained it and stocks like HAL are at risk of pulling back and breaking below a key support level at $38. If HAL were to break below $38, the risk is a pullback into the $31 support area. I’m playing for a potential break with a simple put vertical. Look to buy the Jan $38/$34 Put Vertical @ $1.22 Debit. With a hypothetical portfolio of $100,000, I recommend risking 2% of the portfolio’s value to this trade, which is 16 Contracts for a risk of $1,952. We will set a stop loss on the put spread at around 50% of the premium paid @ $0.61 Credit.
HAL – Daily

DailyPlay Updates – November 10, 2023

Investment Rationale
If the S&P 500 notched a gain yesterday, it would have been the longest winning streak since Nov 2004. However, we saw the 10-year yields rise off its 4.5% base and equities rejected off its key $4400 resistance level. With earnings revisions ratios firmly negative for Q4, the outlook for equities continues to look uncertain. We currently have a health mix of bearish opportunities that take advantage of the attractive risk/reward ratios offered by the current market setup, and the sizable long position in severely oversold UAL. I do not suggest adding further exposure at this time in our portfolio. PSX is just shy of our take profit levels, which may trigger today. I hope that everyone has a great weekend and a great trading day.

