$AAPL

DailyPlay – Opening Trade (AAPL) Closing Trades (GOOGL, AMD) – October 26, 2023
Closing Trade
- GOOGL – 75% Loss: Buy to Close 4 Contracts (or 100% of your Contracts) Dec 1st $136/$128 Put Vertical Spreads @ $5.67 Debit. DailyPlay Portfolio: By Closing all 4 Contracts, we will be paying $2,268. We initially opened these 4 Contracts on Oct 24 @ $3.24 Credit. Our average loss, therefore, is $243 per contract.
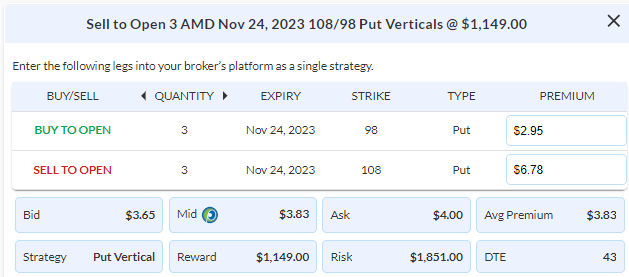
- AMD – 75.46% Loss: Buy to Close 3 Contracts (or 100% of your Contracts) Nov 24th $108/$98 Put Vertical Spreads @ $6.72 Debit. DailyPlay Portfolio: By Closing all 3 Contracts, we will be paying $2,016. We initially opened these 3 Contracts on Oct 12 @ $3.83 Credit. Our average loss, therefore, is $289 per contract.
AAPL Bearish Opening Trade Signal
View AAPL Trade
Strategy Details
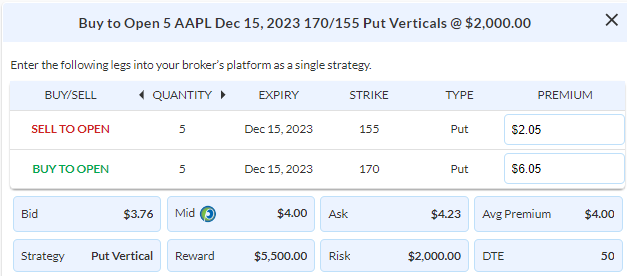
Strategy: Long Put Vertical Spread
Direction: Bearish
Details: Buy to Open 5 Contracts Dec 15th $170/$155 Put Vertical Spreads @ $4.00 Debit per contract.
Total Risk: This trade has a max risk of $2,000 (5 Contracts x $400) based on a hypothetical $100,000 portfolio risking 2%. We suggest using 2% of your portfolio value and divide it by $400 to select the # contracts for your portfolio.
Trend Continuation Signal: This is a bearish trade on a stock that is in a bearish
1M/6M Trends: Bearish/Mildly Bearish
Relative Strength: 8/10
OptionsPlay Score: 147
Stop Loss: @ $2.00 Credit. (50% loss of premium paid)
Entering the Trade
Use the following details to enter the trade on your trading platform. Please note that whenever there is a multi-leg option strategy, it should be entered as a single trade.
Please note that these prices are based on Wednesday’s closing prices. Should the underlying move significantly during the pre-market hours, we will likely adjust the strikes and prices to reflect a more accurate trade entry.
Investment Rationale
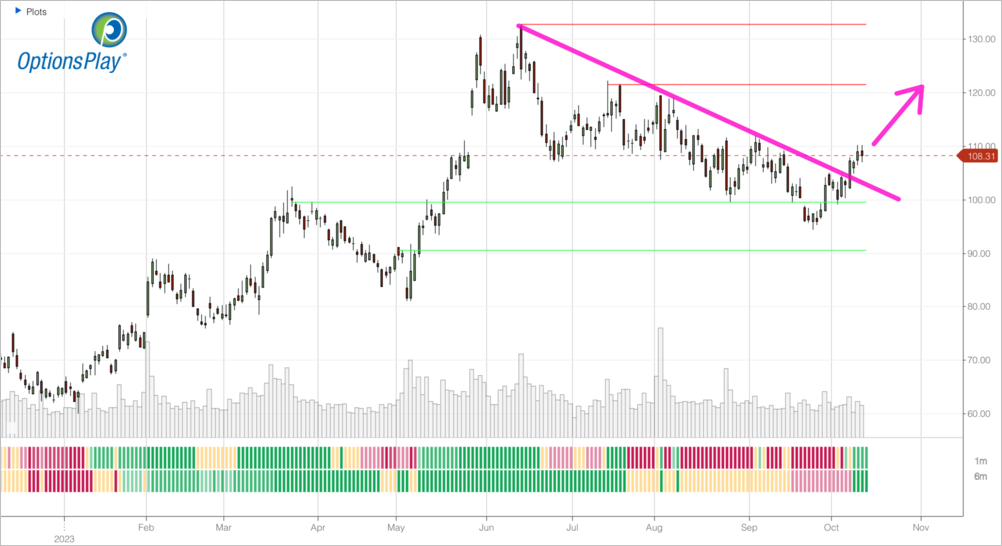
Earnings season can be a challenging time to navigate, especially, when the market reacts differently to the underlying report. Despite GOOGL, META, SNAP reporting significantly stronger than expected numbers, these stock have sold off heavily. This confirms the break of the key $4220 support level on the S&P 500 and $14,500 on the Nasdaq-100. We, unfortunately, have to face two losing positions in our portfolio on GOOGL and AMD and close out the full positions before they reach their max loss. Additionally, looking at opportunities our AAPL position has started to work in our favor with the stock at risk of breaking below its key $170 support. I believe now is an opportunity to add some additional exposure to potentially play for a continuation lower. I suggest buying another 5 contracts of the Dec $170/$155 Put Vertical @ $4.00 Debit, which represents another 2% of our hypothetical $100,000 portfolio. We will move our stop loss on the put spread to around 50% of the premium paid @ $2.00 Credit.
AAPL – Daily
$MSFT

DailyPlay – Closing Trade (MSFT) – October 25, 2023
Closing Trade
- MSFT – 52.47% Loss: Buy to Close 2 Contracts (or 100% of your Contracts) Nov 17th $320/$340 Call Vertical Spreads @ $11.13 Debit. DailyPlay Portfolio: By Closing both Contracts, we will be paying $2,226. We initially opened these 2 Contracts on Oct 2 @ $7.30 Credit. Our average loss, therefore, is $383 per contract.
Investment Rationale
With tech earnings rolling in, 3 of our positions reported earnings last night. MSFT, GOOGL and SNAP. Both MSFT and GOOGL unfortunately have not gone our way, while SNAP initially was up 10% overnight is now flat at the open. We will be closing MSFT at the open today and will monitor GOOGL and SNAP for potential opportunities to exit the trades with either minimal loss or a small gain.
$GOOGL

DailyPlay – Opening Trade (GOOGL) Closing Trade (INDA) – October 24, 2023
Closing Trade
- INDA – 47.75% Loss: Sell to Close 20 Contracts (or 100% of your Contracts) Dec 15th $44 Calls @ $0.93 Credit. DailyPlay Portfolio: By Closing all 20 Contracts, we will receive $1,860. We initially opened these 20 Contracts on Oct 11 @ $1.63 Debit. Our average loss, therefore, is $70 per contract.
GOOGL Bullish Opening Trade Signal
View GOOGL Trade
Strategy Details
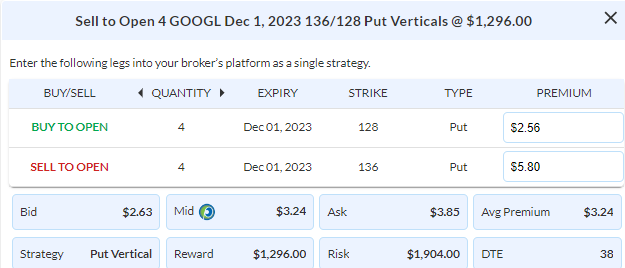
Strategy: Short Put Vertical Spread
Direction: Bullish
Details: Sell to Open 4 Contracts Dec 1st $136/$128 Put Vertical Spreads @ $3.24 Credit per contract.
Total Risk: This trade has a max risk of $1,904 (4 Contracts x $476) based on a hypothetical $100,000 portfolio risking 2%. We suggest using 2% of your portfolio value and divide it by $476 to select the # contracts for your portfolio.
Trend Continuation Signal: This is a Bullish trade on a stock that is bullish.
1M/6M Trends: Bullish/Bullish
Relative Strength: 10/10
OptionsPlay Score: 98
Stop Loss: @ $6.50 Debit. (100% loss of premium paid)
Entering the Trade
Use the following details to enter the trade on your trading platform. Please note that whenever there is a multi-leg option strategy, it should be entered as a single trade.
Please note that these prices are based on Monday’s closing prices. Should the underlying move significantly during the pre-market hours, we will likely adjust the strikes and prices to reflect a more accurate trade entry.
Investment Rationale
Despite having a strong view that India will maintain its outperformance in the APAC region, our position timing has not worked out as well. After rolling our Oct calls to the Dec $44 call options, we are down about 50% of the premium on those new calls. As a rule of thumb, we must reduce exposure when trades are not working out as expected. I suggest that we should close out the full INDA position at this point. We will continue to hold onto a few positions going into earnings this afternoon with MSFT and SNAP reporting after today’s close.
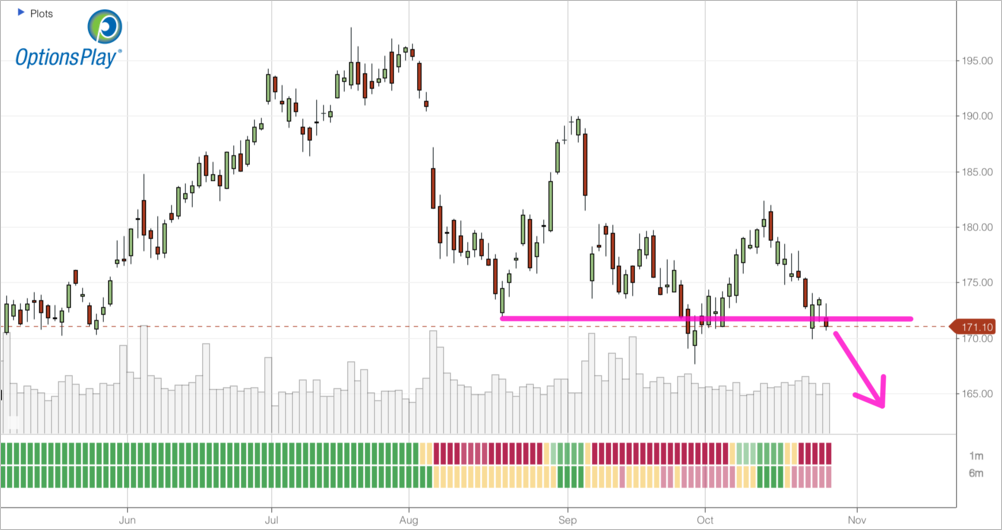
Alphabet reports later this week, and out of the major tech names, it’s the one that trades at a reasonable valuation. Alphabet continues to trend higher and now targets the $150 all-time highs. Additionally, GOOGL has continued to outperform its sector since the start of the 2nd half of this year and primed for a solid earnings report. Trading at 20x forward earnings, it is trading at an incredibly reasonable valuation, when you consider the 18% EPS growth that’s expected for next year. With implied vol elevated, here is an opportunity to earn yield by selling the Dec 1st $136/128 Put Vertical @ $3.24. With a hypothetical portfolio of $100,000, I recommend risking 2% of the portfolio’s value to this roll, which is 4 Contracts for a risk of $1,904. We will set a stop loss on the put spread at around 100% of the premium collected @ $6.50 Debit.
$MCD
DailyPlay – Closing Trade (MCD) – October 23, 2023
Closing Trade
- MCD – 33.63% Gain: Sell to Close 2 Contracts (or 100% of your Contracts) Dec 15th $250/$270 Call Vertical Spreads @ $10.41 Credit. DailyPlay Portfolio: By Closing both Contracts, we will receive $2,082. We initially opened these 2 Contracts on Oct 19 @ $7.79 Debit. Our average gain, therefore, is $262 per contract.
Investment Rationale
As treasuries continue to selloff aggressively, bears have taken control of the equity markets last week. With the $4220 major support level on the S&P at risk of falling this week, we evaluate our current open positions. We currently have 2 earnings plays this week with MSFT and SNAP on Tuesday after the close and 9 open positions. While I anticipate adding more earnings plays this week, I think it’s time to consider reducing some of the exposure in our portfolio. Our MCD position that we opened last week has seen a strong bounce, but momentum has stalled and at risk of pulling back. Despite not reaching our $268, I believe we must take profits on this trade after adding further exposure in this in the middle of last week. We are currently monitoring META and AMZN as earnings plays and PG and UNP as possible stocks to add bearish exposure in this week.
$SNAP
DailyPlay – Opening Trade (SNAP) – October 20, 2023
SNAP Bearish Opening Trade Signal
View SNAP Trade
Strategy Details
Strategy: Long Put Vertical Spread
Direction: Bearish
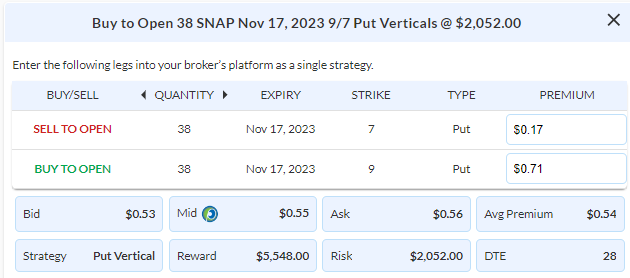
Details: Buy to Open 38 Contracts Nov 17th $9/$7 Put Vertical Spreads @ $0.54 Debit per contract.
Total Risk: This trade has a max risk of $2,052 (38 Contracts x $54) based on a hypothetical $100,000 portfolio risking 2%. We suggest using 2% of your portfolio value and divide it by $54 to select the # contracts for your portfolio.
Counter Trend Signal: This is a bearish trade on a stock that is neutral to bullish.
1M/6M Trends: Bullish/Neutral
Relative Strength: 8/10
OptionsPlay Score:132
Stop Loss: @ $0.25 Credit. (50% loss of premium paid)
Entering the Trade
Use the following details to enter the trade on your trading platform. Please note that whenever there is a multi-leg option strategy, it should be entered as a single trade.
Please note that these prices are based on Thursday’s closing prices. Should the underlying move significantly during the pre-market hours, we will likely adjust the strikes and prices to reflect a more accurate trade entry.
Investment Rationale
With earnings season in full swing and technology stocks starting to report next week, one opportunity I see is SNAP which reports next week on Oct 24th. It trades at a ridiculous valuation of 94x forward earnings, which was justified when SNAP was growing exponentially. However, in an environment where growth has slowed meaningfully and SNAP is barely turning a profit, it’s hard to justify these valuations unless SNAP reports a strong surprise with earnings and guidance. With options expensive, I’m looking to take a bearish position using a vertical spread. I’m going to buy the Nov $9/7 Put Vertical @ $0.54 Debit. With a hypothetical portfolio of $100,000, I recommend risking 2% of the portfolio’s value to this roll, which is 38 Contracts for a risk of $2,052. We will set a stop loss on the put spread at around 50% of the premium paid @ $0.25 Credit.
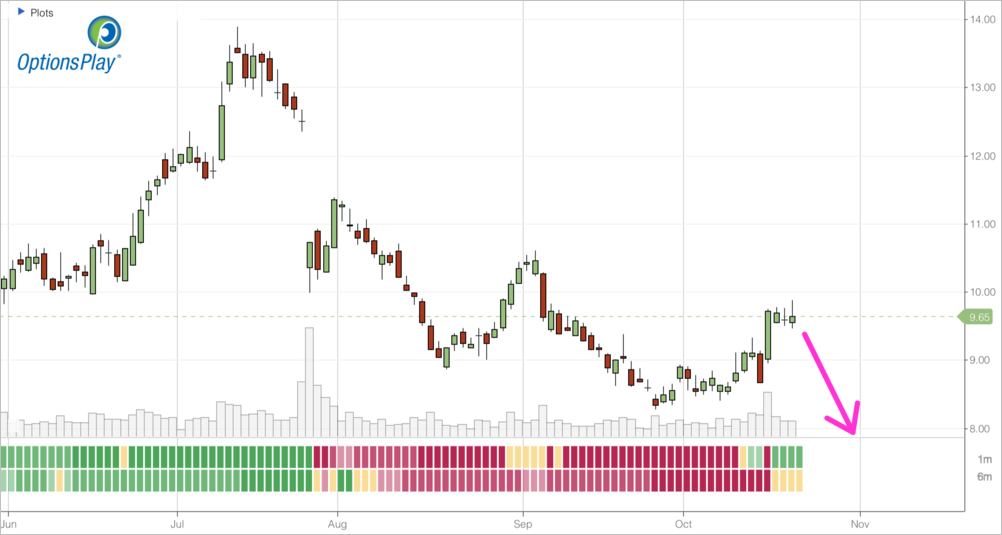
SNAP – Daily
$MCD
DailyPlay – Opening Trade (MCD) – October 19, 2023
MCD Bullish Opening Trade Signal
View MCD Trade
Strategy Details
Strategy: Long Call Vertical Spread
Direction: Bullish
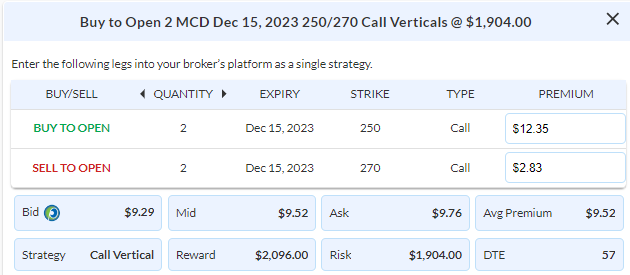
Details:Buy to Open 2 Contracts Dec 15th $250/$270 Call Vertical Spreads @ $9.52 Debit per contract.
Total Risk: This trade has a max risk of $1,904 (2 Contracts x $952) based on a hypothetical $100,000 portfolio risking 2%. We suggest using 2% of your portfolio value and divide it by $952 to select the # contracts for your portfolio.
Counter Trend Signal: This is a bullish trade on a stock that is in a bearish trend and expected to bounce higher.
1M/6M Trends: Bearish/Bearish
Relative Strength: 4/10
OptionsPlay Score: 94
Stop Loss: @ $4.75 Credit. (50% loss of premium paid)
Entering the Trade
Use the following details to enter the trade on your trading platform. Please note that whenever there is a multi-leg option strategy, it should be entered as a single trade.
Please note that these prices are based on Wednesday’s closing prices. Should the underlying move significantly during the pre-market hours, we will likely adjust the strikes and prices to reflect a more accurate trade entry.
Investment Rationale
As markets continue to trade in a rangebound manner, it may feel difficult to navigate the current trends. I wanted to remind members of how we help you become a profitable trader when markets seem challenging to navigate. It’s summed up in two simple yet emotionally challenging rules to implement. We must ensure that when trades do not pan out as expected, we accept them quickly and keep losses small, while fighting the urge to take every profit that comes our way. Instead, we must add face the uncomfortable nature of adding more exposure when the market proves our directional view correct such as in MCD and RCL. We must remember that even when a small percentage of our positions are profitable and we potentially hit a home run with them by adding exposure, they can easily offset a larger number of smaller losses.
To this effect, we are going to add further exposure as our outlook that MCD could bounce quickly has started to work and continue to monitor the # of positions with unrealized losses for places to reduce exposure. Let’s buy 2 more contracts of MCD Dec 15 $250/$270 Call Vertical @ $9.52 which is risking approximately another 2% of our total hypothetical portfolio’s value of $100,000. We move our stop loss to around 50% of the premium paid @ $4.75 Credit on the entire position of 5 contracts.
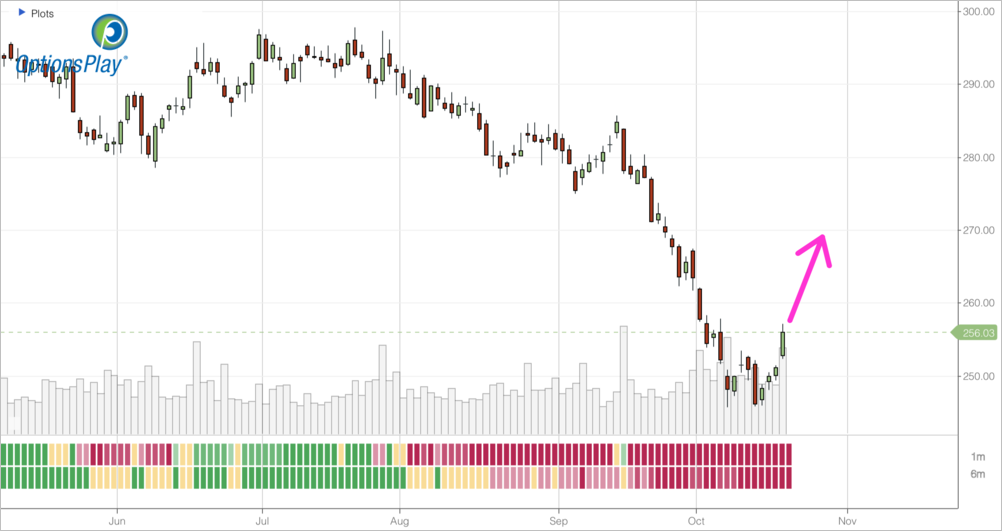
MCD – Daily
$RCL
DailyPlay – Opening Trade (RCL) – October 18, 2023
RCL Bearish Opening Trade Signal
View RCL Trade
Strategy Details
Strategy: Long Put Vertical Spread
Direction: Bearish
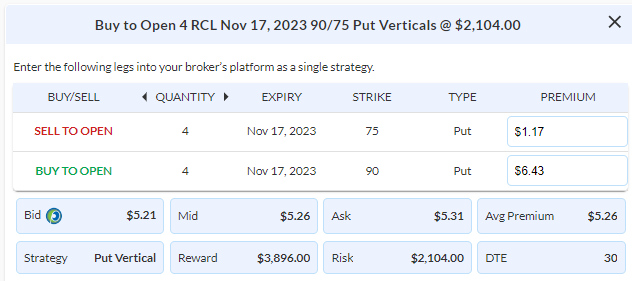
Details: Buy to Open 4 Contracts Nov 17th $90/$75 Put Vertical Spreads @ $5.26 Debit per contract.
Total Risk: This trade has a max risk of $2,104 (4 Contracts x $526) based on a hypothetical $100,000 portfolio risking 2%. We suggest using 2% of your portfolio value and divide it by $526 to select the # contracts for your portfolio.
This trade has a max risk of $2,104 (4 Contracts x $526) based on a hypothetical $100,000 portfolio risking 2%. We suggest using 2% of your portfolio value and divide it by $526 to select the # contracts for your portfolio.
1M/6M Trends: Bearish/Bearish
Relative Strength: 10/10
OptionsPlay Score: 133
Stop Loss: @ $2.60 Credit. (50% loss of premium paid)
Entering the Trade
Use the following details to enter the trade on your trading platform. Please note that whenever there is a multi-leg option strategy, it should be entered as a single trade.
Please note that these prices are based on Tuesday’s closing prices. Should the underlying move significantly during the pre-market hours, we will likely adjust the strikes and prices to reflect a more accurate trade entry.
Investment Rationale
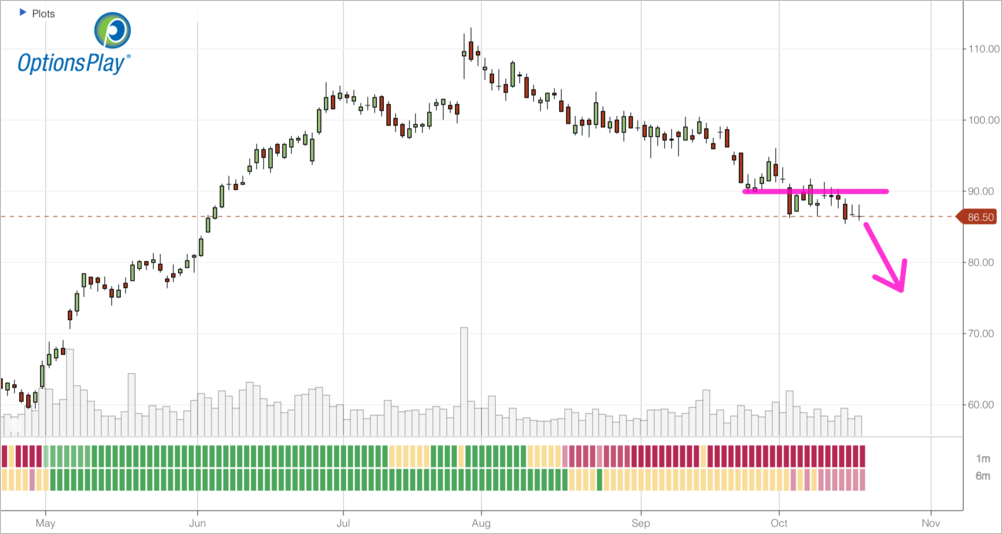
10-year yields closed above 4.8% yesterday to a new decade high. This environment continues to pressure high valuation stocks such as AAPL, who’s bonds now yield more than 5% while the stock yields just over 0.5%. This is why we maintain bearish exposure in tech stock such as AAPL and MSFT and continue to seek bearish opportunties. One such position, RCL has yielded gains and I believe has further downside. We should take this opportunity to add more exposure in this position and potentially hit a home run on further downside to our $78 target. I’m looking to buy 4 more contracts of the Nov $90/75 Put Vertical @ $5.26 Debit, which is risking approximately another 2% of our total hypothetical portfolio’s value of $100,000. We move our stop loss to around 50% of the premium paid @ $2.60 Credit on the entire position of 9 contracts.
RCL – Daily
$MCD
DailyPlay – Opening Trade (MCD) Closing Trade (JPM) – October 16, 2023
Closing Trade
- JPM – 31.33% Gain: Sell to Close 6 Contracts (or 100% of your Contracts) Nov 10th $146/$155 Call Vertical Spreads @ $4.15 Credit. DailyPlay Portfolio: By Closing all 6 Contracts, we will receive $2,490. We initially opened these 6 Contracts on Oct 10 @ $3.16 Debit. Our average gain, therefore, is $99 per contract.
MCD Bullish Opening Trade Signal
View MCD Trade
Strategy Details
Strategy: Long Call Vertical Spread
Direction: Bullish
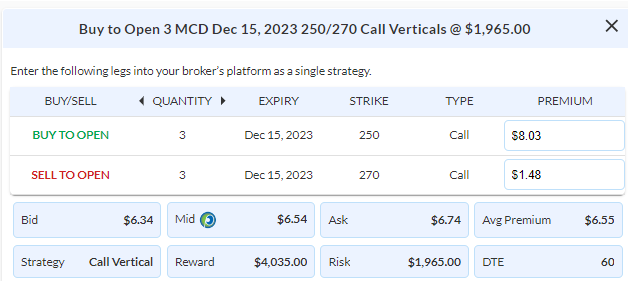
Details: Buy to Open 3 Contracts Dec 15th $250/$270 Call Vertical Spreads @ $6.55 Debit per contract.
Total Risk: This trade has a max risk of $1,965 (3 Contracts x $655) based on a hypothetical $100,000 portfolio risking 2%. We suggest using 2% of your portfolio value and divide it by $655 to select the # contracts for your portfolio.
Counter Trend Signal: This is a Bullish trade on a stock that found support and is expected to break out higher.
1M/6M Trends: Bearish/Bearish
Relative Strength: 3/10
OptionsPlay Score: 111
Stop Loss: @ $3.25 Credit. (50% loss of premium paid)
Entering the Trade
Use the following details to enter the trade on your trading platform. Please note that whenever there is a multi-leg option strategy, it should be entered as a single trade.
Please note that these prices are based on Friday’s closing prices. Should the underlying move significantly during the pre-market hours, we will likely adjust the strikes and prices to reflect a more accurate trade entry.
Investment Rationale
Price action on the S&P 500 left a lot to be desired at the end of last week. Bears managed to take control on Friday and close just below the key $4300 level and below the base line on the weekly cloud model. This maintains the bear case for the markets down to the $4100 downside target unless bulls can push the markets above $4380. While JPM jumped higher on earnings, price action was poor all day pushing it back towards the lows of the day. We are going to close the full JPM position and take profits here with less than 3 weeks to expiration.
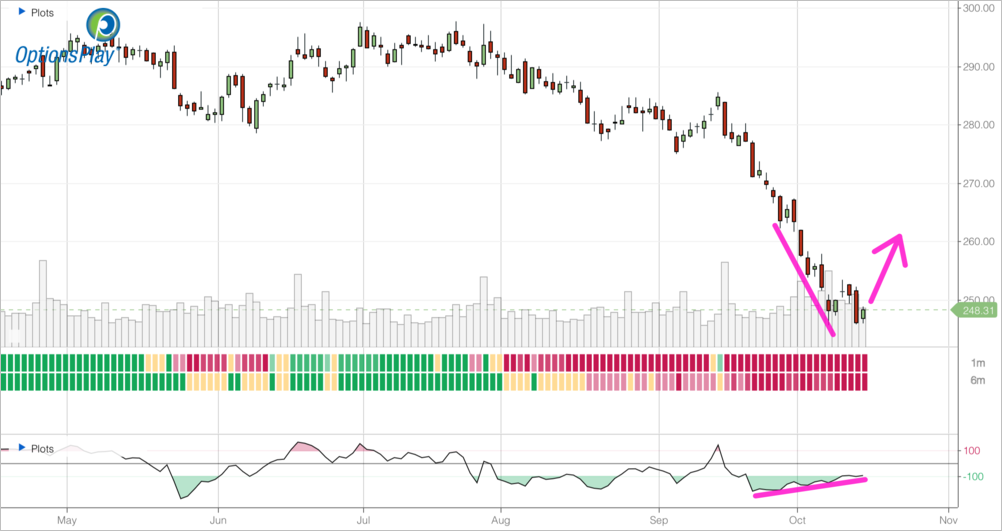
One emerging trend that I am starting to see are buying opportunities on severely oversold consumer stocks. MCD is an example of this, shedding 17% of its value over the past 3 months and now trading at just over 21x forward earnings which is a 15% discount to its historical average. Recently price has continued to move lower but momentum has started to diverge and showing signs of exhaustion to the downside. I see this as an opportunity to take a long position in MCD at a reasonable valuation near a possible trading bottom. Buy Dec $250/270 Call Vertical @ $6.55 Debit. With a hypothetical portfolio of $100,000, I recommend risking 2% of the portfolio’s value to this position, which is 3 Contracts for a risk of $1,965. We will set a stop loss on the call spread at around 50% of the premium paid @ $3.25 Credit.
MCD – Daily
$SBUX
DailyPlay – Opening Trade (SBUX) Closing Trade (SBUX) – October 13, 2023
Closing Trade
- SBUX – 31.80% Gain: Buy to Close 6 Contracts (or 100% of your Contracts) Nov 3rd $93/$99 Call Vertical Spreads @ $1.78 Debit. DailyPlay Portfolio: By Closing all 6 Contracts, we will be paying $1,068. We opened these 6 Contracts on September 22 @ $2.45 Credit. Our average gain, therefore, is $67 per contract.
SBUX Bearish Opening Trade Signal
View SBUX Trade
Strategy Details
Strategy: Short Call Vertical Spread
Direction: Bearish
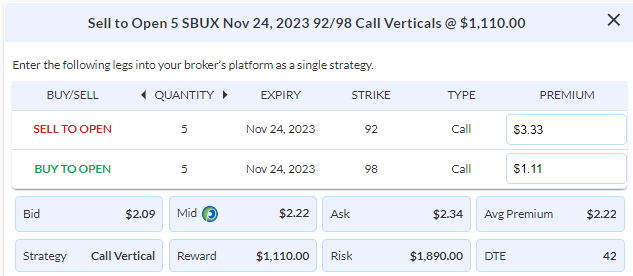
Details: Sell to Open 5 Contracts Nov 24th $92/$98 Call Vertical Spreads @ $2.22 Credit per contract..
Total Risk: This trade has a max risk of $1,890 (5 Contracts x $378) based on a hypothetical $100,000 portfolio risking 2%. We suggest using 2% of your portfolio value and divide it by $378 to select the # contracts for your portfolio.
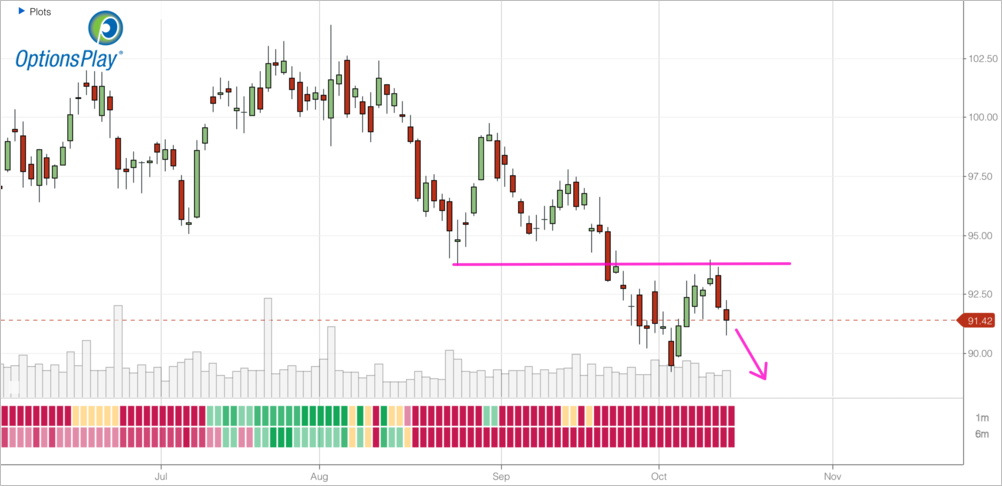
Trend Continuation Signal: This is a bearish trade on a stock that is in a bearish trend.
1M/6M Trends: Bearish/Bearish
Relative Strength: 3/10
OptionsPlay Score: 99
Stop Loss: @ $4.44 Debit (100% loss of premium collected.)
Entering the Trade
Use the following details to enter the trade on your trading platform. Please note that whenever there is a multi-leg option strategy, it should be entered as a single trade.
Please note that these prices are based on Thursday’s closing prices. Should the underlying move significantly during the pre-market hours, we will likely adjust the strikes and prices to reflect a more accurate trade entry.
Investment Rationale
Momentum on the rally for the S&P 500 has slowed and is now again testing its key $4300 level as support. We closely watching to see markets can hold this level to close out the week. Bulls need to hang onto this level to maintain a neutral stance on the market in order to potentially push higher. As we evaluate our portfolio, SBUX has approached the 21 day mark, which is when we need to start managing a credit spread as the Gamma risk starts to outweigh the acceleration we receive from Theta. Even though it has not quite yet reached our 50% profit target, we are going to take profits on our current position and roll this out to the Nov 24 $92/$98 Call Vertical @ $2.22 Credit. With a hypothetical portfolio of $100,000, I recommend risking 2% of the portfolio’s value to this roll, which is 5 Contracts for a risk of $1,890. We will set a stop loss on the put spread at around 100% of the premium collected @ $4.44 Debit.
SBUX – Daily
$AMD
DailyPlay – Opening Trade (AMD) – October 12, 2023
AI Chip Opportunity
View AMD Trade
Strategy Details
Strategy: Short Put Vertical Spread
Direction: Bullish
Details: Sell to Open 3 Contracts Nov 24th $108/$98 Put Vertical Spreads @ $3.83 Credit per contract.
Total Risk: This trade has a max risk of $1,851 (3 Contracts x $617) based on a hypothetical $100,000 portfolio risking 2%. We suggest using 2% of your portfolio value and divide it by $617 to select the # contracts for your portfolio.
Trend Continuation Signal: This is a Bullish trade on a stock that found support and is expected to bounce higher.
1M/6M Trends: Bullish/Bullish
Relative Strength: 9/10
OptionsPlay Score: 91
Stop Loss: @ $7.65 Debit (100% loss of premium collected)
Entering the Trade
Use the following details to enter the trade on your trading platform. Please note that whenever there is a multi-leg option strategy, it should be entered as a single trade.
Please note that these prices are based on Wednesday’s closing prices. Should the underlying move significantly during the pre-market hours, we will likely adjust the strikes and prices to reflect a more accurate trade entry.
Investment Rationale
As the AI hype starts to fizzle out, comes opportunity as initial stocks that were bid up trade back to more reasonable levels. This gives us an opportunity to add some long exposure with more favorable risk/reward ratios. AMD, which expects to ship around 10% of the AI chips that market leader NVDA is the underdog to bet on with the recent pullback. With over 700% growth in their AI chips shipped in Q2, AMD is likely to cement itself as the 2nd largest AI chips supplier globally. Trading at 26x forward earnings, it trades at substantial discount to NVDA and the pullback to its $100 support level provides favorable timing to add long exposure now. As implied volatility on AMD is still very elevated, we’ll start with selling the Nov 24 $108/$98 Put Vertical @ $3.83 Credit. With a hypothetical portfolio of $100,000, I recommend risking 2% of the portfolio’s value to this trade, which is 3 Contracts for a risk of $1,851. We will set a stop loss on the put spread at around 100% of the premium collected @ $7.65 Debit.
AMD – Daily