$MA

DailyPlay – Opening Trade (MA) – November 9, 2023
MA Bearish Opening Trade Signal
View MA Trade
Strategy Details
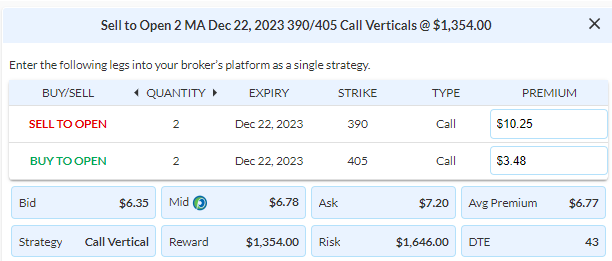
Strategy: Short Call Vertical Spread
Direction: Bearish
Details: Sell to Open 2 Contracts Dec 22nd $390/$405 Call Vertical Spreads @ $6.77 Credit per contract.
Total Risk: This trade has a max risk of $1,646 (2 Contracts x $823) based on a hypothetical $100,000 portfolio risking 2%. We suggest using 2% of your portfolio value and divide it by $823 to select the # contracts for your portfolio.
Counter Trend Signal: This is a bearish trade on a stock that is neutral.
1M/6M Trends: Neutral/Neutral
Relative Strength: 6/10
OptionsPlay Score: 110
Stop Loss: @ $13.50 Debit. (100% loss on premium paid)
Entering the Trade
Use the following details to enter the trade on your trading platform. Please note that whenever there is a multi-leg option strategy, it should be entered as a single trade.
Please note that these prices are based on Wednesday’s closing prices. Should the underlying move significantly during the pre-market hours, we will likely adjust the strikes and prices to reflect a more accurate trade entry.
Investment Rationale
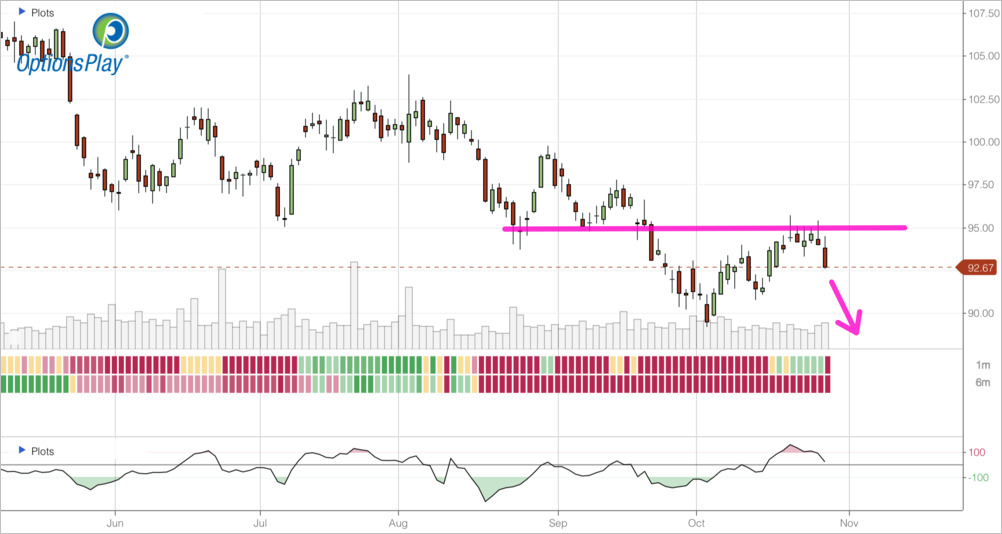
As equity markets take a pause at these major resistance levels while 10-year yields stabilize around the 4.5% mark, the risk/reward favors bearish exposure. One opportunity that has remained my radar is MA. It recently broke below its key $390 support level, and now retesting it as resistance, providing an attractive risk/reward for short exposure. MA trades at over 27x forward earnings while expecting a decent 17% EPS growth, which is on the rich side. Moreover, MA has continued to underperform its sector since the beginning of 2023 and at risk of further weakness from these resistance levels. Despite IV Rank in the bottom 10%, the options skew still favors selling a call credit spread. I’m looking to sell the Dec 22nd $390/$405 Call Vertical @ $6.78 Credit. With a hypothetical portfolio of $100,000, I recommend risking 2% of the portfolio’s value to this trade, which is 2 Contracts for a risk of $1,646. We will set a stop loss on the put spread at around 100% of the premium collected @ $13.50 Debit.
MA – Daily

DailyPlay – Opening Trade (UAL) Closing Trade (AAPL) – November 8, 2023
Closing Trade
- AAPL – 80% Loss: Sell to Close Contracts (or 100% of your Contracts) Dec 15th $170/$155 Put Vertical Spreads @ $0.80 Credit. DailyPlay Portfolio: By Closing all 10 Contracts, we will be receiving $800. We initially opened 5 Contracts on Oct 4 @ $3.94 Debit, and then another 5 Contracts on Oct 26 @ $4.00 Debit. Our average loss, therefore, is $317 per contract.
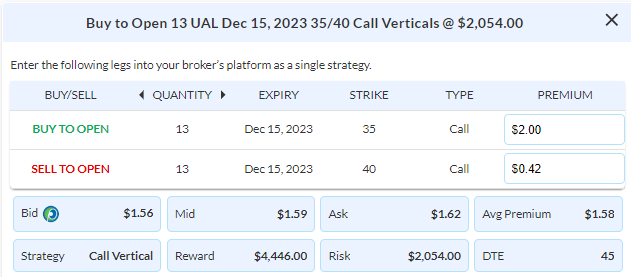
UAL Bullish Opening Trade Signal
View UAL Trade
Strategy Details
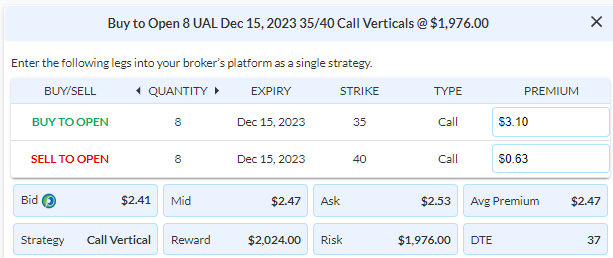
Strategy: Long Call Vertical Spread
Direction: Bullish
Details: Buy to Open 8 Contracts Dec 15th $35/$40 Call Vertical Spreads @ $2.47 Debit per contract.
Total Risk: This trade has a max risk of $1,976 (8 Contracts x $247) based on a hypothetical $100,000 portfolio risking 2%. We suggest using 2% of your portfolio value and divide it by $247 to select the # contracts for your portfolio.
Counter Trend Signal: This is a bullish trade on a stock that is neutral to bearish, but expected to break out higher.
1M/6M Trends: Neutral/ Bearish
Relative Strength: 3/10
OptionsPlay Score: 90
Stop Loss: @ $1.25 Credit. (50% loss on premium paid)
Entering the Trade
Use the following details to enter the trade on your trading platform. Please note that whenever there is a multi-leg option strategy, it should be entered as a single trade.
Please note that these prices are based on Tuesday’s closing prices. Should the underlying move significantly during the pre-market hours, we will likely adjust the strikes and prices to reflect a more accurate trade entry.
Investment Rationale
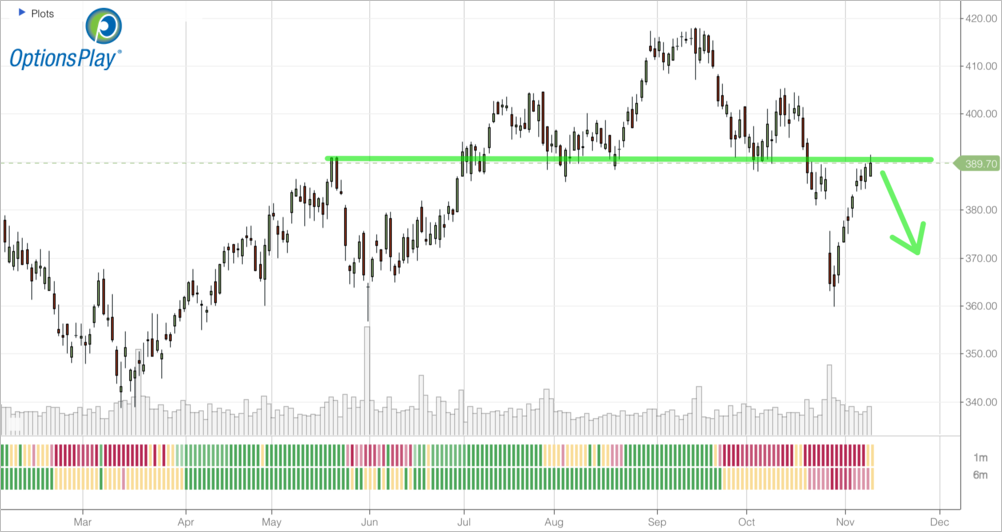
Equity markets have paused just below the $4420 major resistance level at the moment. If we see a break above that level, the next upside target is $4565. We have a few positions that require adjusting based on the risk of a significant breakout higher. AAPL despite missing earnings has failed to follow through with a selloff and remains at a rich valuation. We must close out this trade at this point and manage our other positions. One of our positions that is best poised for a breakout higher in the markets is our UAL position. We have already added to this position and have another opportunity to add one last part before it can rally to our $40 upside target. I’m looking to add another 8 contracts of the Dec $35/40 Call Vertical @ $2.47 Debit. This would risk another 2% of our hypothetical portfolio of $100,000. We will also move our stop loss on the call spread to around 50% of the premium paid @ $1.25 Credit on the full 31 contracts.
$RY
DailyPlay – Opening Trade (RY) – November 7, 2023
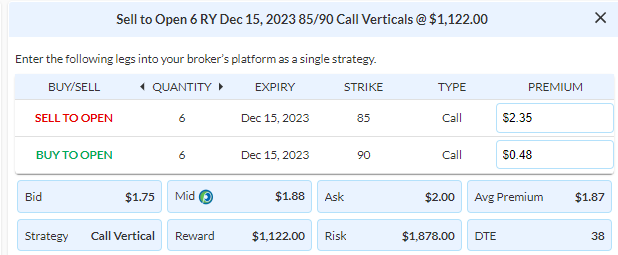
RY Bearish Opening Trade Signal
View RY Trade
Strategy Details
Strategy: Short Call Vertical Spread
Direction: Bearish
Details: Sell to Open 6 Contracts Dec 15th $85/$90 Call Vertical Spreads @ $1.87 Credit per contract.
Total Risk: This trade has a max risk of $1,878 (6 Contracts x $312) based on a hypothetical $100,000 portfolio risking 2%. We suggest using 2% of your portfolio value and divide it by $312 to select the # contracts for your portfolio.
Trend Continuation Signal: This is a bearish trade on a stock that is trading sideways to bearish.
1M/6M Trends: Mildly Bullish/ Bearish
Relative Strength: 4/10
OptionsPlay Score: 101
Stop Loss: @ $3.75 Debit. (100% loss to the value of premium collected)
Entering the Trade
Use the following details to enter the trade on your trading platform. Please note that whenever there is a multi-leg option strategy, it should be entered as a single trade.
Please note that these prices are based on Monday’s closing prices. Should the underlying move significantly during the pre-market hours, we will likely adjust the strikes and prices to reflect a more accurate trade entry.
Investment Rationale
Equity markets have paused on the back of last week’s rally and is starting to doubt the Fed pause as 10-year yields started to climb again after dipping below 4.5%. I am still in the camp that this rally provides a favorable risk/reward entry for bearish exposure. Banks are particularly exposed in this interest rate environment and will likely continue to underperform if yields continue to rise and steepen. Recently Royal Bank of Canada broke below a key level of support at $86 and now has rallied back up to retest it as resistance. This is an ideal entry for short exposure where the risk/reward is extremely favorable. I’m looking to sell the RY Dec $85/90 Call Vertical @ $1.87 Credit. With a hypothetical portfolio of $100,000, I recommend risking 2% of the portfolio’s value which is 6 Contracts for a risk of $1,878. We will set a stop loss on the put spread at around 100% of the premium collected @ $3.75 Debit.
$FDX
DailyPlay – Opening Trade (FDX) Closing Trade (TMUS) – November 6, 2023
Closing Trade
- TMUS – 68.33% Gain: Buy to Close 6 Contracts (or 100% of your Contracts) Dec 15th $140/$135 Put Vertical Spreads @ $0.57 Debit. DailyPlay Portfolio: By Closing all 6 Contracts, we will be paying $342. We initially opened these 6 Contracts on Oct 30 @ $1.80 Credit. Our average gain, therefore, is $123 per contract.
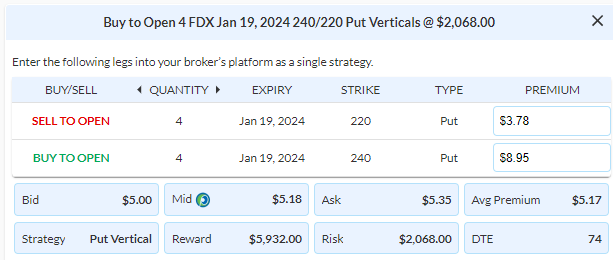
FDX Bearish Opening Trade Signal
View FDX Trade
Strategy Details
Strategy: Long Put Vertical Spread
Direction: Bearish
Details: Buy to Open 4 Contracts Jan 19th $240/$220 Put Vertical Spreads @ $5.18 Debit per contract.
Total Risk: This trade has a max risk of $2,068 (4 Contracts x $518) based on a hypothetical $100,000 portfolio risking 2%. We suggest using 2% of your portfolio value and divide it by $518 to select the # contracts for your portfolio.
Trend Continuation Signal: This is a bearish trade on a stock that is neutral and expected to continue lower.
1M/6M Trends: Neutral/Neutral
Relative Strength: 7/10
OptionsPlay Score: 135
Stop Loss: @ $2.60 Credit. (50% loss on premium paid)
Entering the Trade
Use the following details to enter the trade on your trading platform. Please note that whenever there is a multi-leg option strategy, it should be entered as a single trade.
Please note that these prices are based on Friday’s closing prices. Should the underlying move significantly during the pre-market hours, we will likely adjust the strikes and prices to reflect a more accurate trade entry.
Investment Rationale
Equity markets staged an impressive rally last week on the back of Powell’s comments and a retreat on 10-year yields back to 4.5%. The question is how far can this rally go? Currently, we are watching the $4400-$4410 level as the major resistance level on the S&P that has to be broken for the rally to continue. Otherwise, the trend remains in a neutral to bearish trend. The risk/reward ratio after last week’s rally favors adding bearish exposure if you still believe in a bearish fundamental narrative as I do. Looking at our open positions, we are taking profits on is our initial TMUS Dec $140/135 Put Vertical that was sold for around $1.80 Credit, now trading at $0.57 Debit. We continue to hold our 2nd TMUS Dec $145/$140 Put Vertical.
Additionally one bearish position worth establishing where the risk/reward is favorable is FDX. We recently successfully close out a UPS bearish position and FDX fits the same thesis. It’s recent rally towards its $250 resistance level provides an attractive entry. With global shipping volumes continuing to decline, the fundamentals and outlook for industrial transport companies look shaky at best. I’d buy the Jan $240/$220 Put Vertical @ $5.17 Debit. With a hypothetical portfolio of $100,000, I recommend risking 2% of the portfolio’s value to this roll, which is 4 Contracts for a risk of $2,068. We will set a stop loss on the put spread at around 50% of the premium paid @ $2.60 Credit.
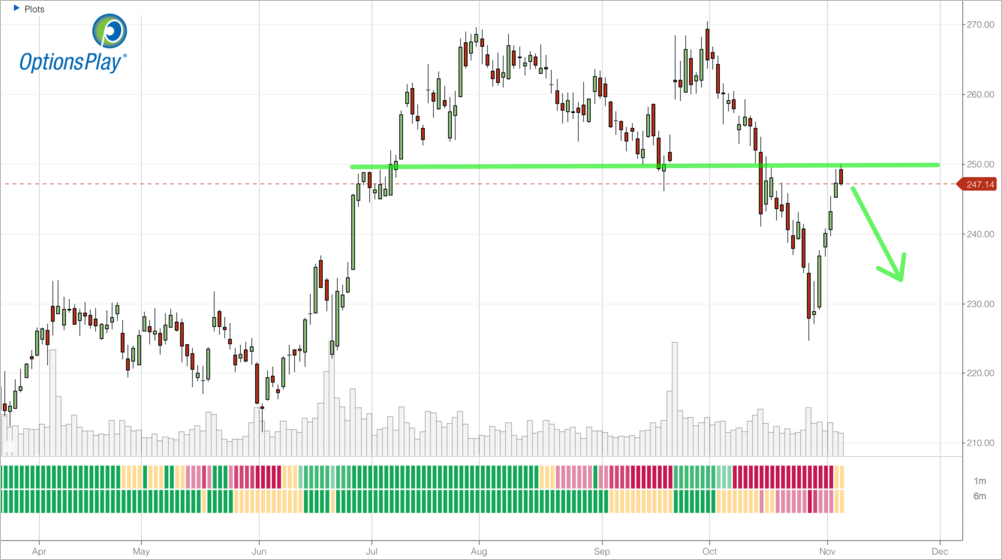
FDX – Daily
$UAL

DailyPlay – Opening Trade (UAL) Closing Trade (SBUX) – November 3, 2023
Closing Trade
- SBUX – 124.89% Loss: Buy to Close 10 Contracts (or 100% of your Contracts) Nov 24th $92/$98 Call Vertical Spreads @ $5.24 Debit. DailyPlay Portfolio: By Closing all 10 Contracts, we will be paying $5,240. We initially opened 5 of these Contracts on Oct 13 @ $2.22 Credit and then another 5 Contracts on Oct 27 @ $2.44 Credit. Our average loss, therefore, is $291 per contract.
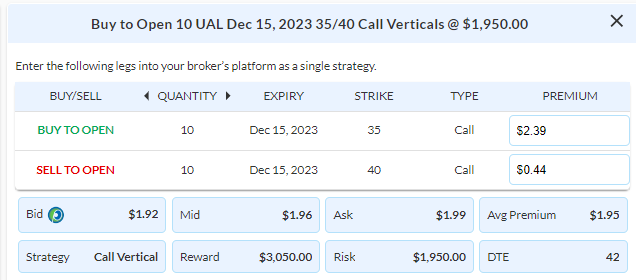
UAL Bullish Opening Trade Signal
View UAL Trade
Strategy Details
Strategy: Long Call Vertical Spread
Direction: Bullish
Details: Buy to Open 10 Contracts Dec 15th $35/$40 Call Vertical Spreads @ $1.95 Debit per contract.
Total Risk: This trade has a max risk of $1,950 (10 Contracts x $195) based on a hypothetical $100,000 portfolio risking 2%. We suggest using 2% of your portfolio value and divide it by $195 to select the # contracts for your portfolio.
Counter Trend Signal: This is a bullish trade on a stock that is bouncing higher off support.
1M/6M Trends: Bearish/Bearish
Relative Strength: 2/10
OptionsPlay Score: 99
Stop Loss: @ $1.00 Credit. (50% loss on premium paid)
Entering the Trade
Use the following details to enter the trade on your trading platform. Please note that whenever there is a multi-leg option strategy, it should be entered as a single trade.
Please note that these prices are based on Thursday’s closing prices. Should the underlying move significantly during the pre-market hours, we will likely adjust the strikes and prices to reflect a more accurate trade entry.
Investment Rationale
Markets have roared back to life after Powell’s comments yesterday which has been interpreted as a dovish pivot. Let’s review a couple of our positions. SBUX earnings came in better than expected and provided strong guidance and has now moved substantially higher today. We must manage this by simply closing out the entire position. Our UAL position has started to take off from the lows and working towards our $41 target. I want to take this opportunity to add further exposure to this position. I’m looking to purchase 10 more contracts of the Dec $35/40 Call Vertical @ $1.95 Debit. With a hypothetical portfolio of $100,000, this would be adding 2% of the portfolio’s value, which is 10 Contracts for a risk of $1,950. We will move our stop loss on the put spread to around 50% of the premium paid @ $1.00 Credit on the full 23 contracts.
$TMUS
DailyPlay – Opening Trade (TMUS) – November 2, 2023
TMUS Bullish Opening Trade Signal
View TMUS Trade
Strategy Details
Strategy: Short Put Vertical Spread
Direction: Bullish
Details: Sell to Open 6 Contracts Dec 15th $145/$140 Put Vertical Spreads @ $1.72 Credit per contract.
Total Risk: This trade has a max risk of $1,968 (6 Contracts x $328) based on a hypothetical $100,000 portfolio risking 2%. We suggest using 2% of your portfolio value and divide it by $328 to select the # contracts for your portfolio.
Trend Continuation Signal: This is a bullish trade on a stock that is in a bullish trend and is expected to continue higher.
1M/6M Trends: Bullish/Bullish
Relative Strength: 8/10
OptionsPlay Score: 89
Stop Loss: @ $3.50 Debit. (100% loss on premium paid)
Entering the Trade
Use the following details to enter the trade on your trading platform. Please note that whenever there is a multi-leg option strategy, it should be entered as a single trade.
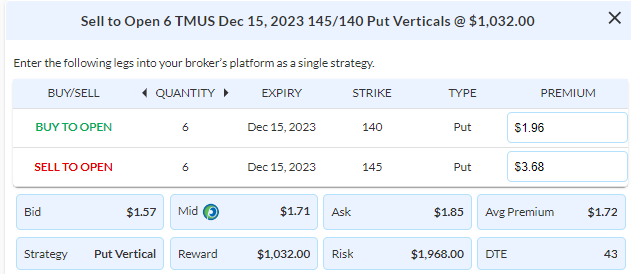
Please note that these prices are based on Wednesday’s closing prices. Should the underlying move significantly during the pre-market hours, we will likely adjust the strikes and prices to reflect a more accurate trade entry.
Investment Rationale
The Fed’s decision yesterday largest sets up for a peak in interest rate hikes for 2023 and potentially into the rest of 2024. This has pared 10-year yield below 4.8%, giving equities a bit of breathing room. The S&P 500 and Nasdaq-100 both sit just above their major support levels at $4220 and $14,500 and would need to close above it for bulls to potentially wrestle back control. One of our positions, TMUS has worked out nicely in a short amount of time and provides an opportunity to add some further exposure. We will maintain our current position of the Dec $140/$135 Put Vertical for further potential gain, while selling the Dec $145/140 Put Vertical @ $1.72 Credit for more premium. With a hypothetical portfolio of $100,000, I recommend risking another 2% of the portfolio’s value to this roll, which is 6 Contracts for a risk of $1,968. We will set a stop loss on the put spread at around 100% of the premium collected @ $3.50 Debit.
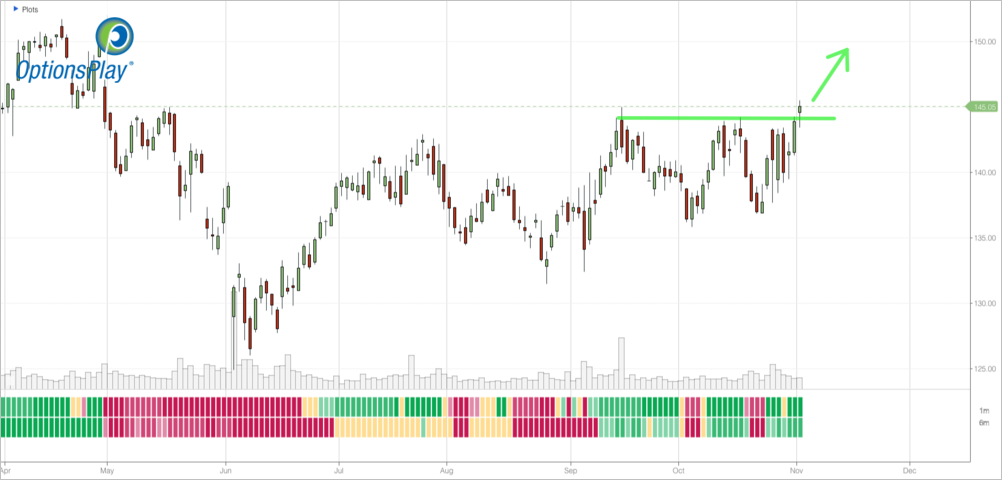
TMUS – Daily
$PSX
DailyPlay – Opening Trade (PSX) – November 1, 2023
PSX Bearish Opening Trade Signal
View PSX Trade
Strategy Details
Strategy: Short Call Vertical Spread
Direction: Bearish
Details: Sell to Open 6 Contracts Dec 15th $115/$120 Call Vertical Spreads @ $1.88 Credit per contract.
Total Risk: This trade has a max risk of $1,872 (6 Contracts x $312) based on a hypothetical $100,000 portfolio risking 2%. We suggest using 2% of your portfolio value and divide it by $312 to select the # contracts for your portfolio.
Counter Trend Signal: This is a bearish trade on a stock that is trading neutral, but expected to break lower.
1M/6M Trends: Neutral/Neutral
Relative Strength: 9/10
OptionsPlay Score: 97
Stop Loss: @@ $3.75 Debit. (100% loss on premium paid)
Entering the Trade
Use the following details to enter the trade on your trading platform. Please note that whenever there is a multi-leg option strategy, it should be entered as a single trade.
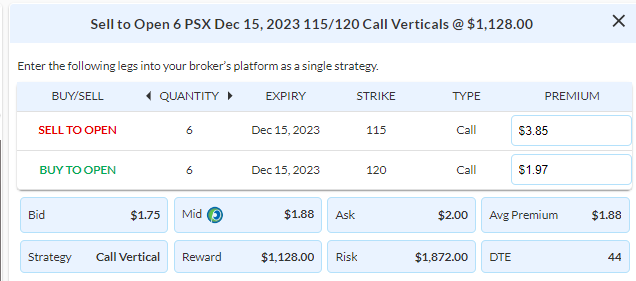
Please note that these prices are based on Tuesday’s closing prices. Should the underlying move significantly during the pre-market hours, we will likely adjust the strikes and prices to reflect a more accurate trade entry.
Investment Rationale
With oil prices in retreat, energy stocks are losing its leadership and at risk of pulling back. If we look at PSX, it recently has started to complete the right shoulder in a head & shoulders topping formation. This is a sign that there could be some downside as oil prices trade near 6-month lows and broke below key level of support at $83. This will put pressure on energy stocks global breakeven costs continue to rise and demand continues to remain soft despite restrictions on supply. PSX also trades at the higher end of its valuation compared to its peers considering analysts are expecting EPS to contract by 15% in FY2024. While my view isn’t overly bearish, I think it’s an opportunity to establish a neutral to bearish stance by selling a call spread. I’m looking to sell the Dec $115/120 Call Vertical @ $1.88 Credit. With a hypothetical portfolio of $100,000, I recommend risking 2% of the portfolio’s value to this roll, which is 6 Contracts for a risk of $1,872. We will set a stop loss on the put spread at around 100% of the premium collected @ $3.75 Debit.
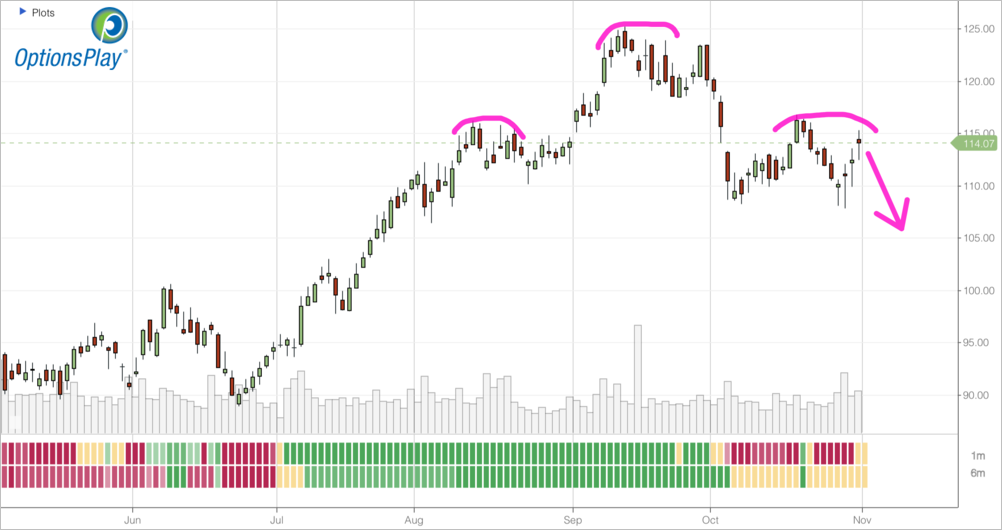
PSX – Daily
$UAL
DailyPlay – Opening Trade (UAL) – October 31, 2023
UAL Bullish Opening Trade Signal
View UAL Trade
Strategy Details
Strategy: Long Call Vertical Spread
Direction: Bullish
Details: Buy to Open 13 Contracts Dec 15th $35/$40 Call Vertical Spreads @ $1.58 Debit per contract.
Total Risk: This trade has a max risk of $2,054 (13 Contracts x $158) based on a hypothetical $100,000 portfolio risking 2%. We suggest using 2% of your portfolio value and divide it by $158 to select the # contracts for your portfolio.
Counter Trend Signal: This is a bullish trade on a stock that is expected to bounce higher off support.
1M/6M Trends: Bearish/Bearish
Relative Strength: 2/10
OptionsPlay Score: 105
Stop Loss: @ $0.80 Credit. (50% loss on premium paid)
Entering the Trade
Use the following details to enter the trade on your trading platform. Please note that whenever there is a multi-leg option strategy, it should be entered as a single trade.
Please note that these prices are based on Monday’s closing prices. Should the underlying move significantly during the pre-market hours, we will likely adjust the strikes and prices to reflect a more accurate trade entry.
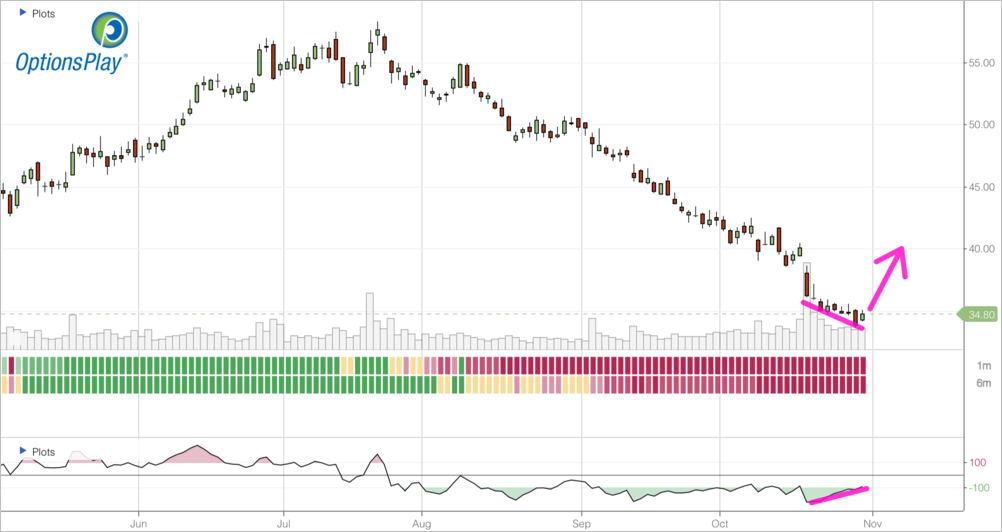
Investment Rationale
Despite rallying over 1% after last week’s selloff, bonds continued to sell off and yields climbed above 4.85%. This remains the primary headwind for equities alongside an earnings season that is showing signs of uncertainty for the future. As we look for opportunities, we seek weak sectors that are showing signs of selloff exhaustion and have bounce potential. One sector worth paying attention to is the Airline industry. With oil prices moderating, and international travel continuing to show signs of strength, international carriers such as UAL stand to potentially benefit. Trading at only 3.5x forward earnings, UAL trades at a substantial discount to its historical valuations and presents a great bounce opportunity. I’m looking to Buy the Dec $35/$40 Call Vertical @ $1.58 Debit. With a hypothetical portfolio of $100,000, I recommend risking 2% of the portfolio’s value to this roll, which is 13 Contracts for a risk of $2,054. We will set a stop loss on the put spread at around 50% of the premium paid @ $0.80 Credit.
UAL – Daily
$TMUS
DailyPlay – Opening Trade (TMUS) Closing Trades (RCL, SNAP) – October 30, 2023
Closing Trade
- RCL – 34.19% Gain: Sell to Close 4 Contracts (or 100% of your Contracts) Nov 17th $90/$75 Put Vertical Spreads @ $7.06 Credit. DailyPlay Portfolio: By Closing all 4 Contracts, we will be receiving $2,824. We initially opened these 4 Contracts on Oct 18 @ $5.26 Debit. Our average gain, therefore, is $180 per contract.
- SNAP – 42.59% Loss: Sell to Close 38 Contracts (or 100% of your Contracts) Nov 17th $9/$7 Put Vertical Spreads @ $0.31 Credit. DailyPlay Portfolio: By Closing all 38 Contracts, we will be receiving $1,178. We initially opened these 38 Contracts on Oct 20 @ $0.54 Debit. Our average loss, therefore, is $23 per contract.
TMUS Bullish Opening Trade Signal
View TMUS Trade
Strategy Details
Strategy: Short Put Vertical Spread
Direction: Bullish
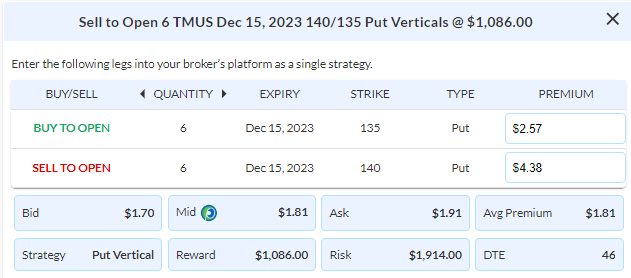
Details: Sell to Open 6 Contracts Dec 15th $140/$135 Put Vertical Spreads @ $1.81 Credit per contract.
Total Risk: This trade has a max risk of $1,914 (6 Contracts x $319) based on a hypothetical $100,000 portfolio risking 2%. We suggest using 2% of your portfolio value and divide it by $319 to select the # contracts for your portfolio.
Trend Continuation Signal: This is a bullish trade on a stock that is neutral to bullish
1M/6M Trends: Neutral/Mildly Bullish
Relative Strength: 7/10
OptionsPlay Score: 89
Stop Loss: @ $3.60 Debit. (100% loss).
Entering the Trade
Use the following details to enter the trade on your trading platform. Please note that whenever there is a multi-leg option strategy, it should be entered as a single trade.
Please note that these prices are based on Friday’s closing prices. Should the underlying move significantly during the pre-market hours, we will likely adjust the strikes and prices to reflect a more accurate trade entry.
Investment Rationale
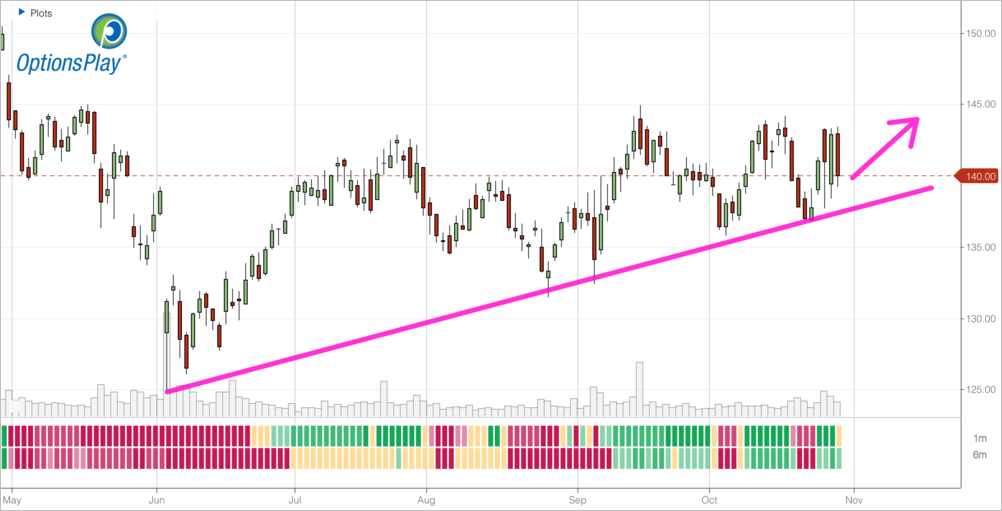
Both the S&P and Nasdaq indices printed fresh recent lows last week below key major support levels. However, there are signs that the sell off that now bleeds into all sectors are showing some signs of exhaustion. Lower low’s in price are no longer confirmed by lower lows in momentum, this leads to a higher probability of a bounce in equities. The question is how far? My view is that this is an opportunity to start reducing bearish exposure, add neutral to bullish exposure in the short run and see. With this in mind, we are going to close out our RCL (which intra-week reached our $78.50 target) and SNAP positions, while adding TMUS to our DailyPlay portfolio. After reporting strong guidance on earnings last week, TMUS’s recent revisit of its $140 support level provides a strong risk/reward entry for bullish exposure. It’s strong free cash-flow and low churn rates provides safety for investors as the outlook for consumers continue to look more uncertain. I’m looking to sell the Dec $140/$135 Put Vertical @ $1.81 Credit. With a hypothetical portfolio of $100,000, I recommend risking 2% of the portfolio’s value to this roll, which is 6 Contracts for a risk of $1,914. We will set a stop loss on the put spread at around 100% of the premium collected @ $3.60 Debit.
TMUS – Daily
$SBUX
DailyPlay – Opening Trade (SBUX) – October 27, 2023
SBUX Bearish Opening Trade Signal
View SBUX Trade
Strategy Details
Strategy: Short Call Vertical Spread
Direction: Bearish
Details: Sell to Open 5 Contracts Nov 24th $92/$98 Call Vertical Spreads @ $2.44 Credit per contract.
Total Risk: This trade has a max risk of $1,780 (5 Contracts x $356) based on a hypothetical $100,000 portfolio risking 2%. We suggest using 2% of your portfolio value and divide it by $356 to select the # contracts for your portfolio.
Trend Continuation Signal: This is a bearish trade on a stock that is in a bearish
1M/6M Trends: Bearish/Bearish
Relative Strength: 4/10
OptionsPlay Score: 100
Stop Loss: @ $5.00 Debit. (100% loss of premium paid)
Entering the Trade
Use the following details to enter the trade on your trading platform. Please note that whenever there is a multi-leg option strategy, it should be entered as a single trade.
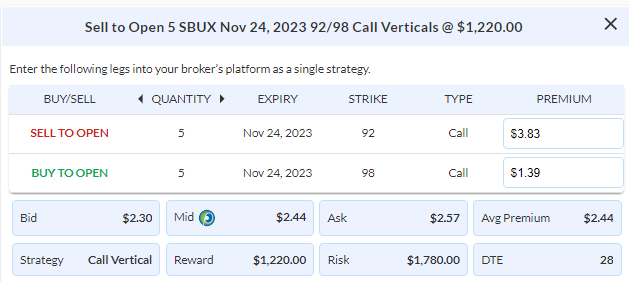
Please note that these prices are based on Thursday’s closing prices. Should the underlying move significantly during the pre-market hours, we will likely adjust the strikes and prices to reflect a more accurate trade entry.
Investment Rationale
The S&P 500 and the Nasdaq-100 have now both broken its major support levels at $4220 and $14,500 yesterday. This is a bearish signal that could open up further downside in equities. We currently have two large bearish positions in AAPL and RCL that are profitable with more downside potential. One position that is near breakeven but has further potential is SBUX. I’m going to suggest adding further bearish exposure in SBUX here by selling another 5 contracts of the Nov 24 $92/98 Call Vertical @ $2.44 Credit. This is risking roughly another 2% of our hypothetical $100,000 portfolio. We will move our stops on the call spread to around 100% of the premium collected @ $5.00 Debit.
SBUX – Daily