
NVDA

DailyPlay – Adjusting Trade (NVDA) – December 10, 2025
NVDA Bullish Trade Adjustment Signal
Investment Rationale
Adjustment Rationale:
Bullish Long Call – NVIDIA Corporation (NVDA) – We maintain our longer-term bullish outlook following NVIDIA’s recent earnings report, which delivered a beat on both the top and bottom line, alongside strong forward guidance. The company continues to demonstrate healthy fundamentals, and market tone has turned more favorable as the stock stabilizes after its consolidation phase. That said, the OptionsPlay platform has triggered a short-term Bearish Trend Following signal, suggesting that the recent rebound is unfolding within a broader downtrend and could be susceptible to near-term weakness. With modest gains in our existing long call, we will use this signal as an opportunity to hedge by selling a shorter-dated call against our longer-dated position. This strategy allows us to collect premium, reduce the overall cost basis of the long call position, and maintain long-term upside exposure.
Adjustment Trade:
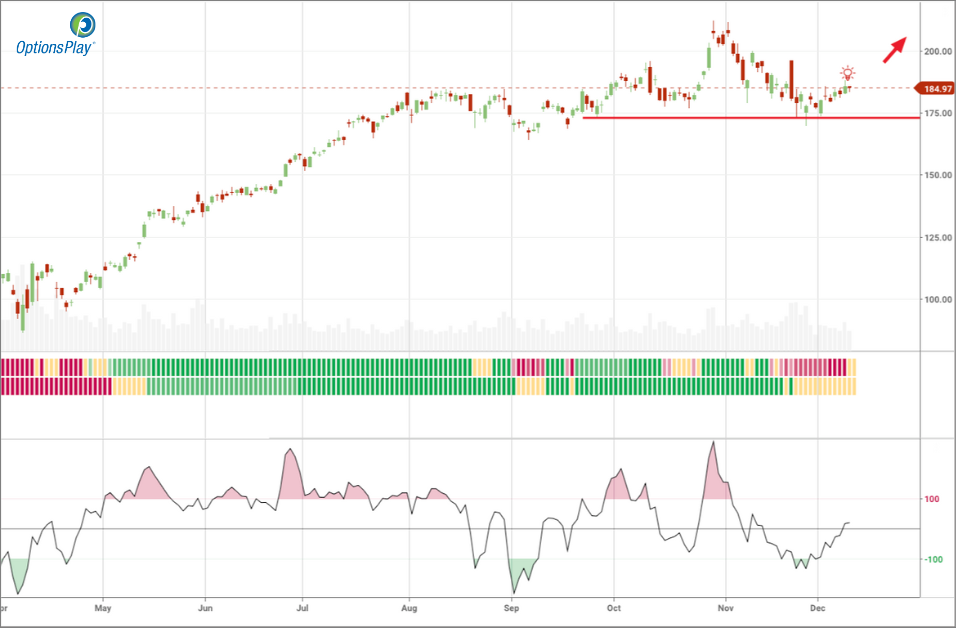
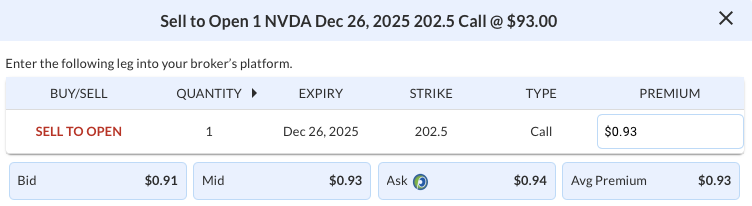
NVDA @ $184.97
Days to Expiration (DTE): 16
Sell to Open 1 Dec 26, 2025 202.5 Call @ $0.93
Mid: $0.93
Premium Received: $93.00 per call option sold
or $93 total adjustment in the cost basis for the position.
The total risk for the new position is $4,463 (original cost basis) minus $93 (credit), resulting in a revised cost basis of $4,370.
Resulting Position:
Long 1 NVDA Jun 18, 2026 148 Call
Short 1 NVDA Dec 26, 2025 202.5 Call
New cost basis and total risk: $4,370
NVDA – Daily
Trade Details
Strategy Details
Strategy: Short Call
Direction: Resulting in a new Bullish Diagonal Spread
Details: Sell to Open 1 NVDA Dec 26 $202.50 Call @ $0.93 Credit.
Total Risk: The resulting position has a maximum risk of $4,370 (4,463-93), calculated as the initial cost basis of the long call ($4,463) minus the premium received from the adjustment ($93).
Trend Continuation Signal: This is a bullish trade on a stock that is expected to continue higher over the duration of the trade.
1M/6M Trends: Neutral/Neutral
Relative Strength: 9/10
Stop Loss: @ $21.85 (50% loss of premium)
Entering the Trade
Use the following details to enter the trade on your trading platform. Please note that whenever there is a multi-leg option strategy, it should be entered as a single trade.
PLEASE NOTE that these prices are based on Tuesday’s closing prices. Should the underlying move significantly during the pre-market hours, we will likely adjust the strikes and prices to reflect a more accurate trade entry.
AKAM
DailyPlay – Opening Trade (AKAM) – December 09, 2025
AKAM Bullish Opening Trade Signal
Investment Rationale
Investment Thesis
Akamai Technologies (AKAM) presents a compelling bullish opportunity supported by a combination of attractive valuation, improving sentiment in edge infrastructure and cloud security, and a steady shift toward higher-margin service lines. With the stock resetting into support following a prior breakout, the current setup offers a balanced blend of trend durability and asymmetrical upside potential. The company’s stable cash-flow profile and continued momentum in security and compute services reinforce a positive outlook as the market increasingly values quality software infrastructure names.
Technical Analysis
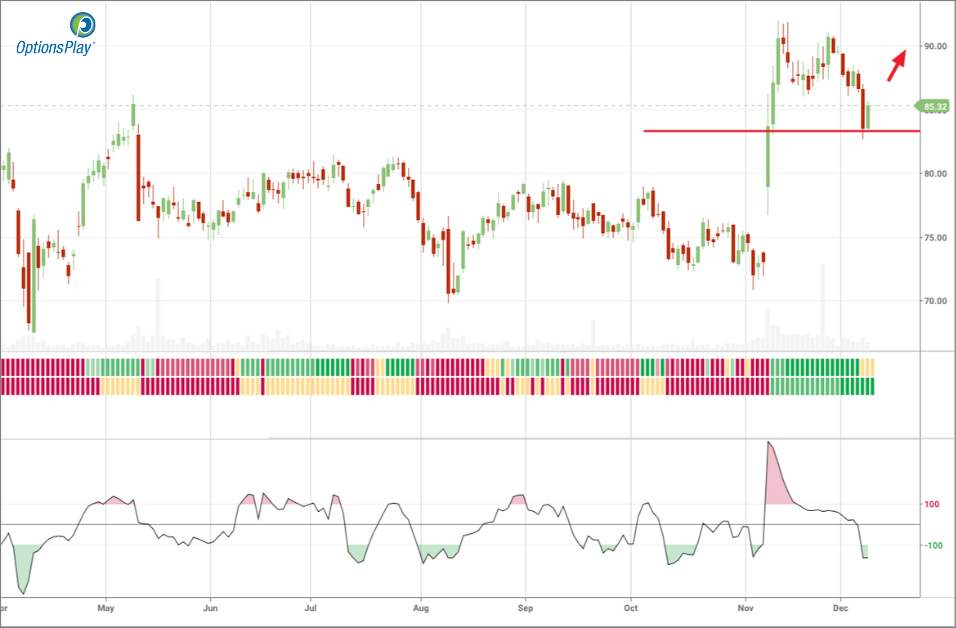
The chart shows AKAM recently reclaiming the 200-day moving average, with both the 20-day and 50-day moving averages now crossing above it. Notably, a bullish trend-following alert was triggered on the OptionsPlay platform, underscoring that Akamai’s recent pullback is occurring within a broader upward trend and reinforcing a favorable bullish risk-reward profile. The pullback from the $90 region has brought price back into the rising 20-day and 50-day moving averages, levels that historically act as supportive retracement zones within an established trend.
Fundamental Analysis
AKAM continues to trade at a discount to peers on forward earnings, despite maintaining a meaningfully stronger margin profile. Growth expectations sit modestly below the industry median, yet the company’s recurring-revenue base, disciplined operational execution, and expanding security portfolio provide a durable backdrop that is not fully priced in. This combination of discounted valuation and above-average profitability supports a favorable risk-adjusted bullish stance.
- Forward PE Ratio: 11.43x vs. Industry Median 22.53x
- Expected EPS Growth: 7.21% vs. Industry Median 10.99%
- Expected Revenue Growth: 5.62% vs. Industry Median 9.35%
- Net Margins: 12.26% vs. Industry Median 9.08%
Options Trade
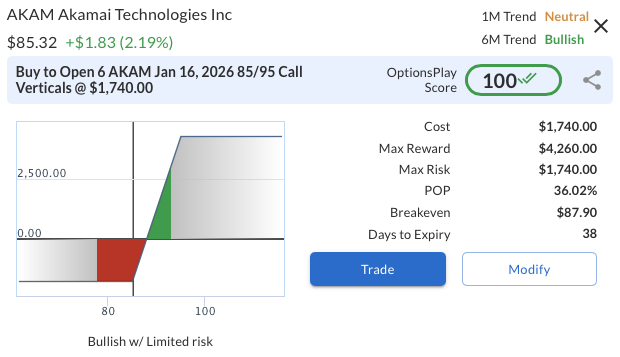
The proposed bullish call vertical spread involves buying the Jan 16, 2026 $85 call and selling the Jan 16, 2026 $95 call for a net debit of approximately $2.90. This trade offers a maximum potential gain of $7.10 if AKAM closes at or above $95 at expiration, while the risk is limited to the net debit paid. The trade’s reward-to-risk ratio of about 2.4:1 aligns with a bullish outlook while keeping risk defined and controlled.
AKAM – Daily
Trade Details
Strategy Details
Strategy: Long Call Vertical Spread
Direction: Bullish Debit Spread
Details: Buy to Open 6 AKAM Jan 16 $85/$95 Call Vertical Spreads @ $2.90 Debit per Contract.
Total Risk: This trade has a max risk of $1,740 (6 Contracts x $290) based on a hypothetical $100k portfolio risking 2%. We suggest risking only 2% of the value of your portfolio and divide it by $290 to select the # contracts for your portfolio.
Trend Continuation Signal: This is a bullish trade on a stock that is expected to continue higher over the duration of this trade.
1M/6M Trends: Neutral/Bullish
Relative Strength: 6/10
OptionsPlay Score: 100
Stop Loss: @ $1.45 (50% loss of premium)
View AKAM Trade
Entering the Trade
Use the following details to enter the trade on your trading platform. Please note that whenever there is a multi-leg option strategy, it should be entered as a single trade.
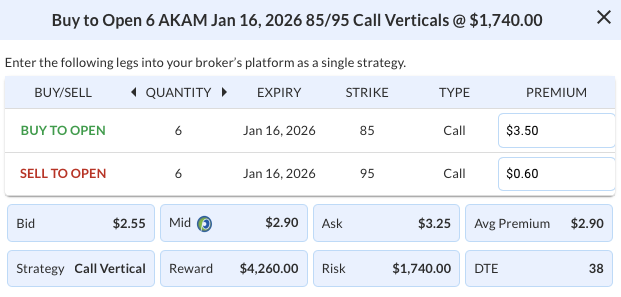
PLEASE NOTE that these prices are based on Monday’s closing prices. Should the underlying move significantly during the pre-market hours, we will likely adjust the strikes and prices to reflect a more accurate trade entry.
View AKAM Trade

DailyPlay – Portfolio Review – December 08, 2025
DailyPlay Portfolio Review
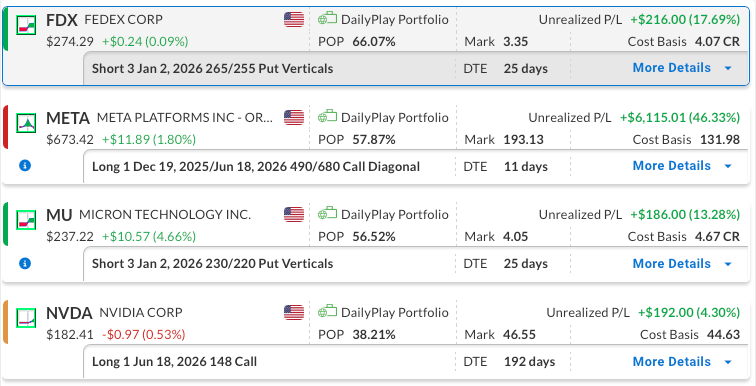
Our Trades
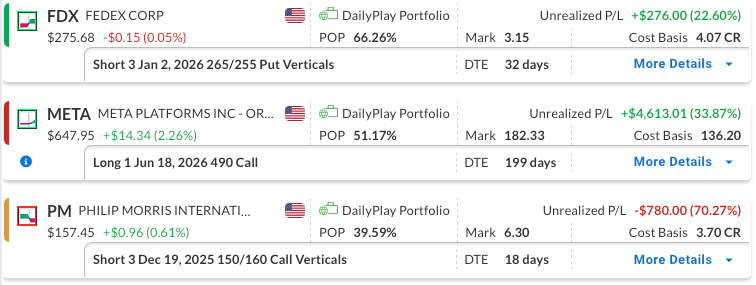
FDX – 25 DTE
Bullish Credit Spread – FedEx Corp (FDX) – We have a solid gain in this position and plan to stay the course for now.
META – 11 DTE & 192 DTE
Bullish Diagonal Debit Spread – Meta Platforms, Inc. (META) – Our outlook supports a longer-term bullish approach. The position is currently showing a gain, and we plan to maintain it. We recently sold a short-term call against the longer-dated call to help reduce the overall cost basis.
MU – 25 DTE
Bullish Credit Spread – Micron Technology, Inc. (MU) – The position is showing a gain, with earnings scheduled for Wednesday, December 17th, after the close. We will maintain the position for now, and if the bullish momentum continues, we may look to exit before taking on the risk associated with the earnings announcement.
NVDA – 192 DTE
Bullish Long Call – NVIDIA Corporation (NVDA) – NVIDIA’s fundamentals remain robust, and sentiment has begun to build bullish momentum after its recent consolidation. This continues to make the long call an attractive way to participate in the longer-term outlook without the cost of owning shares outright. We plan to hold the position for now.
PM

DailyPlay – Closing Trade (PM) – December 05, 2025
Closing Trade
- PM – 38% gain: Buy to Close 3 Contracts (or 100% of your Contracts) Dec 19 $150/$160 Call Vertical Spreads @ $2.30 Debit. DailyPlay Portfolio: By Closing 3 Contracts, we will be paying $690. We initially opened these 3 contracts on November 07 @ $3.70 Credit. Our gain, therefore, is $420.
MU
DailyPlay – Opening Trade (MU) – December 04, 2025
MU Bullish Opening Trade Signal
Investment Rationale
Investment Thesis
Micron Technology (MU) remains a compelling bullish opportunity as the company continues to benefit from structural demand strength in AI-driven memory and storage markets. With earnings scheduled for Wednesday, December 17th after the close, the setup favors continued momentum as investors position for potentially strong guidance tied to improving DRAM/NAND pricing and accelerating data-center demand. The stock’s recent performance underscores a market increasingly willing to reward high-quality semiconductor names with exposure to AI infrastructure, supporting a constructive medium-term outlook.
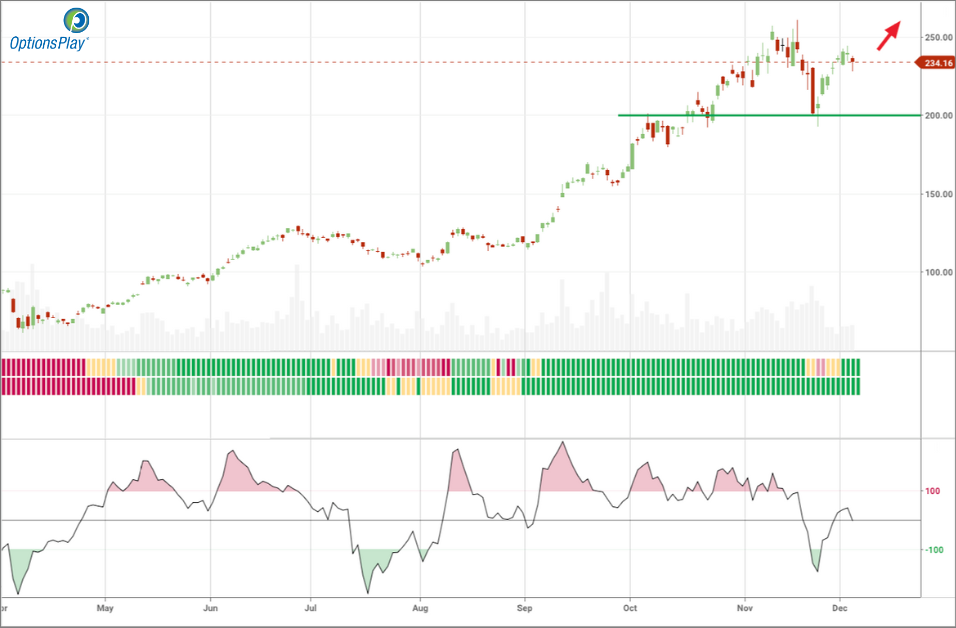
Technical Analysis
After pushing through its earlier consolidation zone, MU has sustained notable outperformance relative to the broader semiconductor space and the overall market. Price remains firmly anchored above the 50-day and 200-day moving averages, while the 20-day moving average is acting as a resistance level. The stock’s strong recovery from its recent dip improves the setup, and a move back through the $244.37 short-term high would reinforce momentum toward the $250 objective.
Fundamental Analysis
Micron screens as substantially undervalued relative to peers despite materially better growth and margin expectations. The company is entering a favorable phase of the memory cycle supported by strengthening pricing, expanding AI-related demand, and disciplined supply management across the industry. MU’s forward valuation reflects skepticism that appears misaligned with its accelerating fundamental trajectory, especially given the company’s leadership position in high-performance memory essential to AI compute architectures.
- Forward PE Ratio: 13.86x vs. Industry Median 26.41x
- Expected EPS Growth: 37.98% vs. Industry Median 18.61%
- Expected Revenue Growth: 21.38% vs. Industry Median 10.60%
- Net Margins: 22.85% vs. Industry Median 14.16%
Options Trade
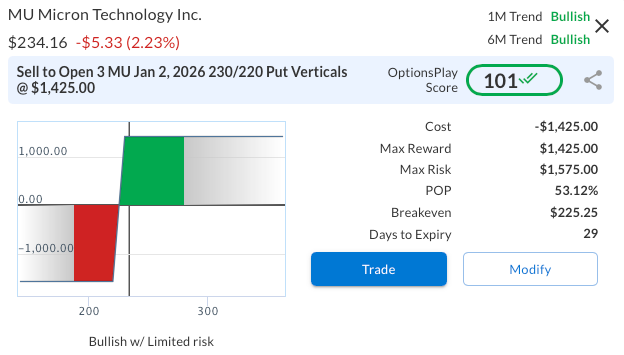
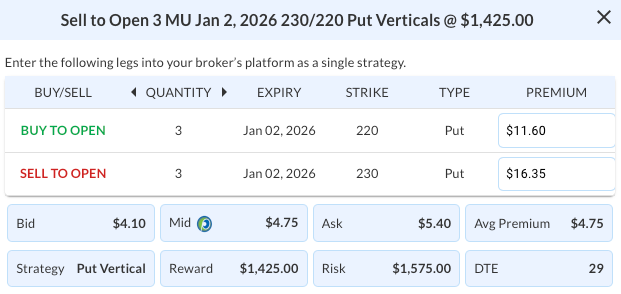
A favorable way to express a bullish stance ahead of the December 17 earnings event is the MU Jan 2, 2026 230/220 Put Vertical spread, selling the 230 strike put and buying the 220 strike put for a net credit of approximately $4.75, offering a $475 maximum reward against a defined $525 maximum risk. This structure benefits from MU holding above the $230 level—consistent with current technical support—and provides a cushion below spot, allowing the trade to profit even if the stock pulls back modestly after earnings. The spread offers attractive risk-adjusted income while maintaining directionally bullish exposure with limited downside.
MU – Daily
Trade Details
Strategy Details
Strategy: Short Put Vertical Spread
Direction: Bullish Credit Spread
Details: Sell to Open 3 MU Jan 02 $230/$220 Put Vertical Spreads @ $4.75 Credit per Contract.
Total Risk: This trade has a max risk of $1,575 (3 Contracts x $525) based on a hypothetical $100k portfolio risking 2%. We suggest risking only 2% of the value of your portfolio and divide it by $525 to select the # contracts for your portfolio.
Trend Continuation Signal: This is a bullish trade on a stock that is expected to continue higher over the duration of this trade.
1M/6M Trends: Bullish/Bullish
Relative Strength: 10/10
OptionsPlay Score: 101
Stop Loss: @ $9.50 (100% loss to value of premium)
View MU Trade
Entering the Trade
Use the following details to enter the trade on your trading platform. Please note that whenever there is a multi-leg option strategy, it should be entered as a single trade.
PLEASE NOTE that these prices are based on Wednesday’s closing prices. Should the underlying move significantly during the pre-market hours, we will likely adjust the strikes and prices to reflect a more accurate trade entry.
View MU Trade
NVDA
DailyPlay – Opening Trade (NVDA) – December 03, 2025
NVDA Bullish Opening Trade Signal
Investment Rationale
Investment Thesis
NVIDIA Corporation continues to represent a premier AI and semiconductor leader, supported by accelerating demand across data center, enterprise AI, and next-generation GPU deployments. While near-term price action has been range-bound, the broader setup remains constructive as the company builds on its strong earnings results and robust forward guidance. NVDA’s dominant position in accelerated computing, combined with its expanding software and networking ecosystem, supports a durable long-term growth outlook. With fundamentals firmly intact and sentiment stabilizing after a healthy consolidation, the stock offers an attractive opportunity for investors seeking leveraged exposure to AI infrastructure growth.
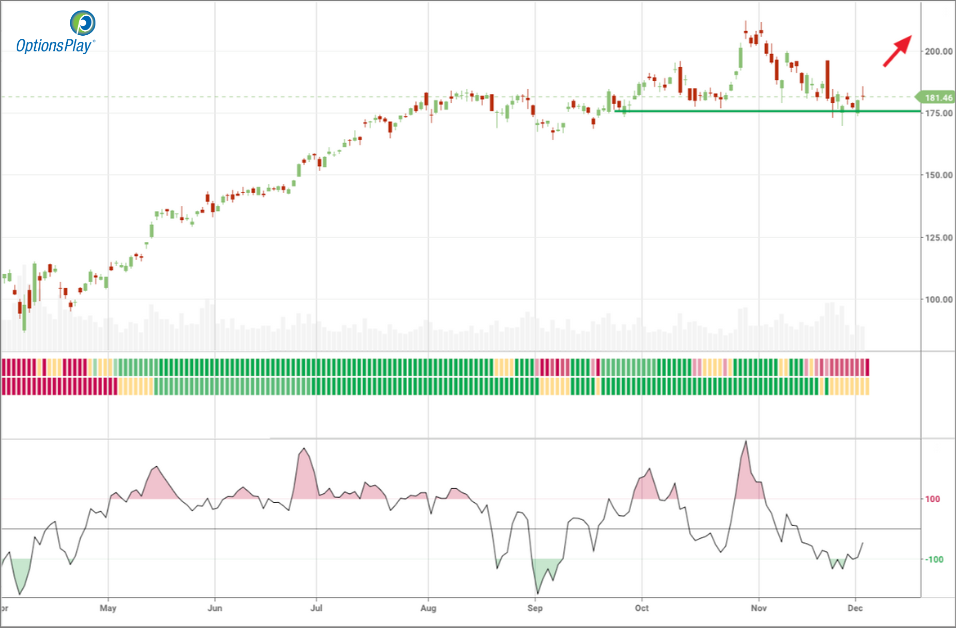
Technical Analysis
NVIDIA’s technical picture has been relatively muted in recent weeks, with the stock building modest upside momentum off the $175 region before settling into a consolidation zone around $180. Price currently sits just below both the 20- and 50-day moving averages, reflecting a temporary loss of short-term trend strength. The $185 level remains an important region of interest, acting as overhead resistance and a prior breakout zone that NVDA has interacted with several times in recent months. Notably, the stock has not revisited its 200-day moving average, currently near $154, since breaking above it back in May, underscoring the durability of the broader uptrend. A sustained move back above the 50-day moving average would likely open the door for a retest of the $200 level and potential continuation higher. While the chart shows consolidation rather than decisive strength, the trade setup leans more heavily on fundamentals and the momentum stemming from the company’s recent earnings and guidance.
Fundamental Analysis
NVIDIA’s latest quarterly results reinforced its position as the clear leader in accelerated compute, supported by standout performance in data center and continued margin expansion. Despite sector volatility, NVDA’s growth trajectory remains well ahead of peers, and profitability continues to track at best-in-class levels. The company’s ability to convert demand into sustained revenue and earnings acceleration supports the case for continued multiple expansion relative to the industry.
- Forward PE Ratio: 23.25x vs. Industry Median 26.41x
- Expected EPS Growth: 48.89% vs. Industry Median 18.61%
- Expected Revenue Growth: 47.00% vs. Industry Median 10.60%
- Net Margins: 53.01% vs. Industry Median 14.16%
Options Trade
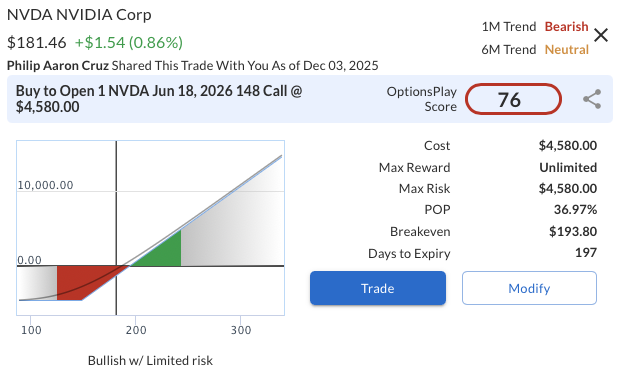
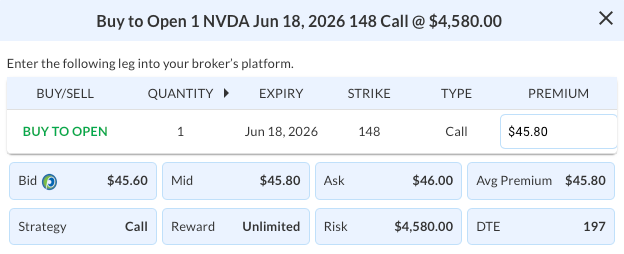
To express a fundamentally driven long-term bullish view, the preferred strategy is to Buy to Open the NVDA June 18, 2026 $148 Call at $45.80, requiring a total premium outlay of $4,580 per contract. This deep-in-the-money LEAPS call provides high delta exposure with defined risk, allowing participation in long-term appreciation without the capital commitment of owning shares outright. With nearly 200 days to expiration, the position provides ample time for the fundamental thesis—anchored in NVDA’s strong earnings, guidance, and AI leadership—to play out. Risk is limited strictly to the premium paid, while upside remains unlimited, creating an attractive asymmetry for a fundamentally driven long-term setup.
NVDA – Daily
Trade Details
Strategy: Long Call
Direction: Bullish Call
Details: Buy to Open 1 NVDA Jun 18 $148 Call @ $45.80 Debit per Contract.
Total Risk: This trade has a max risk of $4,580 (1 Contract x $4,580) roughly 25% of buying 100 shares of NVDA. We suggest using this longer dated call option as a more capital efficient way to capture upside using options.
Trend Continuation Signal: This is a bullish trade on a stock that is expected to continue higher over the duration of this trade.
1M/6M Trends: Bearish/Neutral
Relative Strength: 8/10
OptionsPlay Score: 76
Stop Loss: If NVDA is below $148 (strike price) close the trade.
View NVDA Trade
Entering the Trade
Use the following details to enter the trade on your trading platform. Please note that whenever there is a multi-leg option strategy, it should be entered as a single trade.
PLEASE NOTE that these prices are based on Tuesday’s closing prices. Should the underlying move significantly during the pre-market hours, we will likely adjust the strikes and prices to reflect a more accurate trade entry.
View NVDA Trade
META
DailyPlay – Adjusting Trade (META) – December 02, 2025
META Bullish Trade Adjustment Signal
Investment Rationale
Adjustment Rationale:
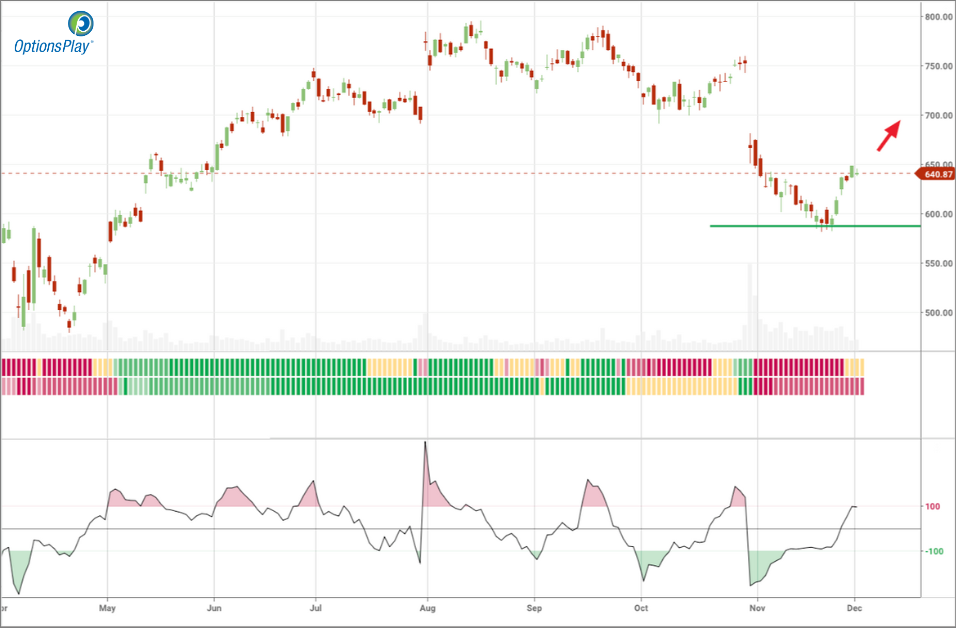
We continue to hold a positive outlook on Meta Platforms, Inc. (META), and while we remain bullish, we are cautious in the short term. The recent pullback in the hyperscalers, including META, created a favorable setup for a longer-term bullish approach, so we opened the position by purchasing a deep-in-the-money June 18th expiration call option. We currently have a gain in the position and intend to remain bullish longer term, but the OptionsPlay platform generated a Bearish Trend Following Alert, indicating META has rallied within a broader bearish trend. As a hedge for the long-term call position, we will sell a short-term call against the longer-dated call to help lower the cost basis.
Adjustment Trade:
META @ $640.87
Days to Expiration (DTE): 18
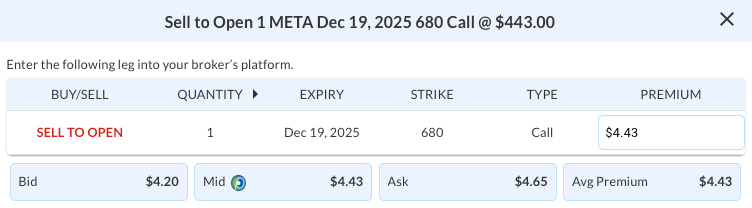
Sell to Open 1 META Dec 18, 2025 680 Call @ $4.43
Mid: $4.43
Premium Received: $443.00 per call option sold
or $443 total adjustment in the cost basis for the position.
The total risk for the new position is $13,620 (original cost basis) minus $443 (net credit), resulting in a revised cost basis of $13,177.
Resulting Position:
Long 1 META Jun 18, 2026 490 Call
Short 1 META Dec 19, 2025 680 Call
New cost basis and total risk: $13,177
META – Daily
Trade Details
Strategy Details
Strategy: Short Call
Direction: Resulting in a new Bullish Diagonal Spread
Details: Sell to Open 1 META Dec 19 $680 Call @ $4.43 Credit.
Total Risk: The resulting position has a maximum risk of $13,177 (13,620-443), calculated as the initial cost basis of the long call ($13,620) minus the premium received from the adjustment ($443).
Trend Continuation Signal: This is a bullish trade on a stock that is expected to continue higher over the duration of the trade.
1M/6M Trends: Neutral/Bearish
Relative Strength: 3/10
Stop Loss: @ $65.89 (50% loss of premium)
Entering the Trade
Use the following details to enter the trade on your trading platform. Please note that whenever there is a multi-leg option strategy, it should be entered as a single trade.
PLEASE NOTE that these prices are based on Monday’s closing prices. Should the underlying move significantly during the pre-market hours, we will likely adjust the strikes and prices to reflect a more accurate trade entry.
DailyPlay – Portfolio Review – December 01, 2025
DailyPlay Portfolio Review
Our Trades
FDX – 32 DTE
Bullish Credit Spread – FedEx Corp (FDX) – We recently established this position, currently have a gain, and plan to stay the course for now.
META – 199 DTE
Bullish Long Call – Meta Platforms, Inc. (META) – The short-lived market dip and META’s pullback have created a favorable setup for a longer-term bullish approach. We currently have a gain in the position and intend to maintain it for now, and will look for an opportunity to sell a short-term call against the longer-dated call to lower the cost basis of the long call.
PM – 18 DTE
Bearish Credit Spread – Philip Morris (PM) – The stock remains in a consolidation phase. With expiration approaching and the position currently at a loss, we will likely close the trade unless a bearish trend emerges early next week.
NVDA
DailyPlay – Closing Trade (NVDA) – November 26, 2025
Closing Trade
- NVDA – 89% loss: Buy to Close 3 Contracts (or 100% of your Contracts) Dec 12 $190/$180 Put Vertical Spreads @ $7.18 Debit. DailyPlay Portfolio: By Closing 3 Contracts, we will be paying $2,154. We initially opened these 3 contracts on November 12 @ $3.79 Credit. Our loss, therefore, is $339 per contract.
FDX
DailyPlay – Opening Trade (FDX) & Closing Trade (LMT) – November 25, 2025
Closing Trade
- LMT – 110% loss: Buy to Close 2 Contracts (or 100% of your Contracts) Dec 05 $485/$470 Put Vertical Spreads @ $14.10 Debit. DailyPlay Portfolio: By Closing 2 Contracts, we will be paying $2,820. We initially opened these 2 contracts on October 28 @ $6.70 Credit. Our loss, therefore, is $740 per contract.
FDX Bullish Opening Trade Signal
Investment Rationale
Investment Thesis
FedEx (FDX) continues to demonstrate improving momentum supported by stabilizing demand trends and favorable sector dynamics. With shares breaking out and sentiment strengthening, the stock appears positioned for continued appreciation into 2025. The combination of modest valuation, steady forward growth expectations, and firm price action supports a bullish directional view with a preference for strategies that take advantage of elevated premium levels and defined risk.
Technical Analysis
After FDX broke above the key $250 resistance area at the beginning of November, the stock has built strong upside momentum. The 50-day moving average has crossed above the 200-day (a golden cross), and the stock is now trading above the 20-, 50-, and 200-day moving averages, signaling a healthy uptrend with broad participation.
Fundamental Analysis
FDX trades at a discount to peers despite maintaining growth and profitability metrics that largely align with industry norms. While margins remain below peak levels, the company has made visible progress in cost efficiency, creating a path for improved operating performance if volume trends continue to recover. This valuation gap offers potential for multiple expansion should execution stay on track.
- Forward PE Ratio: 14.90x vs. Industry Median 18.87x
- Expected EPS Growth: 9.27% vs. Industry Median 10.85%
- Expected Revenue Growth: 4.02% vs. Industry Median 4.05%
- Net Margins: 4.65% vs. Industry Median 5.20%
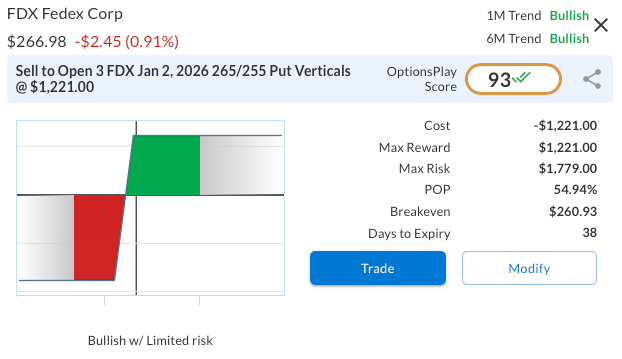
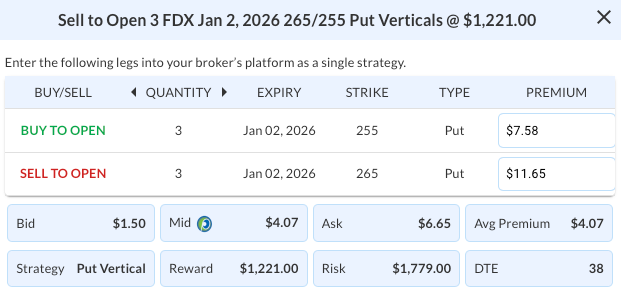
Options Trade
To express a bullish view with defined risk, consider selling the Jan 2, 2026 265/255 put vertical for a credit of approximately $4.07. This spread brings in $4.07 in premium against a maximum potential loss of $5.93, resulting in a solid risk-reward ratio of roughly 1.46:1 for a neutral-to-bullish trade. The position benefits from FDX remaining above $265 at expiration, with exposure limited and defined.
FDX – Daily
Trade Details
Strategy Details
Strategy: Short Put Vertical Spread
Direction: Bullish Credit Spread
Details: Sell to Open 3 FDX Jan 02 $265/$255 Put Vertical Spreads @ $4.07 Credit per Contract.
Total Risk: This trade has a max risk of $1,779 (3 Contracts x $593) based on a hypothetical $100k portfolio risking 2%. We suggest risking only 2% of the value of your portfolio and divide it by $593 to select the # contracts for your portfolio.
Trend Continuation Signal: This is a bullish trade on a stock that is expected to continue higher over the duration of this trade.
1M/6M Trends: Bullish/Bullish
Relative Strength: 9/10
OptionsPlay Score: 93
Stop Loss: @ $8.14 (100% loss to value of premium)
View FDX Trade
Entering the Trade
Use the following details to enter the trade on your trading platform. Please note that whenever there is a multi-leg option strategy, it should be entered as a single trade.
PLEASE NOTE that these prices are based on Monday’s closing prices. Should the underlying move significantly during the pre-market hours, we will likely adjust the strikes and prices to reflect a more accurate trade entry.