
$USO, $BSX, $ARCH, $EBAY

DailyPlay – Partial Closing Trades (BSX, ARCH, EBAY, USO) – April 11, 2023
Partial Closing Trades
- BSX – 65.54% Gain: Sell to Close 2 Contracts (or 50% of your remaining Contracts) April 21st $48 Calls @ $2.45 Credit. DailyPlay Portfolio: By Closing 2 of the remaining 4 Contracts, we will receive $490.
- ARCH – 61.26% Loss: Buy to Close 3 Contracts (or 50% of your Contracts) April 21st $135/$130 Put Vertical Spreads @ $3.15 Debit. DailyPlay Portfolio: By Closing 3 of the 6 Contracts, we will pay $945.
- EBAY – 26.04% Loss: Sell to Close 2 Contracts (or 40% of your remaining Contracts) April 21st Call Vertical Spreads @ $1.42 Credit. DailyPlay Portfolio: By Closing 2 of the remaining 5 Contracts, we will receive $284.
- USO – 26.84% Gain: Sell to Close 1 Contract (or 1/3% of your remaining Contracts) Jul 21, 2023 $71/$77 Call Verticals @ $2.41 Credit. DailyPlay Portfolio: By Closing 1 of the remaining 3 Contracts, we will receive $241.
Investment Rationale
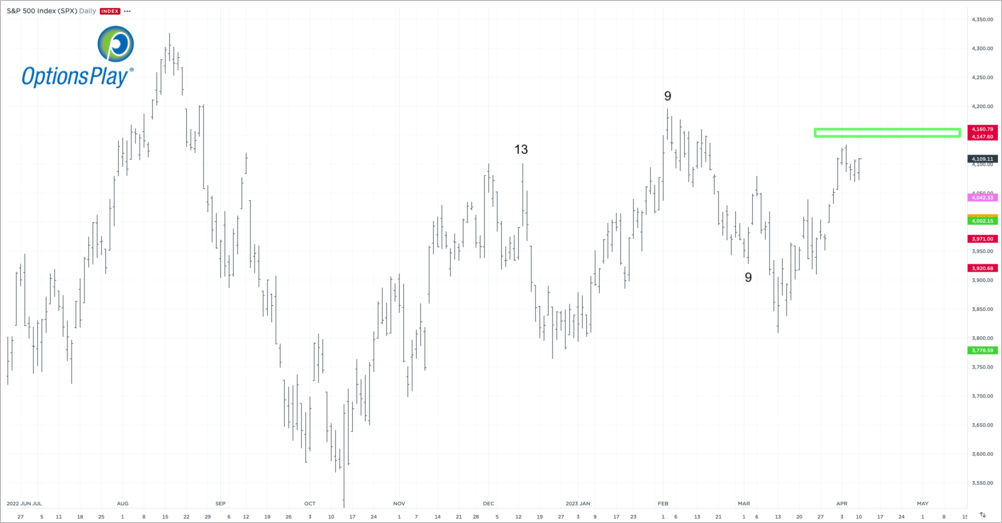
Stocks opened lower yesterday on lower-than-expected Apple Mac sales figures, but the SPX bottomed by 10am and then trended higher the rest of the day, running into positive territory just minutes before the close. (That late surge might be the result of the influence of 0DTE options.) Nothing has changed from Monday’s action though: the market is still in a trading range, but I’m sensing a nearing change to that ennui coming sooner rather than later.
SPX – Daily
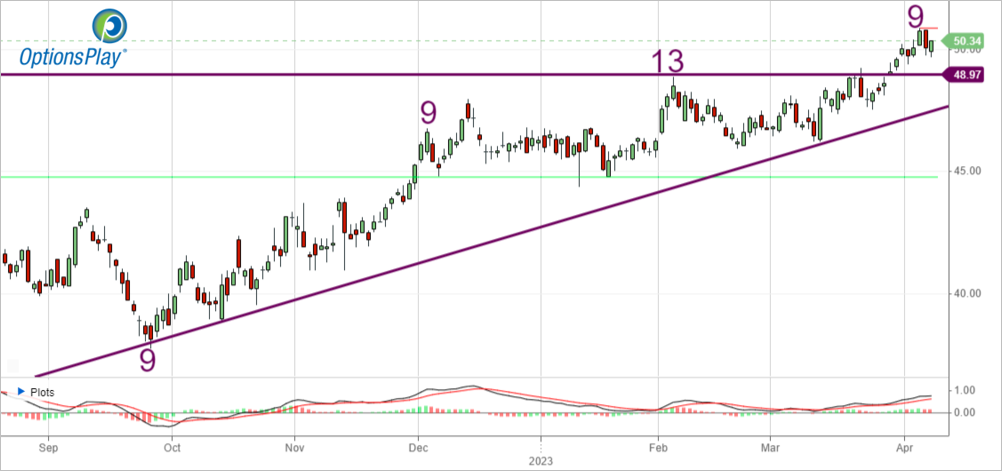
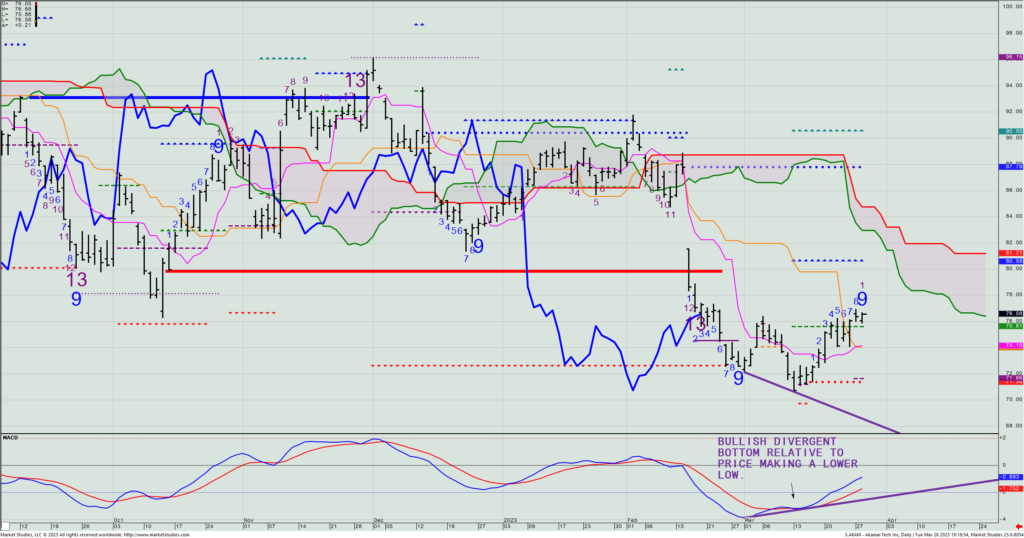
BSX posted a daily Setup +9 count yesterday, its first one in 5 months. We’re still long four $48 calls, up 65% on them. Let’s take 2 of 4 off today, and also raise your sell-stop on the last 2 to exit them if the option price falls to $2. (It’s possible this all happens today.)
BSX – Daily
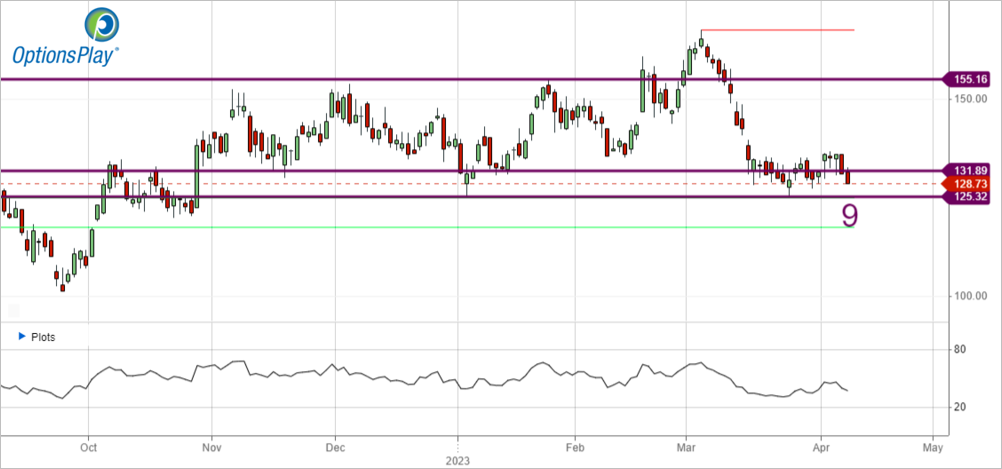
ARCH has fallen beneath our lower strike price in our short put spread. As such, let’s exit 3 of 6 short $135/$130 put spreads we have on.
ARCH – Daily
We’re long 5 EBAY $42.5/$47.5 call spreads from $1.92. We’re down 26% on them even though the stock is higher than when we got in. (That’s classic theta decay, as we only have 10 DTE. Let’s exit 2 of them today to reduce the loss.
EBAY – Daily
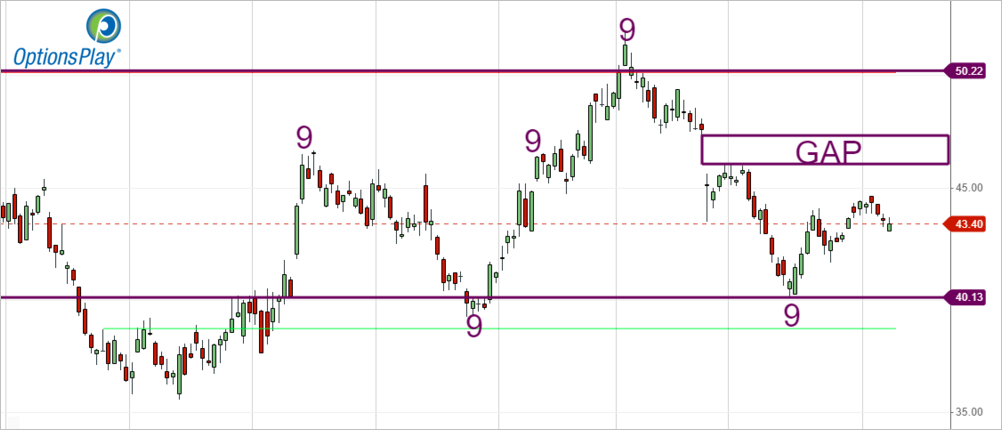
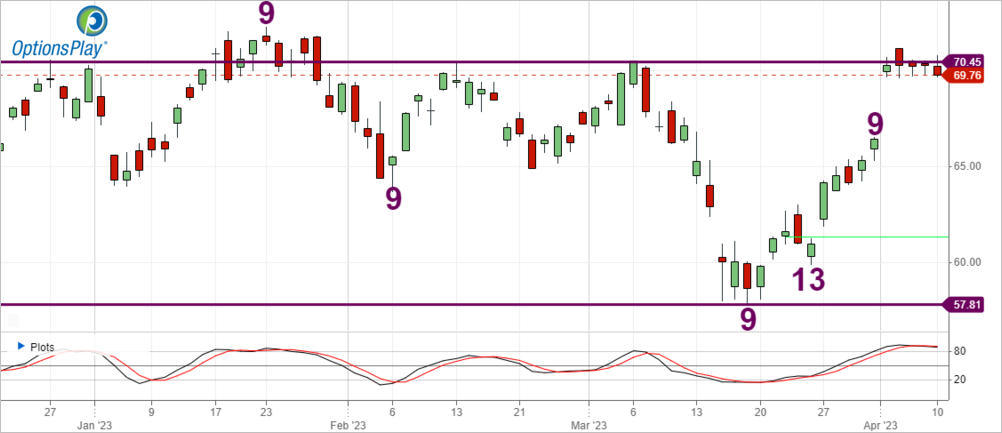
We’re still long 3 USO call spreads that were part of a larger long iron condor trade we previously had on (and then removed the long put spread portion). We’re up 27% on this, and with the stock having stopped 5 days in a row at the 200-DMA and the TDST line, let’s take off one of these today.
USO – Daily
$MCK

DailyPlay – Opening Trade (MCK) – April 10, 2023
MCK Bearish Opening Trade Signal
View MCK Trade
Strategy Details
Strategy: Short Call Vertical Spread
Direction: Bearish
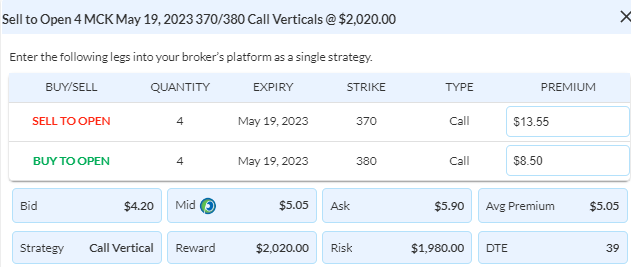
Details: Sell to Open 4 Contracts May 19th $370/$380 Call Vertical Spreads @ $5.05 Credit per contract.
Total Risk: This trade has a max risk of $1,980 (4 Contracts x $495) based on a hypothetical $100,000 portfolio risking 2%. We suggest using 2% of your portfolio value and divide it by $495 to select the # contracts for your portfolio.
Counter Trend Signal: This stock has rallied to a level of resistance and is expected to pull back lower.
1M/6M Trends: Bullish/Bullish
Technical Score: 8/10
OptionsPlay Score: 115
Entering the Trade
Use the following details to enter the trade on your trading platform. Please note that whenever there is a multi-leg option strategy, it should be entered as a single trade.
Please note that these prices are based on Friday’s closing prices. Should the underlying move significantly during the pre-market hours, we will likely adjust the strikes and prices to reflect a more accurate trade entry.
Investment Rationale
The weekly “doji” candles (i.e., weekly open and close virtually the same) last week in the SPY and QQQ both came up against resistance, and could be foretelling if this week opens near its high and closes near its low (on a decent down week), as that would create an “evening star” pattern that is not only usually bearish, but could easily become the last high of the 6-month rally and start a downmove to test last year’s lows. On the flip side, a close this week above SPX 4155 would be bullish, if we see follow-through next week. Put these two opposite scenarios together, and I think we are shortly to see a decent directional move that changes the landscape we’ve seen so far in 2023.
If I am right, one way to play this idea is by buying volatility in the SPY or QQQ. Both are relatively inexpensive relative to what we’ve seen this year. Potential plays can be going long straddles, strangles, or even iron condors.
When it comes to looking at the option board on the VIX itself, look at the massive skew that ATM calls have relative to ATM puts (going out 37 days). The price differential is significant.
Let’s look at the stock chart of McKesson Corp. (MCK). Price has surged recently from a daily -13 bottom to now having reached a Setup +9 potential near-term top.
MCK – Daily
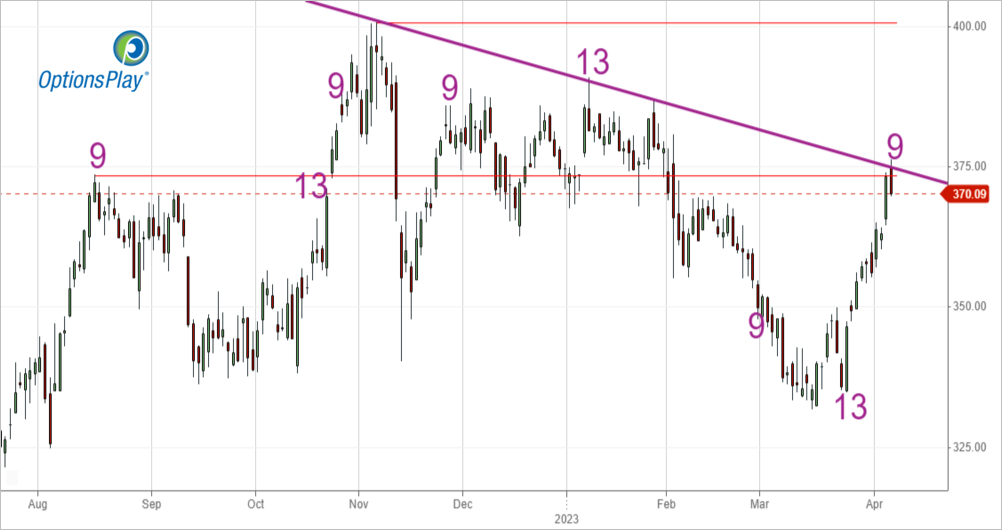
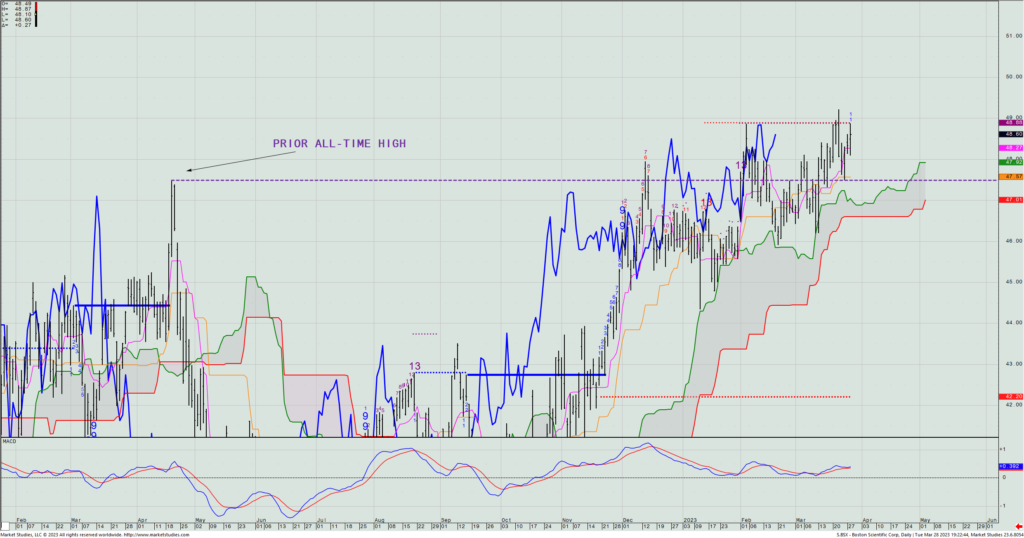
With calls priced quite high, let’s look to sell a May 19th $370/$380 call spread. It closed at $5.05 mid on Friday, representing almost 51% of the $10 strike differential. Earnings come out on May 8th, so we will be out by then. But frankly, collecting 50% into resistance from both the early-Feb. breakdown area and the downtrend from all-time highs seems like a bet worth taking.
$BSX
DailyPlay – Partial Closing Trade (BSX) – April 6
Partial Closing Trade
- BSX – 91.22% Gain: Sell to Close 4 Contracts (or 50% of your remaining Contracts) April 21st $48 Calls @ $2.83 Credit. DailyPlay Portfolio: By Closing 4 of the 8 Contracts, we will receive $1,200.
Investment Rationale
Stocks saw losses yesterday as we are seeing upped concerns regarding a slowing of the economy and increased wages that we see another quarter-point rate hike at the Fed’s next meeting in May. A quick look at the SPX’s daily chart shows the general struggle to maintain rallies above the 4100 area.
SPX – Daily
As we head into the holiday-shortened last trading session of the week, S&P futures are pretty flat, and today will likely be a relatively quiet session. Many trading desks will be lighter-staffed today, and I’d not expect any real fireworks to occur. Tomorrow is the big labor report, and we’ll be able to see how the futures react to the employment number, but you won’t be able to trade your option positions on it till Monday. Think about that if there’s anything you want to do today because of that.
Our long BSX $48 call is now up 91%. Let’s remove 4 of 8 today to lock that nice gain in.
BSX – Daily
That’s it for this week. Enjoy the long holiday weekend with family and friends.
$FSLR
DailyPlay – Opening Trade (FSLR) Closing Trade (TLT) Partial Closing Trade (ADM) – April 5, 2022
Closing Trade
- TLT – 10.16% Loss: Sell to Close 1 Contract (or 100% of your remaining Contracts) April 6th $104.50/$114 Call Vertical Spreads @ $2.74 Credit. DailyPlay Portfolio: By Closing the remaining Contract, we will receive $274. We partially closed this trade on March 28 @ $1.20 Credit when we closed 2 contracts, then on March 31 @ $0.89 Credit when we closed another 2 contracts, on April 4 @ $2.28 when we closed 1 contract. Our average cost basis for exiting this trade is therefore $1.53 Credit and our average loss on this trade is 49.7%.
Partial Closing Trade
- ADM – 57.89% Gain: Buy to Close 2 Contracts (or 25% of your remaining Contracts) April 21st $77.50/$75 Put Vertical Spreads @ $0.40 Debit. DailyPlay Portfolio: By Closing 2 of the 8 Contracts, we will be paying $80.
FSLR Bearish Opening Trade Signal
View FSLR Trade
Strategy Details
Strategy: Short Call Vertical Spread
Direction: Bearish
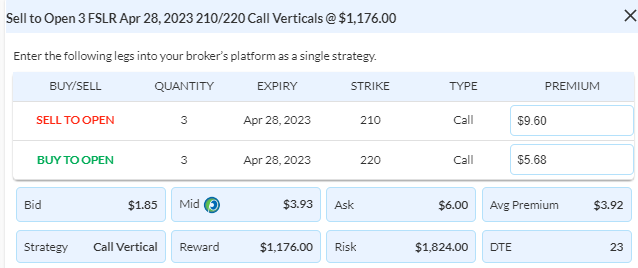
Details: Sell to Open 3 Contracts April 28th $210/$220 Call Vertical Spreads @ $3.93 Credit per contract.
Total Risk: This trade has a max risk of $1,824 (3 Contracts x $608) based on a hypothetical $100,000 portfolio risking 2%. We suggest using 2% of your portfolio value and divide it by $608 to select the # contracts for your portfolio.
Counter Trend Signal: This stock has rallied to a level of resistance and is expected to pull back lower.
1M/6M Trends: Neutral/Bullish
Technical Score: 10/10
OptionsPlay Score: 101
Entering the Trade
Use the following details to enter the trade on your trading platform. Please note that whenever there is a multi-leg option strategy, it should be entered as a single trade.
Please note that these prices are based on Tuesday’s closing prices. Should the underlying move significantly during the pre-market hours, we will likely adjust the strikes and prices to reflect a more accurate trade entry.
Investment Rationale
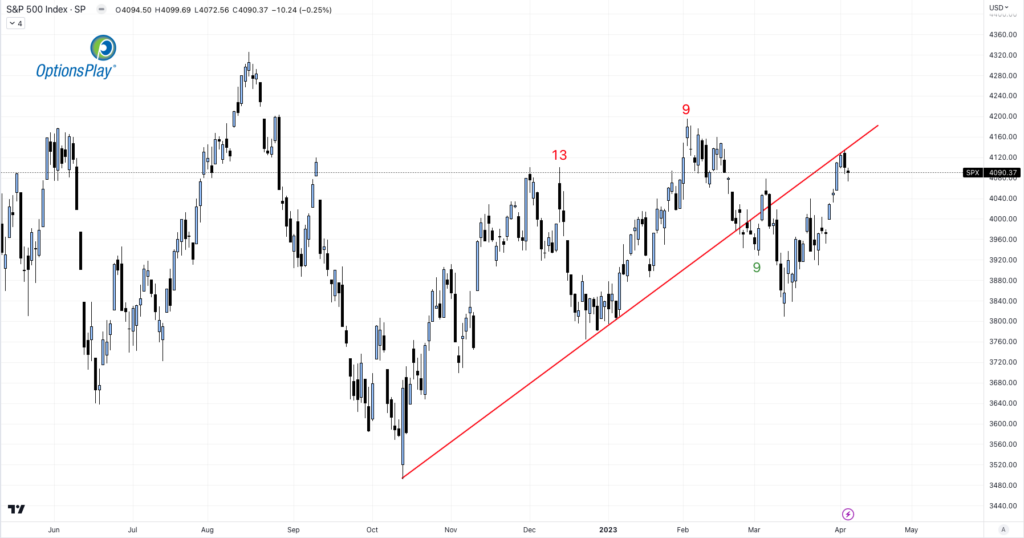
“Clear sailing ahead” can get muddied quickly, and yesterday was a perfect example of just that. The SPX peaked 30 minutes into the session, and it was straight down till just after 12pm ET, when they traded in a range for the balance of the day. The SPX lost 58 bps.; the NDX dropped 37 bps.; the Dow 59 bps; and the Russell a far more significant 175 bps. (Renewed fears of recession hit the little stocks the most.)
As the SPX had been nearing the important resistance zone from ~4150 to 4215, I had lightened up a bunch of exposure yesterday morning, just knowing that this key index was getting close to the top end of its 2023 trading range. And as I said in my free weekly In The Know Trader video I posted yesterday on YouTube (https://www.youtube.com/watch?v=TQH-DmZH54U), “Do What Works Until it Doesn’t”. In this case, lighten exposure on rallies to the top end of the trading range; add exposure at the bottom end. This is precisely what we have done this year, and this is in complete contrast to what has been so many other strategists’ theme in ‘23 of the bulls buying strength and the bears selling weakness.
Before I get to adjusting our positions, let me remind you that I make it a standard personal rule to not let winning trades turn into losers. That doesn’t mean that if an option position is quickly up 5%-10% I might not let it still play out, even if it then goes against me. But if I’m up 25% to 50% on a position, and then the profit goes away, so do I (i.e., I close the position). That means, you need be on your toes for our long IWM trade (entry was $173.85 and the stock closed yesterday only $1.50 higher); and our AKAM trade is now up 15%, so keep an eye on that, too. We’ll be getting out of either/both if our profit erodes down to breakeven.
Next, let’s talk about our long TLT trade that goes off the board on Thursday. We paid $3.05 for a long $104.5/$114 call spread. The ETF is trading at $107.13 as of yesterday’s close, and we’re still down on the trade because too much time past before Mr. TLT got the wax out of his ear to listen to me egging him on to trade higher. He finally got the message, but too little, too late. We have only one spread left, so just make sure you are out of it by Thursday’s close.
Next up: ADM. We’re got on a nice short put trade to the tune of a 58% profit on the remaining 8 spreads. We’ll take two more off today, and on any day that our P&L drops to less than a 50% gain going into the close, we’ll exit another 2 more.
With today being the next to last trading day of the week before a 3-day weekend, you can bet that I won’t be putting on any new long option trades now – whether they be puts or calls. Too much can happen over a long holiday weekend, and why buy something now that loses three days of theta so soon? But here’s a spread I’m willing to sell: the First Solar (FSLR) April 28th $210/$220 call spread. Yesterday it went out at $3.925, or 39% of the spread differential.
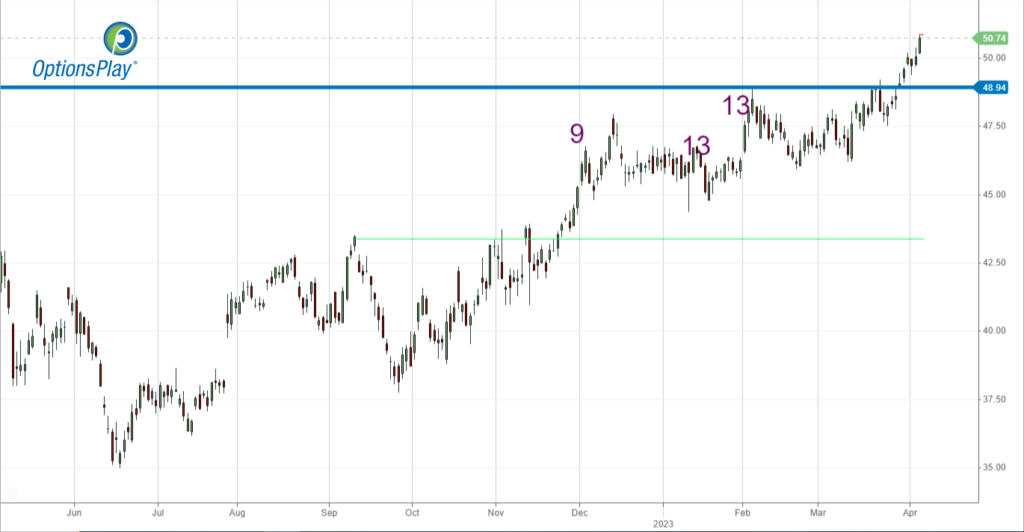
FSLR – Weekly
Notice that the close of the massive rally week in February was at $210.11. Not only is price underneath that now, but it only once progressed past that Friday close since then (i.e., last week), and 3 of the 4 prior weekly highs are all between $215 and $220. The longer this doesn’t trade higher, the more it shows some real institutional selling, and the odds increase for a pullback down to the target area I’ve highlighted in the yellow rectangle. Earnings come out one day before the April 28th expiration, so we will be out of this before that report comes out late this month.
$ARCH

DailyPlay – Opening Trade (ARCH) Partial Closing Trades (TLT, ADM, EBAY, BROS) – April 4, 2023
Partial Closing Trades
- TLT – 25.25% Loss: Sell to Close 1 Contract (or 50% of your remaining Contracts) April 6th $104.50/$114 Call Vertical Spreads @ $2.28 Credit. DailyPlay Portfolio: By Closing 1 of the remaining 2 Contracts, we will receive $228.
- ADM – 68.42% Gain: Buy to Close 2 Contracts (or 20% of your remaining Contracts) April 21st $77.50/$75 Put Vertical Spreads @ $0.30 Debit. DailyPlay Portfolio: By Closing 2 of the 10 Contracts, we will be paying $60.
- EBAY – 14.06% Gain: Sell to Close 1 Contract (or 15% of your Contracts) April 21st Call Vertical Spreads @ $2.14 Credit. DailyPlay Portfolio: By Closing 1 of the 6 Contracts, we will receive $214.
- BROS – 38.46% Gain: Buy to Close 4 Contracts (or 25% of your Contracts) April 28th $30/$28 Put Vertical Spreads @ $0.48 Debit. DailyPlay Portfolio: By Closing 4 of the 16 Contracts, we will receive $192.
ARCH Bullish Opening Trade Signal
View ARCH Trade
Strategy Details
Strategy: Short Put Vertical Spread
Direction: Bullish
Details: Sell to Open 6 Contracts April 21st $135/$130 Put Vertical Spreads @ $1.75 Credit per contract.
Total Risk: This trade has a max risk of $1,950 (6 Contracts x $325) based on a hypothetical $100,000 portfolio risking 2%. We suggest using 2% of your portfolio value and divide it by $325 to select the # contracts for your portfolio.
Counter Trend Signal: This stock has been trading lower but is expected to respect support at this level.
1M/6M Trends: Bearish/Mildly Bearish
Technical Score: 6/10
OptionsPlay Score: 88
Entering the Trade
Use the following details to enter the trade on your trading platform. Please note that whenever there is a multi-leg option strategy, it should be entered as a single trade.
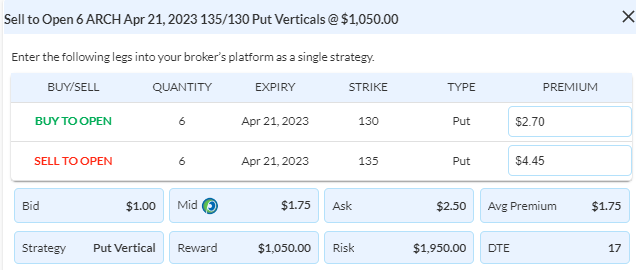
Please note that these prices are based on Monday’s closing prices. Should the underlying move significantly during the pre-market hours, we will likely adjust the strikes and prices to reflect a more accurate trade entry.
Investment Rationale
Stocks generally moved higher on Monday – though not the NDX. The SPX marked its highest close since mid- February as buyers are still in near-term control. In yesterday morning’s webinar, I mentioned that the important SPX resistance is ~4148 to 4215. With yesterday marking a Setup +6 count, we may see a move up into that zone the balance of this week, possibly culminating in a Setup +9 count on Thursday. (Don’t forget that the market is closed on Friday for Good Friday.)
SPX – Daily
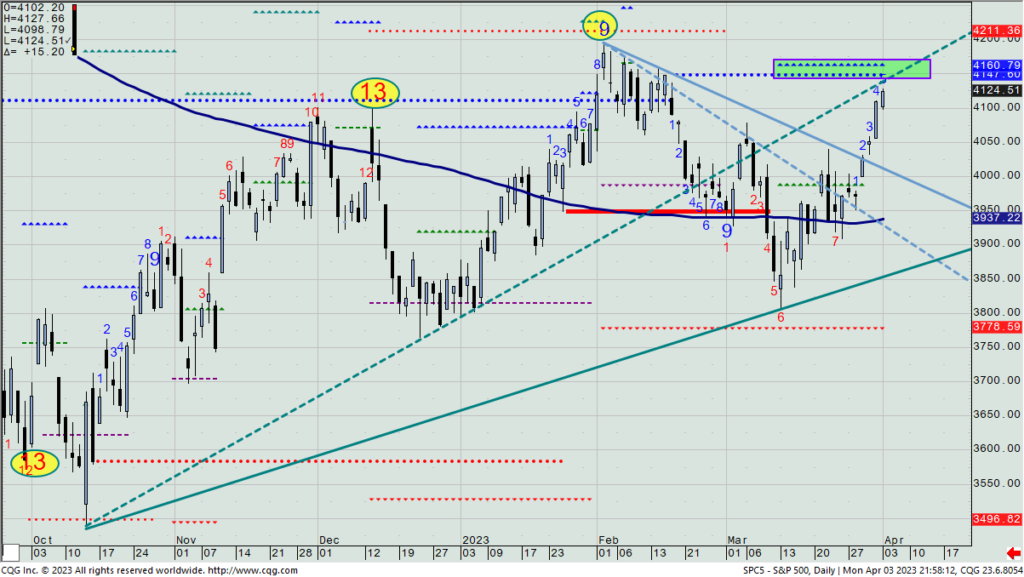
I have built a predominantly long portfolio for us in anticipation of the current upmove that started from the failure to break the weekly bearish Propulsion Momentum level at 3864. As we start getting to the above-mentioned top of trading range resistance zone, we will be trimming most of those longs. We’ll start with the following today:
- TLT: Exit 1 of 2 long call spreads today. We’re down 25% and this expires on Thursday. Theta is hurting us. (The long TLT idea was right; the timing of entry was not.)
- ADM: Exit 2 of 10 short put spreads today. We’re up 68%.
- EBAY: Exit 1 of 6 long call spreads today. We’re up 14%.
- BROS: Exit 4 of 16 short put spreads. We’re up 38%.
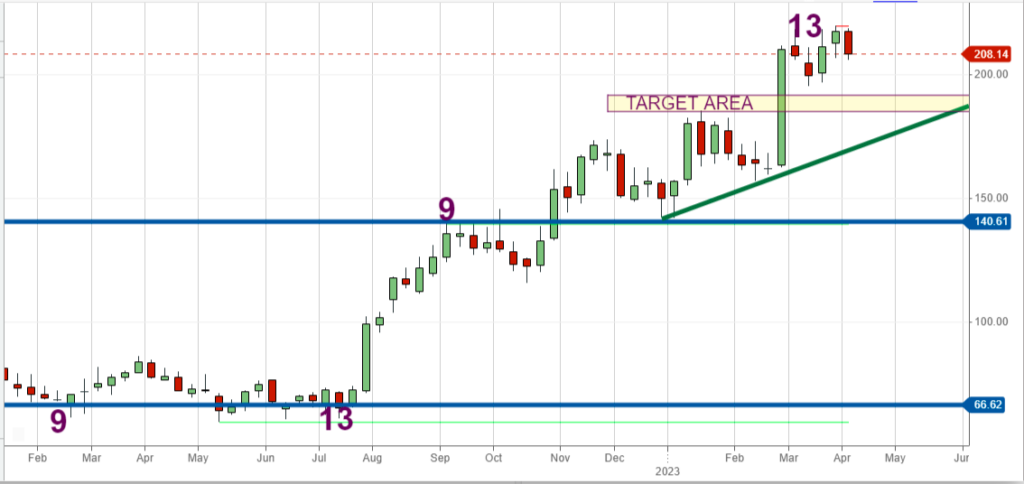
Here’s a new idea to put on today (or any day this week that ARCH trades near $135. (It closed yesterday at $136.11.) To me, this chart looks like it’s done the work that it needed to at the bottom end of the range, and it continues to find support there. With earnings on April 25th, we’d have to use the April 21 expiration. The $135/$130 put spread went out at $1.75 yesterday – about 35% of the strike differential. Though I usually like to capture some 40% or more of the diff, this is a short-term play that the stock won’t likely trade much lower before earnings – giving us the chance to capture the bulk of the premium (and the theta component should largely come into play starting mid- to late- next week).
ARCH – Daily

$USO
DailyPlay – Partial Closing Trade (USO) – April 3, 2023
Investment Rationale
The quarter finished strong, and the SPX is within striking distance of the 2023 highs, less than 100 pts. away. Tech, which was the biggest sector gainer this year, is, in my opinion, due to not materially increase in relative performance in the near-future, most likely resting now after outperforming in Q1 by over 13.5%.
There was a news headline over the weekend, with OPEC cutting production more than expected. Crude oil quickly traded up over $6 last night, and I think this is the catalyst that will cement the recent low in oil near $65. That mid-March decline did NOT see open interest fall on (meaning longs were not forced out and that shorts did not cover), and what it does mean to me is that I want to remove the long put spread in our long USO condor spread, leaving us with just the long $71/$77 call spread. I think that shorts are going to get squeezed out, and given that the US government didn’t actually buy more oil under $70 (as they indicated they would) to replenish the Strategic Petroleum Reserve – they too will feel the pain of not having purchased when the opportunity came.
I’ve just looked at 9 different trade ideas in the past hour that I am willing to do based upon chart signals. Not a single one of them has a call debit spread priced at less than 38% of the strike differential, nor a put credit spread priced at more than 30% of the strike diff. It makes it virtually impossible to recommend a trade with options priced as they are right now. I know enough not to push things when there’s no edge to putting these trades on. As such, I am not going to give you a new trade idea today. (That’s me watching out for you.)
$QQQ, $TLT
DailyPlay – Closing Trade (QQQ) Partial Closing Trade (TLT) – March 31, 2023
Closing Trade
- QQQ – 64% Loss: Buy to Close 8 Contracts (or 100% of your Contracts) April 14th $309/$315 Call Vertical Spreads @ $4.10 Debit. DailyPlay Portfolio: By Closing all 8 Contracts, we will be paying $3,280.
Partial Closing Trade
- TLT – 70.82% Loss: Sell to Close 2 Contracts (or 50% of your remaining Contracts) April 6th $104.50/$114 Call Vertical Spreads @ $0.89 Credit. DailyPlay Portfolio: By Closing 2 of the remaining 4 Contracts, we will receive $178.
Investment Rationale
Stocks head into today’s end of week/month/quarter session with bulls controlling recent action, as banking crisis fears have dramatically decreased, and the bounce from the lower end of the 2023 trading range keeps bidders using minor weakness to buy more stock – whether new purchases or the covering of short positions. In fact, yesterday’s price action clinched a new bullish Propulsion Momentum signal for the SPX, with it targeting an upmove to the 4150 area – which unrelatedly happens to be the top of the trading range, anyway. I look for today and Monday to have some upped volatility – not only from today’s weekly option expiration, but also from new monthly and quarterly re-allocations.
Late yesterday the QQQ was trading north of the $315.25 level – with my previously having stated that a close above that price was our exit signal to our bearish QQQ short call spread. We are out and lost 64%.
I also want to lighten our long TLT trade, as we only have until a week from today for this long call spread to work. Take off 2 of the remaining 4 spreads today.
I have just spent some 90 minutes looking for a new idea for today, and I don’t find anything that I want to do that also has the options priced fairly. As such, I won’t add a position today, and we’ll see how things pan out over the weekend for new ideas come Monday.
$ADM
DailyPlay – Partial Closing Trade (ADM) – March 30, 2023
Partial Closing Trade
- ADM – 38.95% Gain: Buy to Close 4 Contracts (or 30% of your Contracts) April 21st $77.50/$75 Put Vertical Spreads @ $0.58 Debit. DailyPlay Portfolio: By Closing 4 of the 14 Contracts, we will be paying $232.
Investment Rationale
Stocks rose along with the Regional Bank Index (KBE) rising 0.6%, giving investors a sense that the worst is over from the potentially short-lived banking crisis earlier this month. The SPX gained 1.4%, while the NDX added 1.9% and the Russell 2000 tagged on 1.1%. All 11 sectors were higher, led by REITs and Technology. Health Care was again the laggard, as it has been so often this year.
The SPX closed right on its downtrend line from the early Feb. high. A push through it should lead to additional follow-through buying, likely pushing the index back to right near that Feb. high. (Notice the two unrelated targets at 4148 and 4161 in the green rectangle.)
SPX – Daily
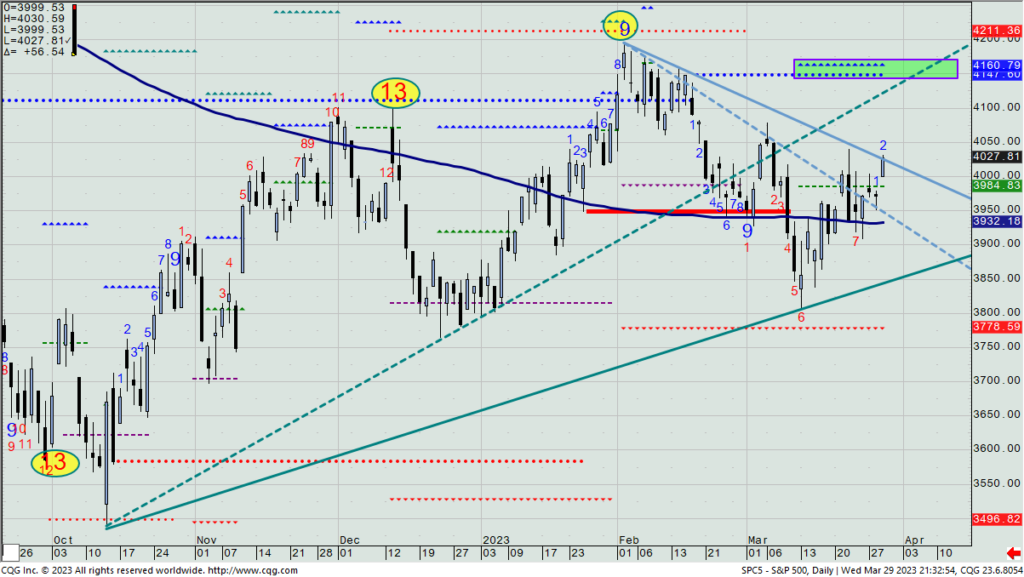
Moreover, with Tuesday having been a down close and yesterday and up one above the bullish Propulsion Momentum level (3985), a higher open/higher high/higher close today (vs. yesterday) confirms this signal with a 4161 target.
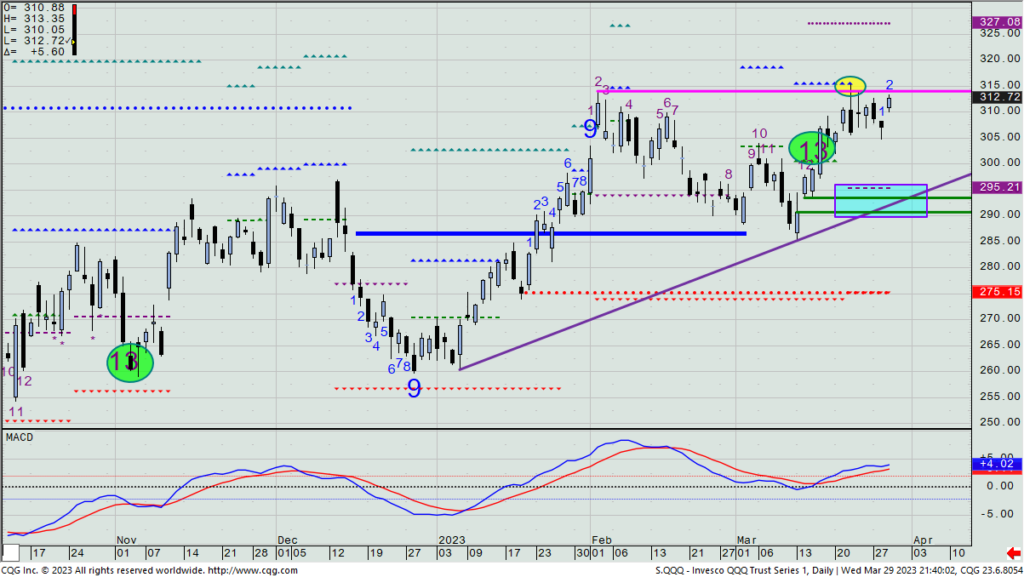
We are long IWM as a hedge vs. our bearish QQQ trade. I have previously stated that a QQQ close above $315.25 (today or any other day) will have us exit the short call spread we have on. So, watch for that to potentially occur any day now.
QQQ – Daily
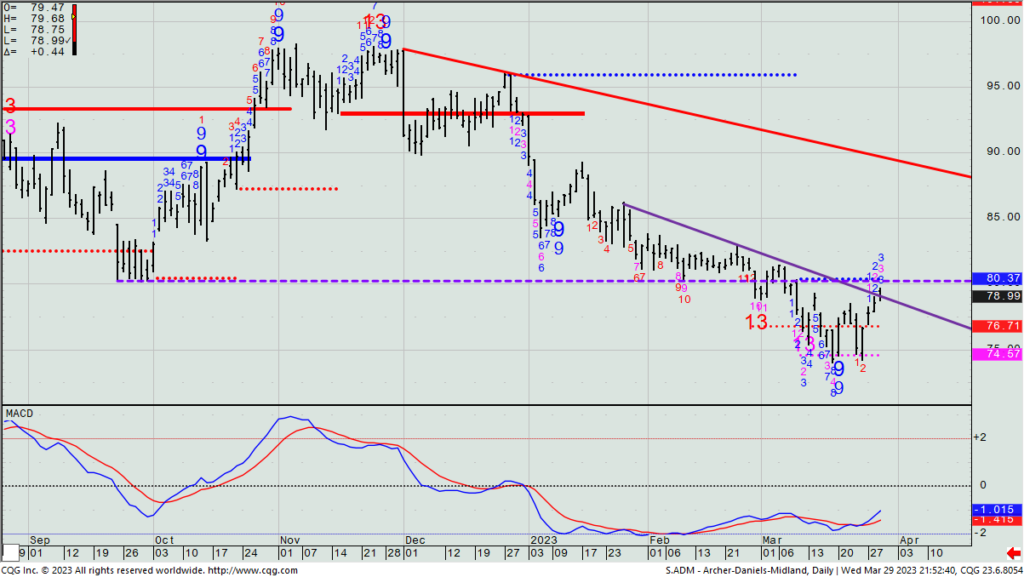
We’re short 14 ADM April 21st $77.5/$75 put spreads. Price is virtually on the minor downtrend line, but also close to getting a real upside breakout, too. As such, let’s just be smart and remove 4 of the 14 put spreads today to lock in the 39% profit we have on a portion of our position.
ADM – Daily
$BROS
DailyPlay – Opening Trade (BROS) Closing Trade (LYFT) Partial Closing Trades (AKAM, BSX) – March 29, 2023
Closing Trade
- LYFT – 19.40% Gain: Buy to Close 1 Contract (or 100% of your remaining Contracts) April 14th $9 Put @ $0.54 Debit. DailyPlay Portfolio: By Closing the remaining 1 Contract, we will be paying $54. We partially closed this trade on March 24 @ $0.30 Debit when we closed 50% of the contracts. Our average cost basis for exiting the trade is, therefore $42 and our average gain on this trade is 37.31%.
Partial Closing Trades
- AKAM – 1.47% Loss: Sell to Close 2 Contracts (or 50% of your Contracts) April 21st $75/$82.50 Call Vertical Spreads @ $2.68 Credit. DailyPlay Portfolio: By Closing 2 of the 4 Contracts, we will receive $536.
- BSX – 2.03% Loss: Sell to Close 4 Contracts (or 1/3 of your Contracts) April 21st $48 Calls @ $1.45 Credit. DailyPlay Portfolio: By Closing 4 of the 12 Contracts, we will receive $580.
BROS Bullish Opening Trade Signal
View BROS Trade
Strategy Details
Strategy: Short Put Vertical Spread
Direction: Bullish
Details: Sell to Open 16 Contracts April 28th $30/$28 Put Vertical Spreads @ $0.83 Credit per contract.
Total Risk: This trade has a max risk of $1,888 (16 Contracts x $118) based on a hypothetical $100,000 portfolio risking 2%. We suggest using 2% of your portfolio value and divide it by $118 to select the # contracts for your portfolio.
Counter Trend Signal: This stock has been trading lower but is expected to bounce higher off support at the bottom of its trading range.
1M/6M Trends: Bearish/Bearish
Technical Score: 3/10
OptionsPlay Score: 92
Entering the Trade
Use the following details to enter the trade on your trading platform. Please note that whenever there is a multi-leg option strategy, it should be entered as a single trade.
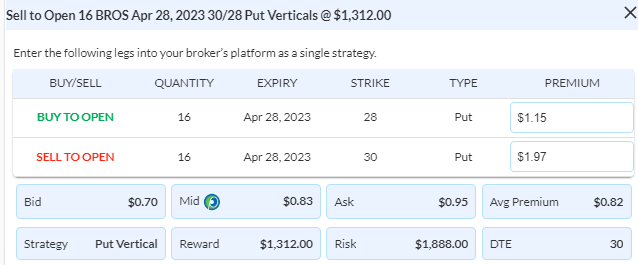
Please note that these prices are based on Tuesday’s closing prices. Should the underlying move significantly during the pre-market hours, we will likely adjust the strikes and prices to reflect a more accurate trade entry.
Investment Rationale
A small downward session for the SPX and Dow on Tuesday, though again, the tech laden NDX was off 3x what the SPX was. The confirmed bulls and bears are still boxing it out with each other, but there’s not yet a winner. I’ll continue to play the index trading ranges until I see something different occur.
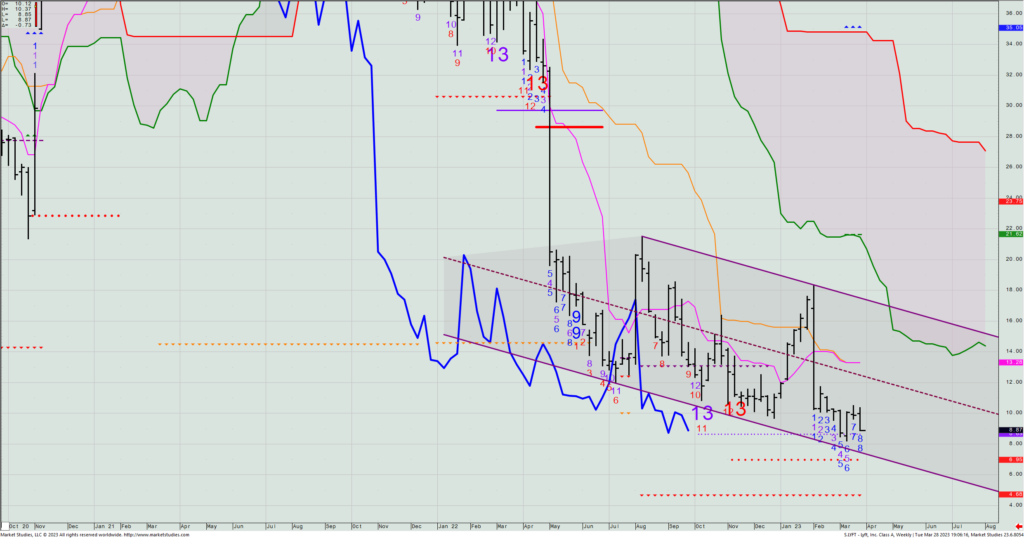
Portfolio-wise, I see that LYFT sold off sharply this week, and although we had already bought back one of two short $9 puts for a nice profit, let’s exit the other one (+19%) before it goes against us. (The stock closed at $8.87 yesterday.) I might very well get back into selling puts next week, potentially at a lower price and strike.
LYFT – Weekly
With our long AKAM April 21st $75/$82.5 call spread, we are basically even on the trade, with the stock up a bit from where we got in, but time having passed has cost us theta erosion. The stock has a daily Setup +9 count, but at the same time, a higher open today that also intraday takes out yesterday’s high and also closes up on the day produces a new bullish Propulsion Momentum signal – with a $80.55 target. Therefore, we will reduce our position down to only two call spreads IF A) the stock doesn’t open higher today, or B) if it does open higher but is down on the day going into the close. In either of those two cases, we will exit two call spreads today.
AKAM – Daily
We are also long 12 BSX April 21st $48 calls at a cost of $1.48. They are now worth $1.45 based upon last night’s closing mid price. Though we have 24 days to go, with yesterday again topping at the same price it did 5-7 days ago, let’s take off four of 12 spreads today (simply to reduce risk).
BSX – Daily
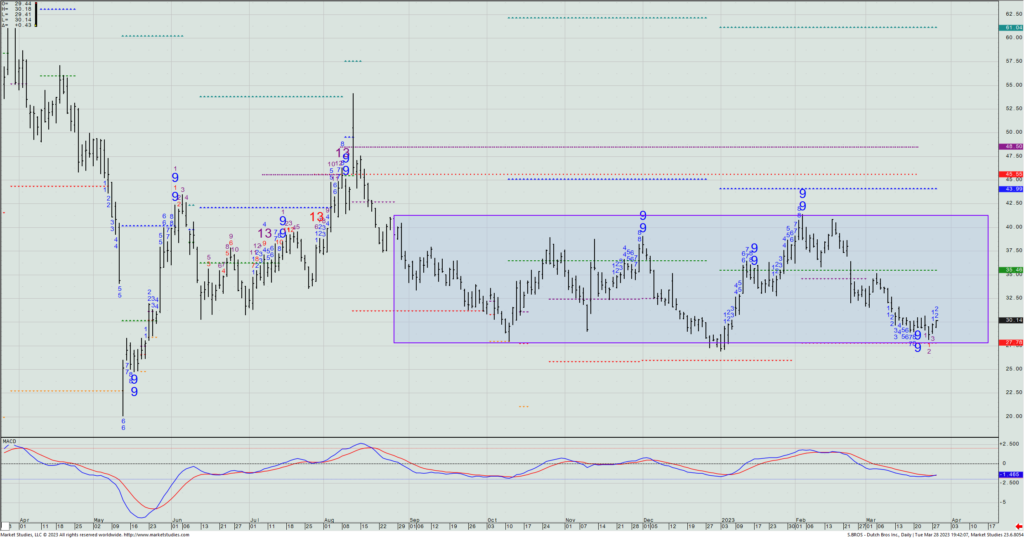
For a new idea, join me in looking at the daily chart of the coffee retail chain, Dutch Bros. Inc. (BROS). The stock has been sideways for six months, and it’s near the bottom of the range and just posted a daily Setup -9 count. As such, let’s look to sell a April 28th $30/$28 put spread. Last night, that closed at $0.83, or 41% of the strike differential. Earnings aren’t till May 10th, so there should be enough time for this to meander higher in the next month before they come into play.
BROS – Daily

DailyPlay Updates – March 27, 2023
Investment Rationale
Here’s a potential hedge play to an idea we already have on: We are bearish the QQQ near the upper end of its trading range, by being long a put spread that expires in 10 days. Now that the Russell 2000 ETF (IWM) is nearing its lower end of its range, we can look to get long it. Ideally, I’d like to sell a put spread on it, but it’s priced way too cheaply (i.e., only receiving 25% of the strike differential I was looking at), so I’m forced to look at buying a call spread instead. But the one I was looking to buy cost 35% of the strike differential, so they’re too expensive. So, “what’s a choosy mother to do”? Well, in this case, maybe it’s just better to buy ~$2000 worth of the ETF, or approximately 11 shares of IWM.
IWM – Weekly
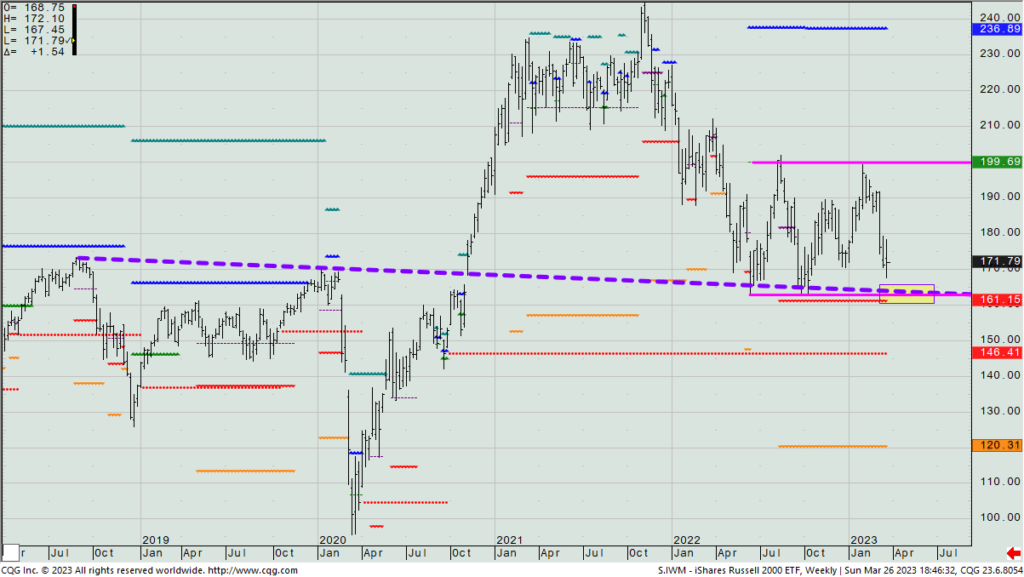
If the QQQ closes any day above last week’s high of $315.25, we’ll get out of the bearish QQQ spread (but hopefully be making money on our long IWM trade). Or, if IWM closes beneath $161, we’ll sell out of the IWM stock (but we’ll hopefully be making money on the QQQ trade).