
$SLV

DailyPlay – Conditional Opening Trade (SLV) – May 15, 2023
SLV Conditional Bearish Opening Trade Signal
View SLV Trade
Strategy Details
Strategy: Short Call Vertical Spread
Direction: Bearish
Details: Sell to Open 30 Contracts June 9th ATM/+$1 Call Vertical Spreads @ a current cost basis of $0.38 Credit per contract.
Total Risk: Based on the current cost basis this trade has a max risk of $1,860 (30 Contracts x $62) based on a hypothetical $100,000 portfolio risking 2%. We suggest using 2% of your portfolio value and divide it by $62 to select the # contracts for your portfolio.
Trend Continuation Signal: This ETF is mildly bearish to bullish and is expected to pull back from this level.
1M/6M Trends: Mildly Bearish/ Bullish
Technical Score: 7/10
OptionsPlay Score: 96
Condition: Open this trade when SLV trades between $22.35 to $22.50. Use the then-current price of SLV (ATM) as the Sell leg strike and +$1 for the Buy leg strike.
Investment Rationale
A loss of 29 bps in the SPX last week, but the Dow lost over 1% while the Nasdaq gained 40 bps. Having fun yet determining which way “the market” is going?
To me, the unresolved potential insolvency of the US government on June 1 is the biggest issue of the day – far more important right now than what the Fed will do next, or where is inflation, or even which regional bank is next to go belly up. There’s just over two weeks till that date, and if our leaders can’t come to terms on raising the debt ceiling by then, few will be happy – most especially every other government in the world that issues debt – because the rates they need pay are all based upon what the US pays. Send ours’s higher on a default, and it costs every government elsewhere more. No es bueno.
As I write this Sunday night, the three major US equity futures markets are down a tad, meaning no major news story came out over the weekend to give the market any real direction yet. But then again, the market hasn’t really wanted to make a decision on which way it really wants to move for several months. And along with my opening salvo, above, the weekly DIA chart is trading above its cloud top; the SPY one just a tad above its own; and the QQQ still beneath its cloud top = No definitive confirmed upside breakout for the US equity markets. (And the IWM is still beneath its cloud bottom.)
My goal is to not only keep you abreast of what’s happening across the major asset classes, but also to help you best navigate the markets. I’ll again mention what I said to you last week: There is little reason to employ new risk capital now; the more important goal is managing your current investment and trading portfolios. We see almost daily that there is no definitive overall trend right now in stocks (and bonds), so deciding to be newly long or short a corporate stock name does not come with an edge. And in my book, no edge = no trade. It’s that simple.
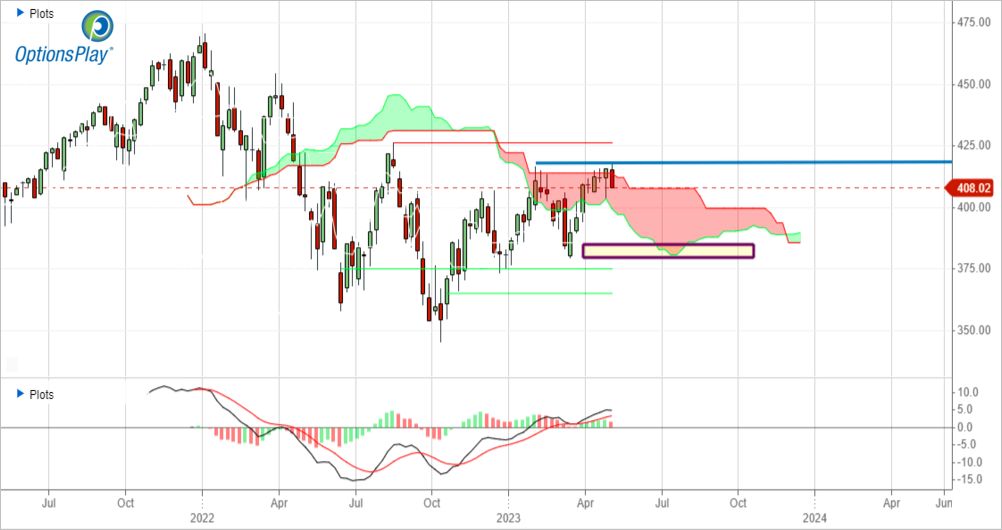
But I don’t mind trading in the commodity area, because here’s there’s more chance for exploiting what appears to be a bunch of trapped buyers in the silver market.
SLV – Daily
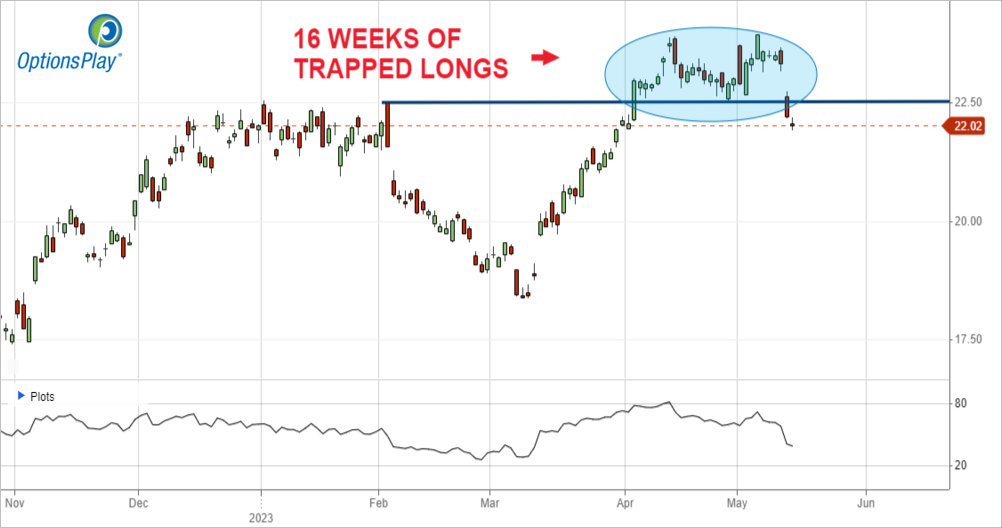
Right now, the SLV June 9th ATM/+$1 higher call spread collects about 38% of the strike differential. I’d like to get a bit more, but the last few days have been sharply lower, so calls have gotten hit hard. If SLV can consolidate at all this week, and we get a chance to sell a rally in the SLV ETF up to the $22.35 to $22.50 level, let’s then sell the SLV June 9th $22.50/$23.50 call spreads for the current bid/offer spread at that time. The credit shouldn’t be meaningfully less than the 38% strike differential, and hopefully it will be a bit more.

DailyPlay Updates – May 12, 2023
Investment Rationale
Stocks saw profit-taking yesterday, though once again, you’d never really know it by looking at the large cap SPX index, where the mega-cap tech names are holding this index up far more so than the equal-weighted SPX (the RSP ETF) or the Russell 2000 index of small cap stocks. They are meaningfully lower than the FANG-y led SPX. Right now, the unresolved debt ceiling issue is the biggest issue overhanging the market, and the closer we get to May 31 with no resolution, the more that investors will be hesitant to commit new capital to the equity market. Personally, I have little intention of doing much at all in stocks until month’s end if this situation is not resolved. A default on US debt is a messy situation all around, and it will affect every debt-issuing government there is.
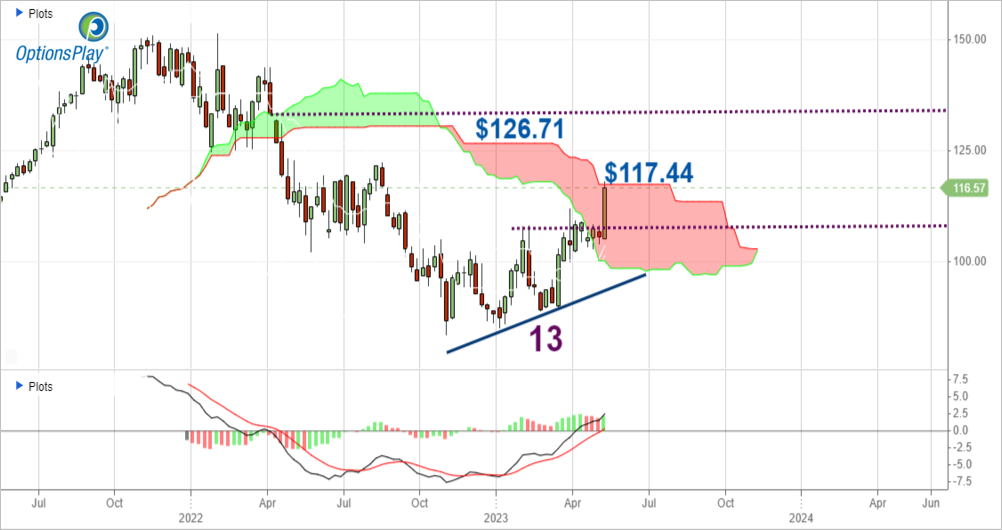
Yesterday’s DP was getting long June 16th $112/$122.5 call spreads – the former strike being where the stock closed on Wednesday. The stock gapped up yesterday to open at $115.39, and in my view, it would have called for you to buy the $115/$125 call spreads instead. Nonetheless, the stock traded as high as $117.92, which means that the first of two upside targets I posted ($117.44) was already achieved in just hours – instead of days.
GOOGL – Weekly
I assume many of you put the trade on, and the portfolio will P&L this as the adjusted strikes because of the large gap up. I’ll keep you informed as time goes on as how to play this, but do understand that this is already at a place that if it took days or weeks to have gotten to, we’d be taking half off now. Do as you choose keeping this in mind.
The Michigan Consumer Confidence number is out this morn, as are earnings from energy heavyweights XOM and CVX. Watch for the equal-weighted SPX to continue underforming the large cap-weighted SPX until there is a debt ceiling resolution.
$GOOGL

DailyPlay – Opening Trade (GOOGL) – May 11, 2023
GOOGL Bullish Opening Trade Signal
View GOOGL Trade
Strategy Details
Strategy: Long Call Vertical Spread
Direction: Bullish
Details: Buy to Open 6 Contracts June 16th $112/$122.50 Call Vertical Spreads @ $3.24 Debit per contract.
Total Risk: This trade has a max risk of $1,944 (6 Contracts x $324) based on a hypothetical $100,000 portfolio risking 2%. We suggest using 2% of your portfolio value and divide it by $324 to select the # contracts for your portfolio.
Trend Continuation Signal: This stock is bullish and we expect this trend to continue.
1M/6M Trends: Bullish/Bullish
Technical Score: 9/10
OptionsPlay Score: 110
Entering the Trade
Use the following details to enter the trade on your trading platform. Please note that whenever there is a multi-leg option strategy, it should be entered as a single trade.
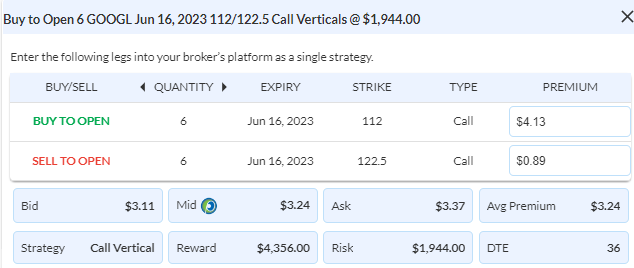
Please note that these prices are based on Wednesday’s closing prices. Should the underlying move significantly during the pre-market hours, we will likely adjust the strikes and prices to reflect a more accurate trade entry.
Investment Rationale
After what looked to be a very surprising non-positive reaction to the better-than-expected CPI number yesterday, investors pushed forward over the final 2.5 hours of the trading day to send stocks out higher – but still beneath the high of the day that was made just after the open. The bulls will claim victory – and it was a mild one – but it was a fairly reluctant one. In fact, one of the sentiment figures I watch actually showed less S&P 500 bulls after Wednesday’s session than there were after Tuesday’s close. It’s just another indicator of just how fickle this market remains.
A reminder that the PPI figure comes out this morn at 8:30am ET. Here is the consensus forecast:

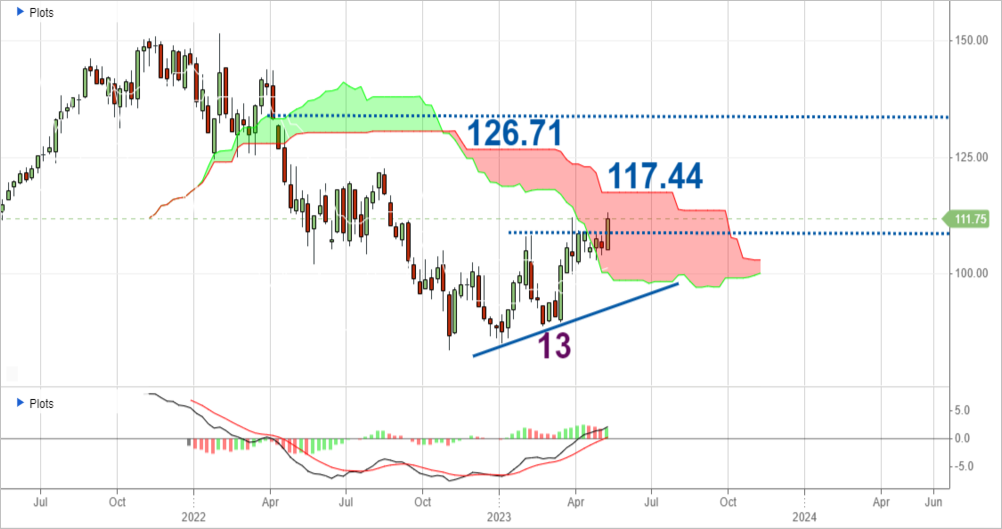
One of the names that looks like it could be picking up some upside momentum is Alphabet (GOOGL). To me, there are two important resistance levels within striking distance: 1) the top of the weekly cloud ($117.44) and, 2) where the Lagging Line would hit the top of its cloud in a few weeks ($126.71). As such, let’s look to get long the June 16th $112/$122.5 call spread. It went out yesterday at $3.24 mid, or some 31% of the strike differential. (Though the VIX remains depressed, many names do not have “cheap” calls. The play I laid out is not expensive, but it’s not a bargain either. This is one of the problems when the VIX gets “cheap”, as calls are bought up on any name that looks even remotely promising.) We’ll probably take off some of the trade when/if the cloud top gets tested, and then more if the $126 area comes into play.
GOOGL – Weekly
DailyPlay Updates – May 10, 2023
Investment Rationale
Yesterday was a profit-taking day ahead of today’s CPI release. All eyes are on this critical inflation figure – most especially amongst Fed Chair Powell and crew. The numbers are expected as below in the far right column:
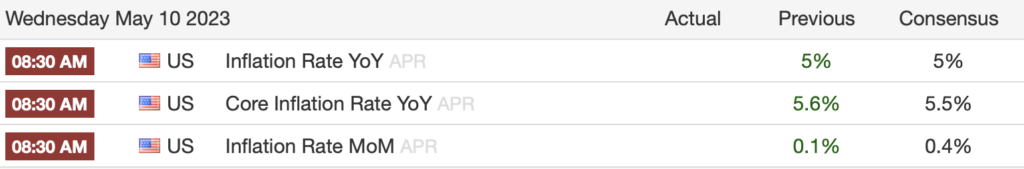
Remember that last month’s OPEC cuts spiked the price of crude oil, and that prior price move has all been given back, so I expect that some will argue that the number may come in higher than what is really relevant now. That may not be the wrong way of looking at things, but stubborn bulls will almost always come up with a reason that the Fed is close to ending their rate hikes and that they’re close to cutting this year. I still don’t think they’re likely to do that this year, and if they are forced to do so because of a problem arises in the system, you can make the case that a rate cut would mean that things are really quite bad, after all.
Though Thursday’s PPI number is not generally as meaningful as today’s CPI figures, if it is way high out of line, it can still be a problem for stock holders. I suspect, however, that today’s number – if enough above or beneath expectations – will set the stage for the next 100+ SPX point move. And in that event, don’t be surprised if that 2.5% move comes quickly.
Portfolio-wise, the four individual SPY put spreads we have on: June 16th $410; $411; $412; and $413 long puts – all vs. selling the $385 puts against, show up as a single 4 contract $411/$385 trade. Our team is diligently looking into seeing how they can separate them into individual listings.
Also, IF CSX trades down to near $31 tomorrow or Thursday, let’s exit 7 of the remaining 17 long $31/$29 put spreads we have on that expire on May 26th.
The fun and games will be evident in the futures markets today at 8:30am ET when the CPI gets released. It will be interesting to see if the futures will make the 9:30am open become a large gap.
DailyPlay Updates – May 9, 2023
Investment Rationale
Monday was a sleeper of a session, with the SPX having but a 19-pt. range – less than 40% of the 54-pt. range averaged over the past 10 days. Why was it so small? It was likely because most investors are going to wait for the CPI figure on Wednesday before deciding how to next proceed. So, if one doesn’t need to do something now, they’re not. (Hint, hint.)
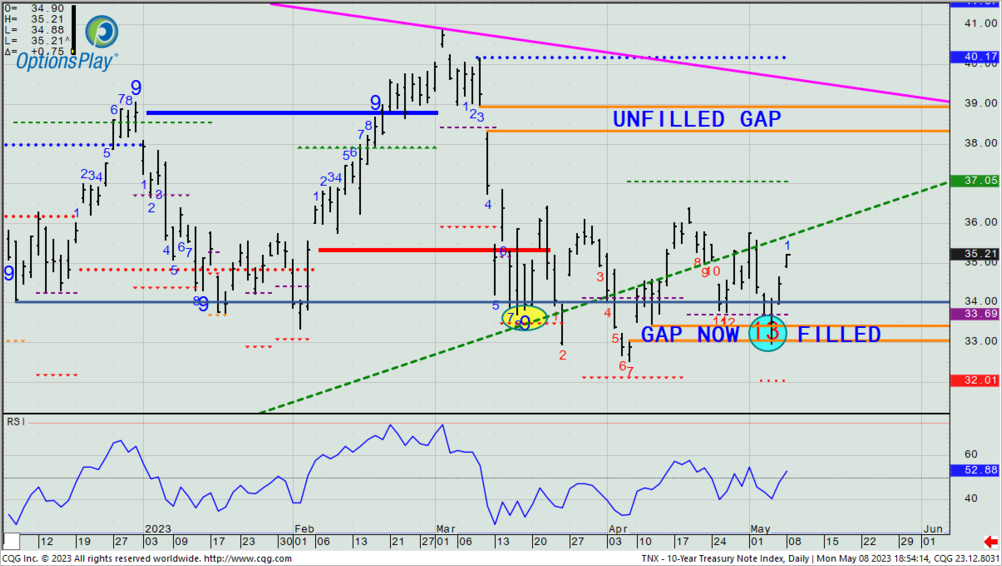
Where we did see some action yesterday was in the bond market, where UST 10yr. rates moved up another 7.5 bps., for as much as 25 bps. since last Thursday’s low yield at 3.3%. I showed you yesterday that the TNX marked a daily -13 signal last Wednesday, and that occurred at the same time that a prior gap got filled down to 3.305%. As an FYI, there still remains a large upside gap from 3.83% to 3.89%, and a continued move up in rates may very well want to test that.
TNX – Daily
With tomorrow’s CPI number potentially being a major determining piece of data to what the Fed may do in the June FOMC meeting, I can tell you that I am personally not now looking to buy or sell anything new in my own accounts — I am simply continuously managing the positions that I already have on. I see little to no reason to employ new capital when we are at the top of the range, and it seems like it’s a pure flip of a coin to where the next 100-200 SPX point move goes.
$MCK, $CSX, $LYFT

DailyPlay – Closing Trade (MCK) Partial Closing Trades (CSX, LYFT) – May 8, 2023
Closing Trade
- MCK – 9.2% Gain: Buy to Close 3 Contracts (or 100% of your remaining Contracts) May 19th $370/$380 Call Vertical Spreads @ $4.22 Debit. DailyPlay Portfolio: By Closing all 3 Contracts, we will be paying $1,266. We took partial profit on this trade when we closed 1 Contract on April 18 @ $3.80 Debit. Our average cost basis to exit this trade is therefore $4.12 Debit and our average gain is 11.46%.
Partial Closing Trades
- CSX – 66.19% Loss: Sell to Close 17 Contracts (or 50% of your Contracts) May 26th $31/$29 Put Vertical Spreads @ $0.23 Credit. DailyPlay Portfolio: By Closing 17 of the 34 Contracts, we will receive $391.
- LYFT – 118.42% Loss: Buy to Close 5 Contracts (or 25% of your remaining Contracts) May 12th $10/$9 Put Vertical Spreads @ $0.83 Debit. DailyPlay Portfolio: By Closing 5 of the remaining 20 Contracts, we will be paying $415.
Investment Rationale
Stocks rallied sharply on Friday from AAPL’s conference call info and the surprise jobs report number and revisions. So, despite that large rally back up above SPX 4130, these numbers likely up the odds that the Fed may again raise rates in June (i.e., the economy is still too hot), though this week’s CPI and PPI numbers could confirm or ameliorate that from happening. After all, the Fed has told us that they are going to be quite data-dependent in determining if going forward they raise or pause the 10 straight rate hikes they’ve gone with.
Friday’s 1.85% rally brings the SPX right back to near the 4148/4155 area that has been the key resistance – and barring two Fridays ago close above there, last week did not confirm the breakout by closing lower on the week. So, we used strength on Friday to put on bearish trades by going long SPY June 16th puts at the 410; 411; 412; and 413 levels – one each – against selling the $385 puts on all four of them. If Friday’s big rally was an overshoot, and investors realize that rates likely stay “higher for longer”, then the market shouldn’t move to new highs again.
MCK had a big move up on Friday (3%), and is at $366 heading into earnings after the bell today. We’re now up only 9% on our short $370/$380 put spread, so let’s kick it out today before earnings.
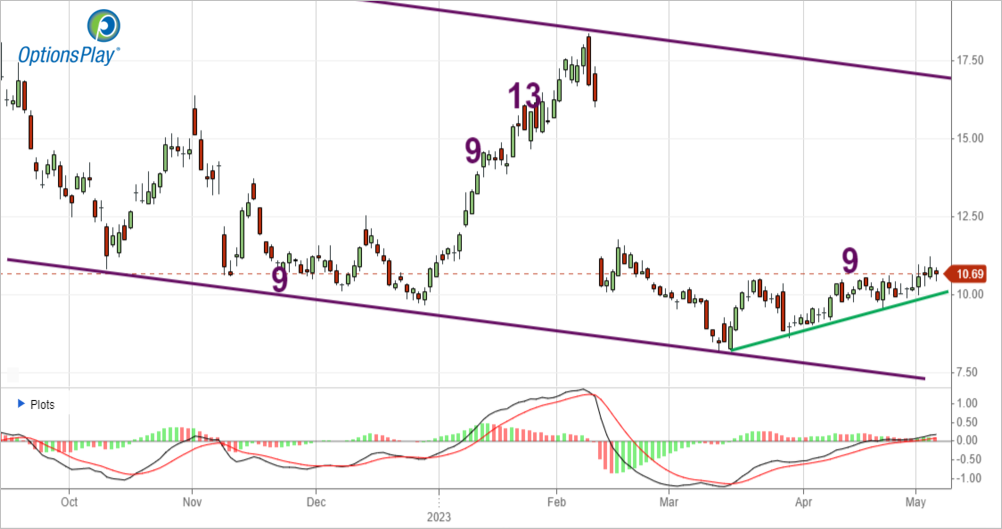
CSX also had a decent upmove. The stock closed at $31.86 and we’re long 34 $31/$29 put spreads expiring May 26th. Though we’ve got time for this trade to work out, Friday’s rally made us down 66% on them, so we are forced to cover half of them today.
LYFT missed on earnings Friday morning and the stock got trashed. We are short the May 12th $10/$9 put spread, now down 118%. Take 5 of 20 off today, and 5 more off each day on Tues, Wed, and Thurs. However, if the stock looks like it is going to close beneath $8.60 on any day, kick the entire balance out.
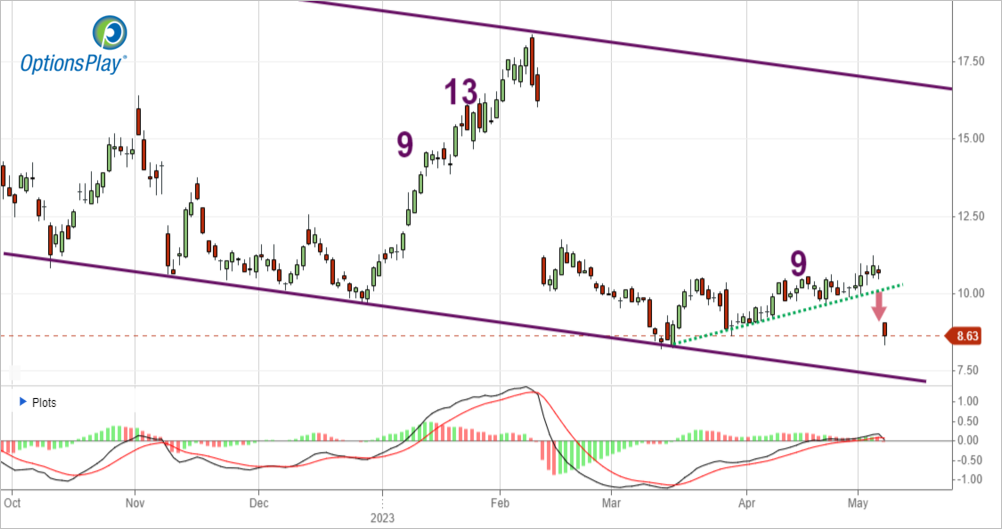
LYFT – Daily
$MDT
DailyPlay – Closing Trade (MDT) – May 5, 2023
Investment Rationale
Pacific West looks to be the latest casualty of the regional bank space, and they could be gone shortly. These other “cockroaches” – which I previously warned would likely tome out of the woodwork are doing just that, and we may start having weekly events like this going forward. So, even given AAPL trading up to near $170 after their earnings came out yesterday, I’d still be looking to sell rallies (and as a reminder, we’re still going to look to go long the SPY June 16th $410; $411, and a $413 put spreads (against selling the $385 strike) if the opportunity comes today or early next week).
I missed seeing that LYFT was set to report earnings yesterday, for I would have been out of virtually all of our short $10/$9 put spreads before they came out. They missed expectations, and a ~20% gain (of which we took partial profits on yesterday morning) turned into a loss. I accept full responsibility for missing that release date, and I will work with our team to make sure that there is a way that I have knowledge of when earnings are next out for every open position we have on.
That being said, we still need manage the trade. With our still having 20 spreads on, let’s see if the stock gets any bounce today from near the $9 level that it traded down to late Thursday afternoon. The reaction seems overdone, and the $8.87 level was the lowest close of late March. We’ll figure out an exit strategy next week.
LYFT – Daily
Elsewhere, MDT broke the $89.57 stop out level we were using to exit the final two long $82.5 calls we’ve had on, so you should have sold out of them yesterday. The large gain we made in this trade has helped offset some of the recent losses.
We are still short 11 IEF $99/$100 call spreads. The ETF rejected the early April high yesterday on its intraday high, so we may still get a chance to kick out of these on a pullback to near the $99.50 area. Look to exit them if that opportunity comes, but also exit the spreads using a close above $101 as your buy-stop level.
IEF – Daily
$SPY
DailyPlay – Conditional Opening Trade (SPY) Closing Trade (USO) Partial Closing Trade (LYFT) – May 4, 2023
Closing Trade
- USO – 92.68% Loss: Buy to Close 8 Contracts (or 100% of your remaining Contracts) June 2nd $67/$65 Put Vertical Spreads @ $1.58 Debit. DailyPlay Portfolio: By Closing the remaining 8 Contracts, we will be paying $1,264. We closed half of the contracts on May 3rd @ $1.30 Debit. Our average cost basis to exit this trade was therefore $1.44 and our average loss on this trade is -75.61%.
Partial Closing Trade
- LYFT – 21.05% Gain: Buy to Close 12 Contracts (or 1/3 of your Contracts) May 12th $10/$9 Put Vertical Spreads @ $0.30 Debit. DailyPlay Portfolio: By Closing 12 of the 32 Contracts, we will be paying $360.
SPY Conditional Bearish Opening Trade Signal
View SPY Trade
Strategy Details
Strategy: Long Put Vertical Spread
Direction: Bearish
Details: Buy to Open 3 Contracts June 16th $410(ATM)/$385 Put Vertical Spreads @ $5.79 Debit per contract.
Total Risk: This trade has a max risk of $1,737 (3 Contracts x $579) based on a hypothetical $100,000 portfolio risking 2%. We suggest using 2% of your portfolio value and divide it by $579 to select the # contracts for your portfolio.
Counter Trend Signal: This ETF is currently neutral to bullish but expected to trade lower over the duration of this trade.
1M/6M Trends: Neutral/Bullish
Technical Score: 7/10
OptionsPlay Score: 182
Condition: Enter this position when SPY is trading between $410 and $413. Use the At The Money (ATM) strike for the Buy leg and $385 for the Sell leg when entering this trade.
Entering the Trade
Use the following details to enter the trade on your trading platform. Please note that whenever there is a multi-leg option strategy, it should be entered as a single trade.
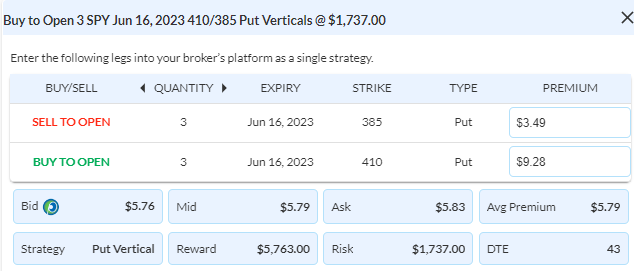
Please note that these prices are based on Wednesday’s closing prices. Should the underlying move significantly during the pre-market hours, we will likely adjust the strikes and prices to reflect a more accurate trade entry.
Investment Rationale
We got the 25 bp. rate hike that was expected, but Fed Chair Powell’s comments that he did not think that inflation was falling enough was the catalyst just past 3pm ET to turn what was about as much of an 18-pt. SPX post-announcement rally into a loss of 29 pts (-0.70%). I think – even if AAPL beats today after the close – that we need to really consider that the recent failure north of SPX 4155 is again going to lead to a decline in what has been the general trading range that we’ve seen in much of 2023.
The oil market again slid hard yesterday, and it’s indicating a coming recession with it back in the $60s. There is no reason to be in our recent bullish USO play, so let’s exit the balance we still have on.
Our short LYFT May 12th $10/$9 put spread is profitable, but with only 9 days to go, I’m truly surprised that we’re only up 21% on the trade. The stock would need to quickly fall 8% in to make that $10 put go in the money. (In other words, in my head we should be up more money than we are.) The OP software has this as a 65% chance of working out for us, but with today possibly marking a daily Combo +13 signal, let’s take 12 of the 32 spreads off today.
LYFT – Daily
We’re still short 11 IEF May 19th $99/$100 call spreads. The ETF closed at $100.25 yesterday. If price pulls back to near the $99.75-$99.50 area, let’s exit the balance of our position.
IEF – Daily
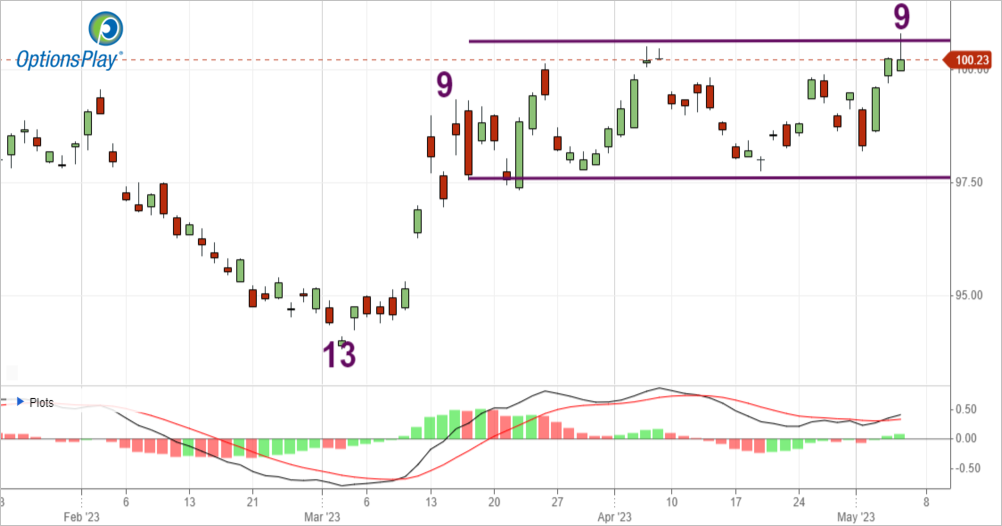
For a new idea, let’s revisit a recent one: putting on a bearish play in the SPY. Now that the Fed is out of the way – and nothing particularly bullish came out of Powell’s press conference – odds get better that price can slide to near its cloud bottom in what has been an up and down trading environment.
When I dig a bit into the charts to get a sense of where to sell a minor rally, I see the SPY 410 to 413 range as where the ETF should face resistance from the recent action. As such, I’m going to recommend we use that zone to THEN get into buying June 16th ATM/$385 put spreads at the then current bid/offer mid-price. (The current ATM/$385 spread costs about 22% of the 23 strike differential. A rally to our entry zone should cost even less.)
SPY – Weekly
Many less-experienced traders are hesitant to get back into a trade idea that they just got stopped out of for a loss. To me, what happened in the past (even if the very recent past) has nothing to do with a new trade idea. In the best case, this works out well and we make good money on the trade. In the worst case, we lose again if we see new highs. This is what trading is all about.
$IEF, $USO
DailyPlay – Partial Closing Trades (IEF, USO) – May 3, 2023
Partial Closing Trades
- IEF – 21.74% Loss: Buy to Close 11 Contracts (or 50% of your remaining Contracts) May 19th $99/$100 Call Vertical Spreads @ $0.56 Debit. DailyPlay Portfolio: By Closing 11 of the remaining 22 Contracts, we will be paying $616.
- USO – 58.54% Loss: Buy to Close 8 Contracts (or 50% of your Contracts) June 2nd $67/$65 Put Vertical Spreads @ $1.30 Debit. DailyPlay Portfolio: By Closing 8 of the 16 Contracts, we will be paying $1,040.
Investment Rationale
New regional banking woes – as in the “cockroaches” that I said weren’t likely the only ones we’d see – came crawling out yesterday with several other more local banks likely falling prey to similar issues to what already took down SVB, Signature, and more recently First Republic. Investors certainly didn’t like this latest news, and knocked the major indexes down a day ahead of the newest FOMC statement later today.
I’m not going to add a new trade idea given the impending news coming at 2pm and then Powell’s press conference at 2:30PM. But we do have a few portfolio updates to review:
- Yesterday, I recommended you take off 2 of 4 long MDT calls, and also said that any day that the stock closes beneath $89.57 we’ll exit the last two. Yesterday the stock closes at $90.23, so we still have the last two left (but continue to watch where this is trading each day going into the closing bell).
- Yesterday, we sold out of 12 of 34 IEF short call spreads for a profit. The move back down in yields yesterday brought the balance to showing a loss. Let’s get out of 11 of the 22 today before the Fed announcement.
- Crude Oil got beaten down badly yesterday; not what we wanted to see with our short USO put spread on. The ETF closed well beneath our hedge strike of $65, so we must get out of no less than half today, and I’ll be looking for any rally to exit the rest. (There is a weekly oil inventory report out today at 10:30am ET, so that news could potentially give a lift (or a further whack). If USO gets back to $65 after that report, I’d just exit the balance of the put spreads.
After having had a pretty good string of winners, we’ve now run into the opposite. This happens in trading, and do not let it discourage you. It’s all part of the game, as well as a good lesson to not let your ego get the best of you after a string of wins. Mr. Market is notorious for taking back what he giveth.
$MDT, IEF
DailyPlay – Partial Closing Trade (MDT, IEF) – May 2, 2022
Partial Closing Trade
- MDT – 345.31% Gain: Sell to Close 2 Contracts (or 50% of your remaining Contracts) May 19th $82.50 Calls @ $8.55 Credit. DailyPlay Portfolio: By Closing 2 of the 4 remaining Contracts, we will receive $1,701
- IEF – 26.09% Gain: Buy to Close 12 Contracts (or 1/3 of your Contracts) May 19th $99/$100 Call Vertical Spreads @ $0.34 Debit. DailyPlay Portfolio: By Closing 12 of the 34 Contracts, we will be paying $408.
Investment Rationale
Price meandered yesterday but then a mild decline late in the day took the SPX into a minor loss of 2 points. No harm; no foul, as they say. I’m not expecting much to happen until Wednesday’s Fed meeting, so much of what is really being done is really just traders and PMs paring some of their positions before the rate announcement and subsequent press conference afterwards. I tend to me more in the camp that we see a 25 bp. hike on Wednesday and then possibly another one in June. Then a pause – not one that means anything more than that they won’t raise again unless/if the data that comes over the summer suggests that they still need to tighten things up. I would not take it to mean that their job is done.
Looking at our open portfolio positions, let’s take 2 of 4 MDT calls off today. Price has stalled at the bullish Propulsion Momentum Level of $91.70, and why not lock in some more of the 345% we’re up on this trade. Any daily close beneath $89.57 and we’ll exit the final two calls.
MDT – Weekly
Our IEF short call trade is up 26% in just two days with yesterday’s 12 bp. rally in the TNX. We have 34 of these bearish call spreads on, so let’s take 12 of them off today to lock some quick profit and reduce the trade before tomorrow’s FOMC announcement.
Yesterday MCK got whacked for a 2.8% loss (the stock fell over $10 to $354) and makes our short $370/$380 call spread a little more secure (with 18 days till expiration). If today or tomorrow trades down to the $348.75/.25 area, exit 1 of 3 remaining spreads.
We’ll see what today brings and clean up things a bit more tomorrow to get done before the FOMC announcement. Lastly, I spoke with Tony yesterday and he wants to keep on his short AAPL trade into its earnings report which comes out Thursday after the close.