
$BROS

DailyPlay – Partial Closing Trade (BROS) – April 25, 2023
Partial Closing Trade
- BROS – 87.18% Gain: Buy to Close 1 Contract (or 50% of your remaining Contracts) April 28th $30/$28 Put Vertical Spread @ $0.10 Debit. DailyPlay Portfolio: By Closing 1 of the 2 Contracts, we will be paying $10.
Investment Rationale
A fairly insignificant day for stocks on Monday, as the SPX added but 3.5 pts. to 4137 as investors wait for a whopping 35% of all S&P 500 companies reporting earnings today through Thursday (including several mega-cap tech names). These three days could finally create the impetus for a breakout move higher or a several percent move down if we see disappointing results. We’re all anxiously waiting for something to happen to get us out of the choppy range funk we’ve been in this year.
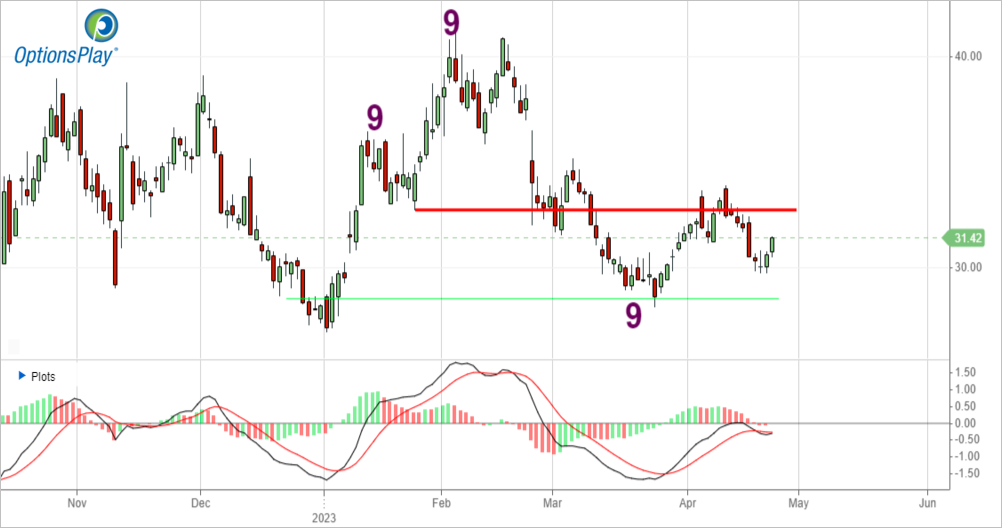
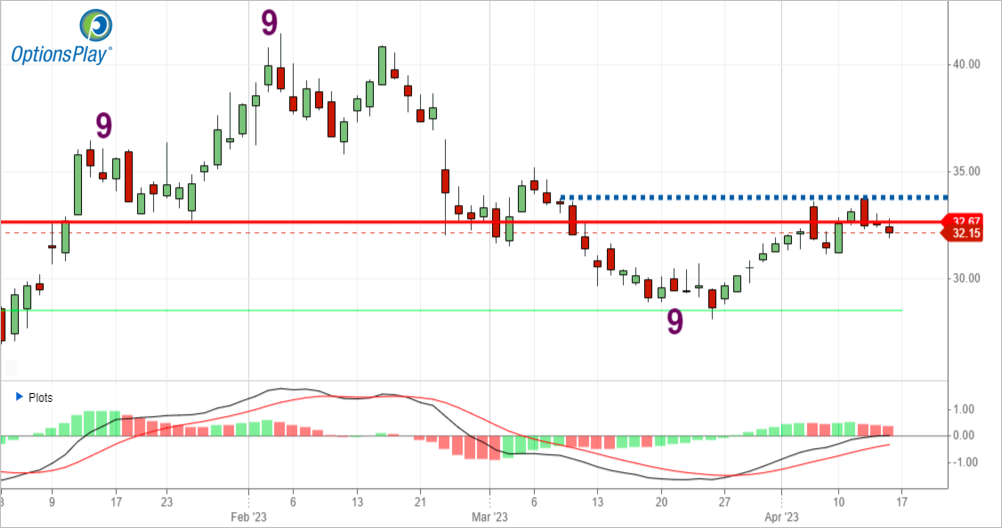
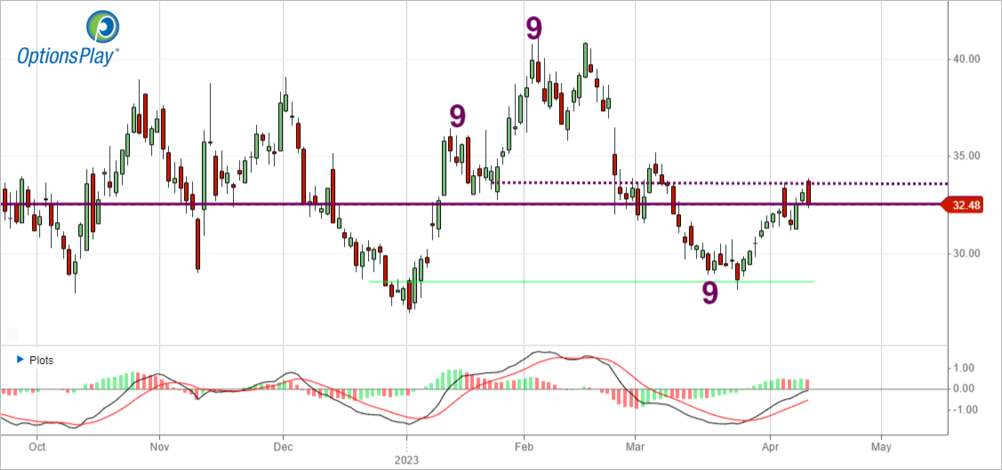
In our portfolio, we still have on 2 short BROS $30/$28 put spread that expires this Friday. The stock closed yesterday at $31.42. We’re up 87% on these, so let’s kick out one of these today. And should today go into the close with the stock trading under $30.05, we’ll sell the other one on the close.
BROS – Daily
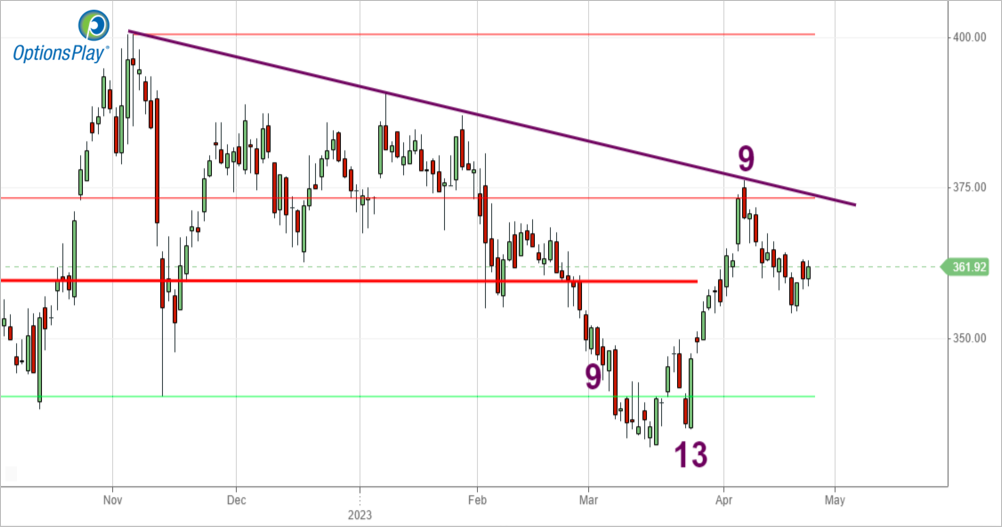
We’re also short 3 MCK May 19th $370/$380 put spreads. With the stock at just shy of $362, we’re up 23% (although it feels like we should be up more). But earnings come out on May 8th, and until that report is out of the way, we’re not going to see the vol component of the spread price really come in. Considering the stock has not properly broken beneath its bearish Propulsion Momentum level at $358.68, let’s cover one of those 3 spreads today IF the stock is trading above that level going into today’s close.
MCK – Daily
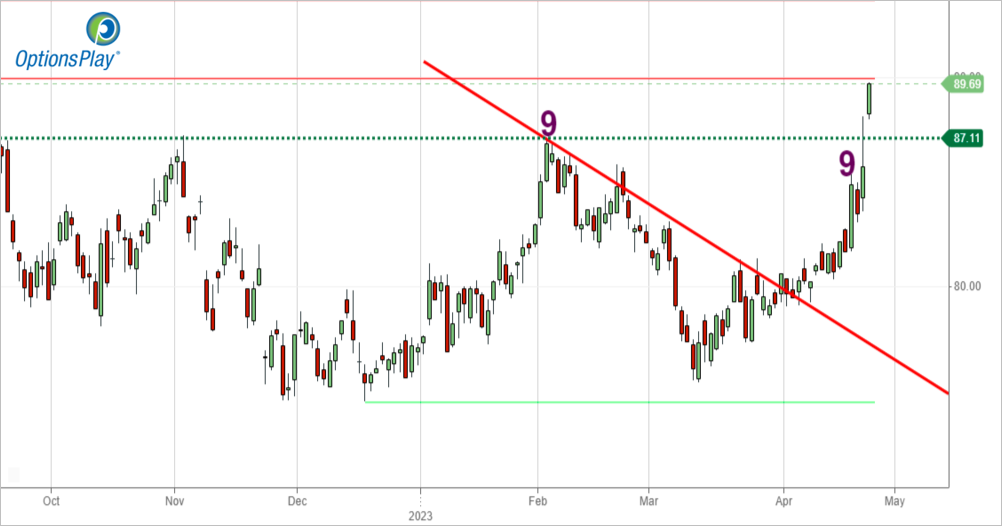
Our long MDT call trade has been a homerun, now up 303% on the remaining 5 contracts. (We took 5 off yesterday.) On any day this week that the stock first trades above $90.50, we’ll take off another one contract.
MDT – Daily
$GILD

DailyPlay – Opening Trade (GILD) Partial Closing Trades (LIT, MDT) – April 24, 2023
Partial Closing Trades
- LIT – 86.59% Loss: Sell to Close 7 Contracts (or 50% of your Contracts) May 19th $64/$69 Call Vertical Spreads @ $0.22 Credit. DailyPlay Portfolio: By Closing 7 of the 14 Contracts, we will receive $154.
- MDT – 131.77% Gain: Sell to Close 5 Contracts (or 50% of your Contracts) May 19th $82.50 Calls @ $4.45 Credit. DailyPlay Portfolio: By Closing 5 of the 10 Contracts, we will receive $2,225.
GILD Bullish Opening Trade Signal
View GILD Trade
Strategy Details
Strategy: Long Call Vertical Spread
Direction: Bullish
Details: Buy to Open 8 Contracts June 16th $87.5/$95 Call Vertical Spreads @ $2.30 Debit per contract.
Total Risk: This trade has a max risk of $1,848 (8 Contracts x $231) based on a hypothetical $100,000 portfolio risking 2%. We suggest using 2% of your portfolio value and divide it by $231 to select the # contracts for your portfolio.
Trend Continuation Signal: This stock is bullish and is expected to continue higher.
1M/6M Trends: Bullish/Bullish
Technical Score: 10/10
OptionsPlay Score: 113
Entering the Trade
Use the following details to enter the trade on your trading platform. Please note that whenever there is a multi-leg option strategy, it should be entered as a single trade.

Please note that these prices are based on Friday’s closing prices. Should the underlying move significantly during the pre-market hours, we will likely adjust the strikes and prices to reflect a more accurate trade entry.
Investment Rationale
The SPX ended last week down just a few points on the week, again showing its inability to hurdle the 4148/4155 major resistance area I have highlighted for a few months.
First things first: Right after we got long lithium (via the LIT ETF), a negative story came out on the space and all lithium-related stocks got mushed. We quickly have lost 87% of our long premium paid. I make no excuses. It was bad luck and we should exit at least half our trade now (that’s 7 of 14 long spreads) and hope to perhaps recover some of it in coming days.
With the bad we have plenty of good, too. Let’s remove 5 of 10 long MDT May 19th $82.50 calls we have on, up 131% on them.
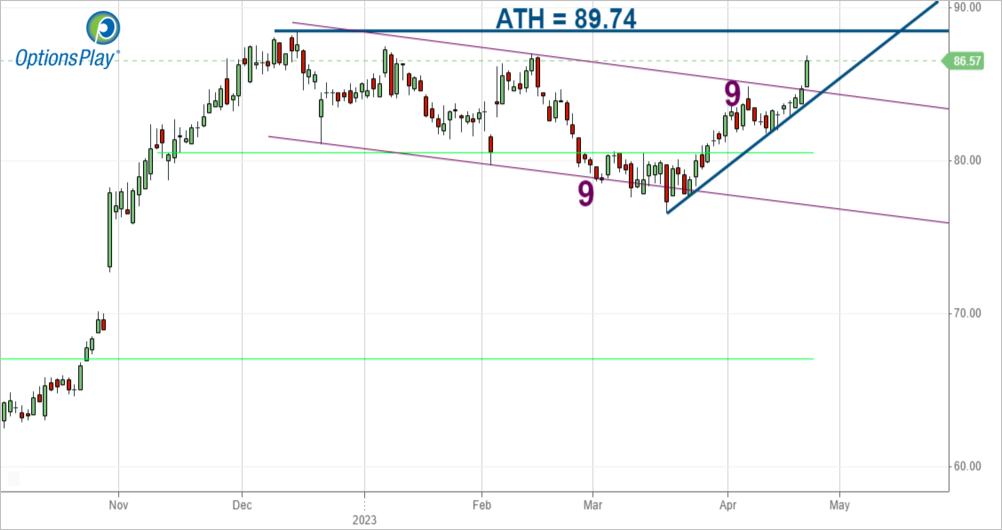
And here’s a new idea that we’re going to play through their earnings report on May 3rd. Let’s look to buy the GILD June 16th $87.5/$95 call spread, as I suspect the breakout of both the flag pattern and the Lagging Line breaking out above its cloud should lead to a test of (or even a breakout above) all-time highs. Friday saw this go out at $2.305, or just shy of 31% of the strike differential. With a good earnings report we’ll keep this on; with a bad one we’ll say bye-bye.
GILD – Daily
$SPY
DailyPlay – Opening Trade (SPY) – April 21, 2023
SPY Bearish Opening Trade Signal
View SPY Trade
Strategy Details
Strategy: Long Put Vertical Spread
Direction: Bearish
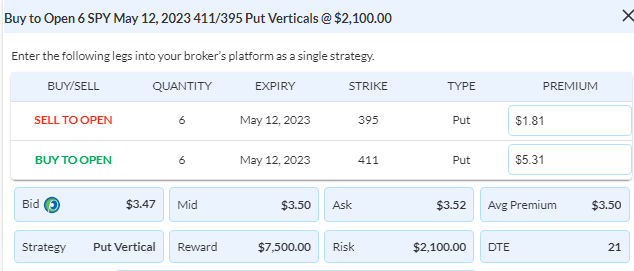
Details: Buy to Open 6 Contracts May 12th $411/$395 Put Vertical Spreads @ $3.50 Debit per contract.
Total Risk: This trade has a max risk of $2,100 (6 Contracts x $350) based on a hypothetical $100,000 portfolio risking 2%. We suggest using 2% of your portfolio value and divide it by $350 to select the # contracts for your portfolio.
Counter Trend Signal: This stock has traded into an area of resistance and is expected to pull back lower.
1M/6M Trends: Bullish/Bullish
Technical Score: 7/10
OptionsPlay Score: 152
Entering the Trade
Use the following details to enter the trade on your trading platform. Please note that whenever there is a multi-leg option strategy, it should be entered as a single trade.
Please note that these prices are based on Thursday’s closing prices. Should the underlying move significantly during the pre-market hours, we will likely adjust the strikes and prices to reflect a more accurate trade entry.
Investment Rationale
TSLA’s numbers and a non-rosy Beige Book report gave no reason for buyers to keep up their bidding on Thursday, and the SPX sold off 25 pts. to end the day at 4130 – precisely 25 pts. beneath the 4155 key resistance from the weekly cloud top that has continually rejected the advance this year.
Two quick things: 1) You should already be out of the long BSX call that expires today. 2) Yesterday the USO trade sold down to where we got in it, which I had said would be our stop-out. So, you should now be flat it. I will watch to see if support holds because I’d lean more on the bullish side than not, and if so, we’ll put another long spread back on next week.
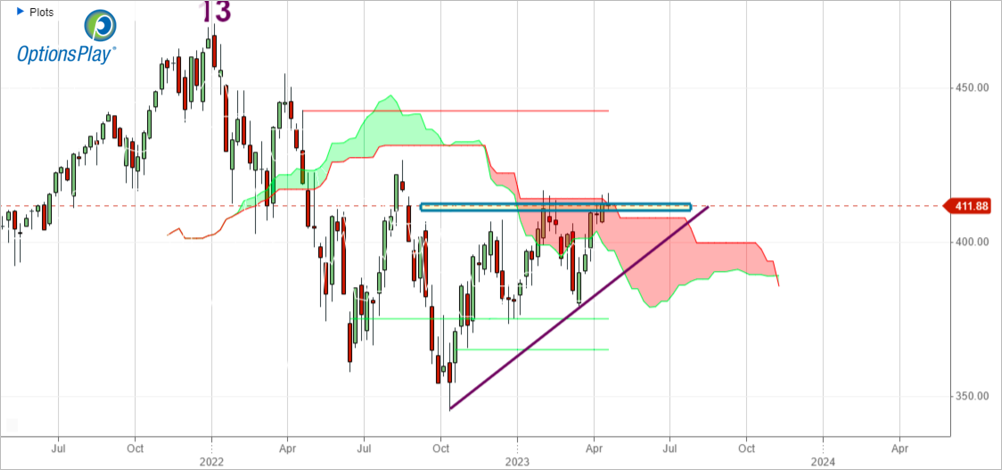
I realized that I didn’t need to look far for a new play today, because it was virtually obvious to me: Let’s bet bearishly on the SPY, until it and the SPX close above their respective weekly cloud tops. (That could happen today, of course, but it seems worth the small risk for a potential reward that is probably 3-4x.)
As such – and with the VIX at 17 – let’s look to buy a SPY May 12th $411/$395 put spread. It went out yesterday at just about $3.50, costing a mere 22% of the strike differential.
SPY – Weekly
$AAPL
DailyPlay – Opening Trade (AAPL) Closing Trade (BSX) – April 20, 2023
Closing Trade
- BSX – 234.46% Gain: Sell to Close 1 Contract (or 100% of your remaining Contracts) April 21st $48 Calls @ $4.95 Credit. DailyPlay Portfolio: By Closing the remaining 1 Contract, we will receive $495. We took partial profit on March 29 when we closed 4 Contracts @ $1.45 Credit, then on April 6 when we closed 4 Contracts @ $2.83 Credit, then on April 11 when we close 2 Contracts @ $2.45 Credit, and on April 19 when we closed 1 Contract @ $3.65 Credit. Our average cost basis to exit this trade is therefore $2.55 Credit and our average gain on this trade is 72.41%.
AAPL Bearish Opening Trade Signal
View AAPL Trade
Strategy Details
Strategy: Long Put
Direction: Bearish
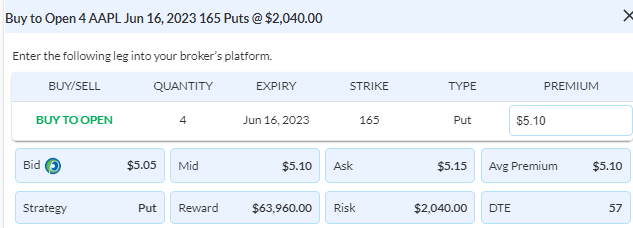
Details: Buy to Open 4 Contracts June 16th $165 Put @ $5.10 Debit per contract.
Total Risk: This trade has a max risk of $2,040 (4 Contracts x $510) based on a hypothetical $100,000 portfolio risking 2%. We suggest using 2% of your portfolio value and divide it by $510 to select the # contracts for your portfolio.
Counter Trend Signal: This stock has traded into an area of resistance and is expected to pull back lower.
1M/6M Trends: Bullish/Bullish
Technical Score: 8/10
OptionsPlay Score: 80
Entering the Trade
Use the following details to enter the trade on your trading platform. Please note that whenever there is a multi-leg option strategy, it should be entered as a single trade.
Please note that these prices are based on Wednesday’s closing prices. Should the underlying move significantly during the pre-market hours, we will likely adjust the strikes and prices to reflect a more accurate trade entry.
Investment Rationale
We don’t find an opportunity to trade AAPL based on valuations often, but I find today’s valuation difficult to get behind. Additionally the timing and risk/reward favors adding short exposure going into a tech heavy earnings week.
AAPL has rallied 35% over the past 4 months or so, which pushes its valuation north of 28x 2023FY estimated earnings. This is despite analysts expecting a 2.4% decline in EPS, inline with the S&P 500, but it represents a 55% premium relative to the market. Now, we all expect AAPL to trade at a premium, its profitability and product pipeline deserves it. But in the face of a weakening consumer, it’s hard to get behind a valuation that is priced to perfection.
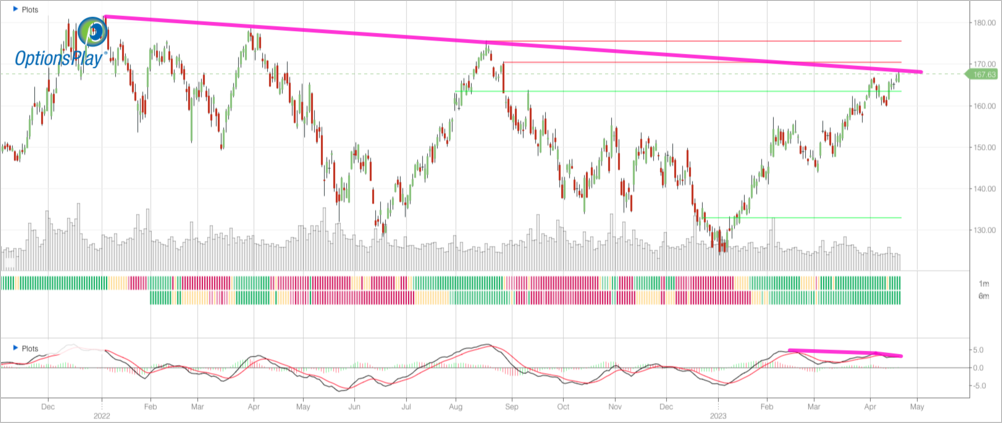
Additionally, if we look at the Chart, AAPL has largely remained rangebound since the beginning of 2022 and a clear bearish resistance line has formed since. This level was just tested yesterday and I see it as a potential reversal point. We have also seen bearish divergence with MACD over the past 2 months, an additional sign of exhaustion.
As implied volatility (IV) for AAPL approaches 52-week lows, a unique opportunity arises to obtain unlimited downside exposure with a straight put at elevated valuations and against a significant resistance level with merely two weeks until earnings. Consequently, I am considering the purchase of the June $165 puts for $5.10 Debit. This put option entails risking 3% of the stock’s value, as we move into the earnings period in two weeks.
AAPL – Daily
$BSX
DailyPlay – Partial Closing Trade (BSX) – April 19, 2023
Partial Closing Trade
- BSX – 146.62% Gain: Sell to Close 1 Contract (or 50% of your remaining Contracts) April 21st $48 Calls @ $3.65 Credit. DailyPlay Portfolio: By Closing 1 of the remaining 2 Contracts, we will receive $365.
Investment Rationale
Yesterday saw all four major US stock indexes with very minor gains or losses. Notably, however, was that the SPX closed at 4155 – the level of the top of the weekly cloud. Three more trading days in the week: Will it be able to close above it or not? (And if it’s not materially above it, then we’d really need see how next week traded to see if it is a real upside breakout or not.)
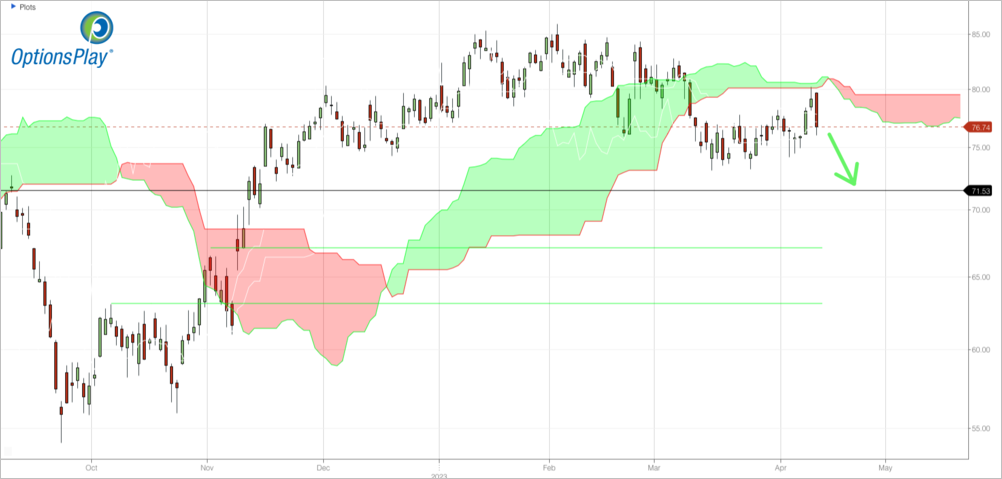
Today is the weekly crude oil inventory number at 10:30am ET. If you have any oil-related names, you need to know that this weekly report can and usually does easily move them. For us, we still have on two long USO $71/$77 call spreads (as the remnants of what was originally a long condor spread). We are up 36% on these. If the bid/offer spread comes down to our only being up 25% on them, I want you to remove one of two spreads (and not wait for breakeven as I had suggested yesterday).
USO – Daily
Let’s also take off one of two long BSX $48 calls. We’re up 147% on these and they expire Friday. (We’ll take the other one off tomorrow.)
$LIT

DailyPlay – Closing Trade (FSLR) Partial Closing Trade (MCK) – April 18, 2023
Closing Trade
- FSLR – 60.96% Loss: Buy to Close 3 Contracts (or 100% of your Contracts) April 28th $210/$220 Call Vertical Spreads @ $5.73 Debit. DailyPlay Portfolio: By Closing all 3 Contracts, we will be paying $1,719.
Partial Closing Trade
- MCK – 18.24% Gain: Buy to Close 1 Contract (or 25% of your Contracts) May 19th $370/$380 Call Vertical Spreads @ $3.80 Debit. DailyPlay Portfolio: By Closing 1 of the 4 Contracts, we will be paying $380.
LIT Bullish Opening Trade Signal
View LIT Trade
Strategy Details
Strategy: Long Call Vertical Spread
Direction: Bullish
Details: Buy to Open 14 Contracts May 19th $64/$69 Call Vertical Spreads @ $1.43 Debit per contract.
Total Risk: This trade has a max risk of $1,988 (14 Contracts x $142) based on a hypothetical $100,000 portfolio risking 2%. We suggest using 2% of your portfolio value and divide it by $142 to select the # contracts for your portfolio.
Trend Continuation Signal: This stock has recently turned mildly bullish, and is expected to continue this trend.
1M/6M Trends: Mildly Bullish/Bearish
Technical Score: 4/10
OptionsPlay Score: 103
Entering the Trade
Use the following details to enter the trade on your trading platform. Please note that whenever there is a multi-leg option strategy, it should be entered as a single trade.
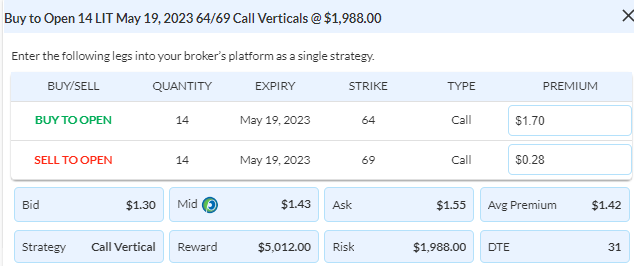
Please note that these prices are based on Monday’s closing prices. Should the underlying move significantly during the pre-market hours, we will likely adjust the strikes and prices to reflect a more accurate trade entry.
Investment Rationale
A second half of the day rally on Monday gave the SPX a close of 4151 – just four points beneath the key 4155 level that we’ve been focused on for Friday’s close. And the more above it that it hurdles that level, the more you’ll likely see shorts being forced to cover their positions.
Our portfolio positions have mostly done well, as we’ve got a more bullishly skewed one. However, FSLR has moved up sharply the past few days, taking it right back to the top of its range (and with a slightly higher high and the best close of the whole upmove). Let’s look to cover this trade today and take our loss.
FSLR – Daily
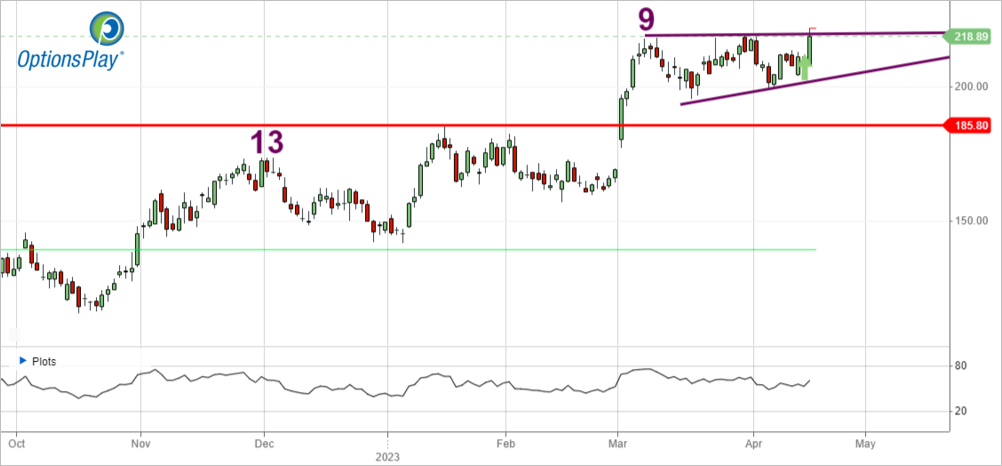
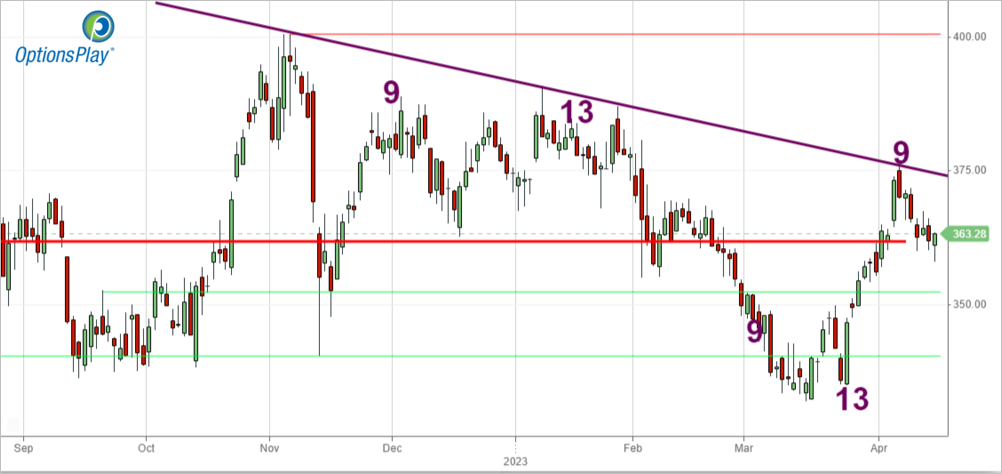
With MCK having gotten close or even traded down to the bearish Propulsion Momentum level of $358.68 but not being able to get beneath it, let’s take one 1 of four bearish call spreads off today, and now stop yourself out on the balance if this rallies back up to your entry price being the mid- price of the spread. For us that’s $4.65, but your’s may be different.
MCK – Daily
In our long USO $71/$77 call spread, we have plenty of time till expiration. However, if the mid- price gets back down to our entry price of $1.90, sell one of two remaining spreads. That stop is in effect for any day going forward. Tomorrow is the weekly oil inventory report. An unexpected bullish number could end up crushing shorts.
USO – Daily
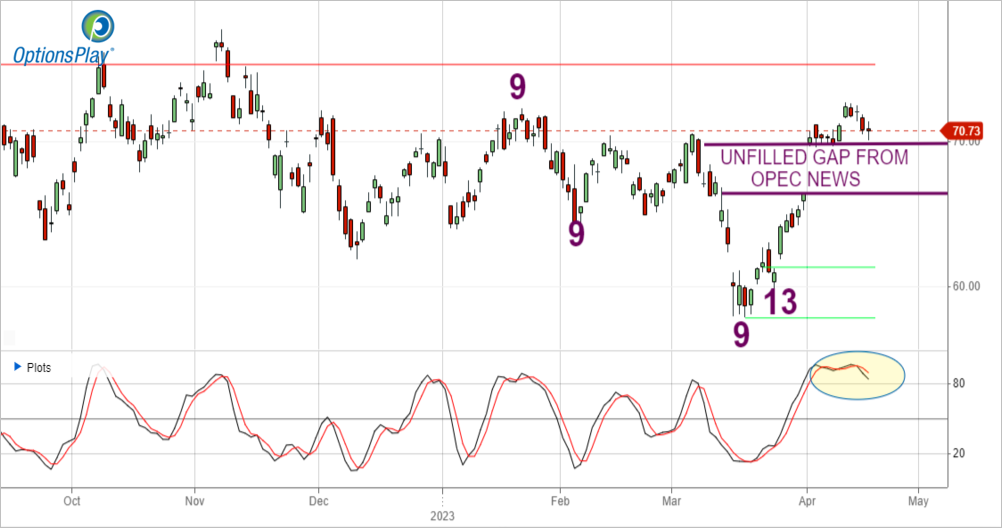
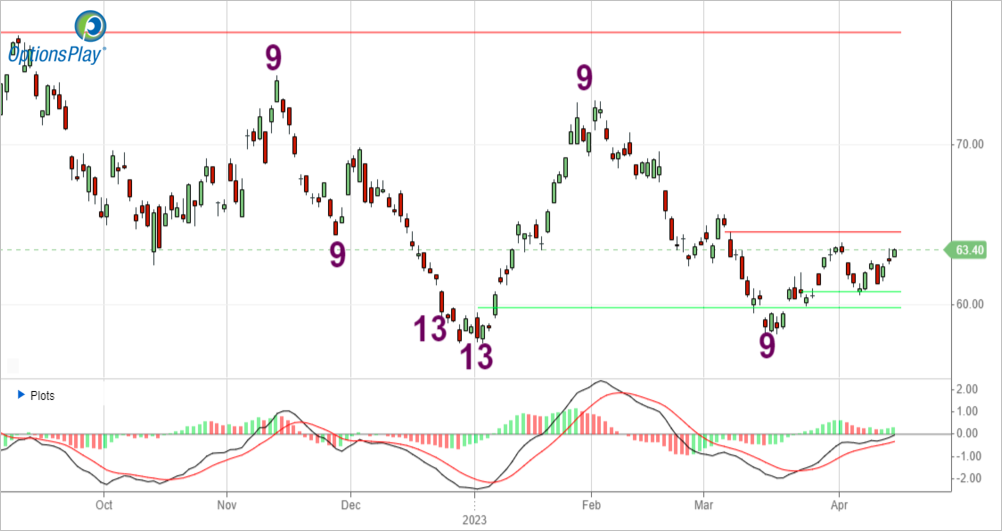
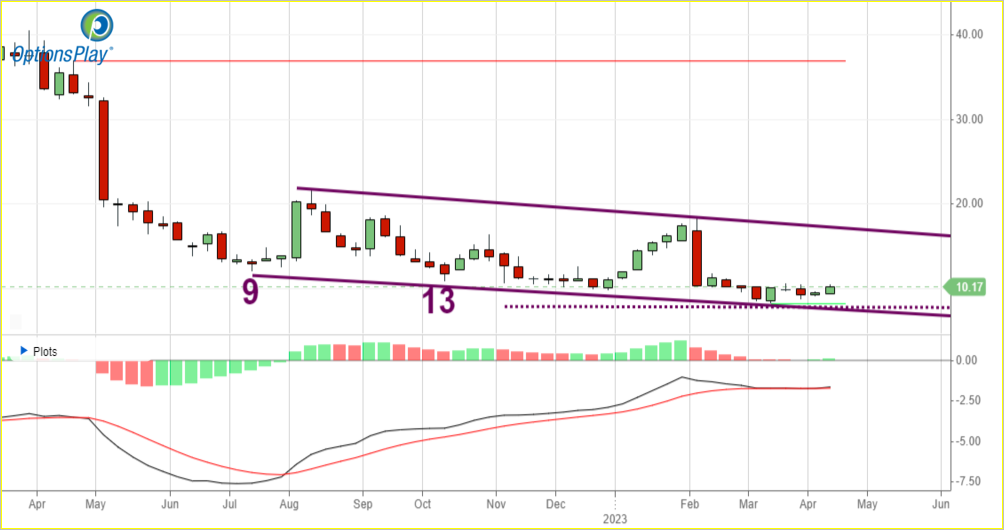
Lastly, here’s a new play that I’d more prefer to do as a short put spread than a long call spread, but selling the put spread doesn’t yield enough credit for me to do it (i.e., 35% of the strike differential I was looking at). Therefore, let’s look to get long the LIT May 19th $64/$69 call spread for a cost of $1.43 based on yesterday’s closing mid, representing some 29% of the strike differential. Notice the effectiveness over the past six months on the daily chart of the DeMark 9s and 13s, as well as the recent low right near the bearish Propulsion Momentum level of $60.19 that could not be downside breached.
LIT – Daily
$LYFT
DailyPlay – Opening Trade (LYFT) Partial Closing Trade (BROS) – April 17, 2023
Partial Closing Trade
- BROS – 64.10% Gain: Buy to Close 2 Contracts (or 50% of your remaining Contracts) April 28th $30/$28 Put Vertical Spreads @ $0.28 Debit. DailyPlay Portfolio: By Closing 2 of the remaining 4 Contracts, we will be paying $56.
LYFT Bullish Opening Trade Signal
View LYFT Trade
Strategy Details
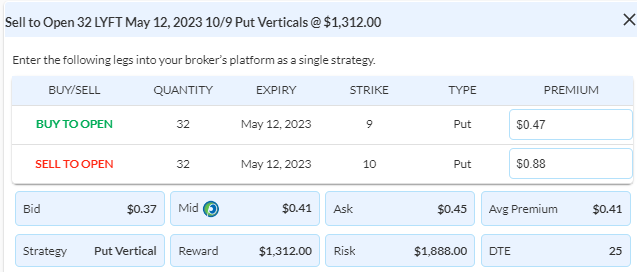
Strategy: Short Put Vertical Spread
Direction: Bullish
Details: Sell to Open 32 Contracts May 12th $10/$9 Put Vertical Spreads @ $0.41 Credit per contract.
Total Risk: This trade has a max risk of $1,888 (32 Contracts x $59) based on a hypothetical $100,000 portfolio risking 2%. We suggest using 2% of your portfolio value and divide it by $59 to select the # contracts for your portfolio.
Trend Continuation Signal: This stock has recently turned mildly bullish, which is expected to continue this trend.
1M/6M Trends: Mildly Bullish/Bearish
Technical Score: 3/10
OptionsPlay Score: 92
Entering the Trade
Use the following details to enter the trade on your trading platform. Please note that whenever there is a multi-leg option strategy, it should be entered as a single trade.
Please note that these prices are based on Friday’s closing prices. Should the underlying move significantly during the pre-market hours, we will likely adjust the strikes and prices to reflect a more accurate trade entry.
Investment Rationale
Bulls like that the market continues to hold up in the face of macro news that still isn’t justifiably strong, but that in their opinion, is already “priced in”. Data from the biggest mutual fund managers don’t agree. To me, I can’t pretend that I didn’t see the weekly SPY cloud chart get an upside breach of its cloud last week, but, the SPX did NOT get a similar upside breakout above its weekly cloud top (at 4155 from now through most of May). Seeing the SPX do so this Friday (or in any of the next several Friday closes) has to make me take some degree of bearishness away. That’s the logical way to play the market and this particular indicator. (The Dow has already broken above its weekly cloud top; the QQQ still has a few percent to go to do the same.)
SPY – Weekly
Before I get into any position updates, there is something that I want to tell you that is not a standard option rule, or a Tony rule, but frankly – a Rick “guideline”. It has to do with opening gaps and playing ideas that we put out in Daily Plays. Here’s one that came into play last week, and is an example of a trade that I would not have necessarily entered myself near 10am because the change in the option price by 10am (when we mark our positions) was by 8+ percent lower than where it was on the prior day’s close. Honestly, that’s just above the 7% change in price I’m generally willing to put a trade on from how I first analyzed it the night before.
Now, we are making money on this trade because vol has come lower and the stock price is lower than where we sold this call spread. But be careful putting on spreads where the move is more than about 7% from where it was when I priced the idea. Sometimes, it is better to do the trade at a different time in the day, when price may adjust back more towards the prior day’s closing price. And sometimes, I just won’t put the trade on because the numbers no longer work out for me the way they had the night before, making, for example, perhaps a lesser percent of strike differential than I’m willing to accept.
Position-wise, we are long 2 BSX $48 calls that expire on Friday. The stock closed last Friday at $51.77, and we are up 157% on the two calls we have left. If any day this week, that premium percentage comes down to close less than 125%, exit the two calls. If not, we’ll try to hold this till Thursday.
We’re still short 4 BROS April 28th $30/$28 put spreads. When I put the trade on, the upside target I had in mind was the TDST line at $33.60, which has now been near two daily highs since then. As such, let’s take 2 of 4 spreads off today, giving us the flexibility to play with the last two but locking in a 64% gain on these two.
BROS – Daily
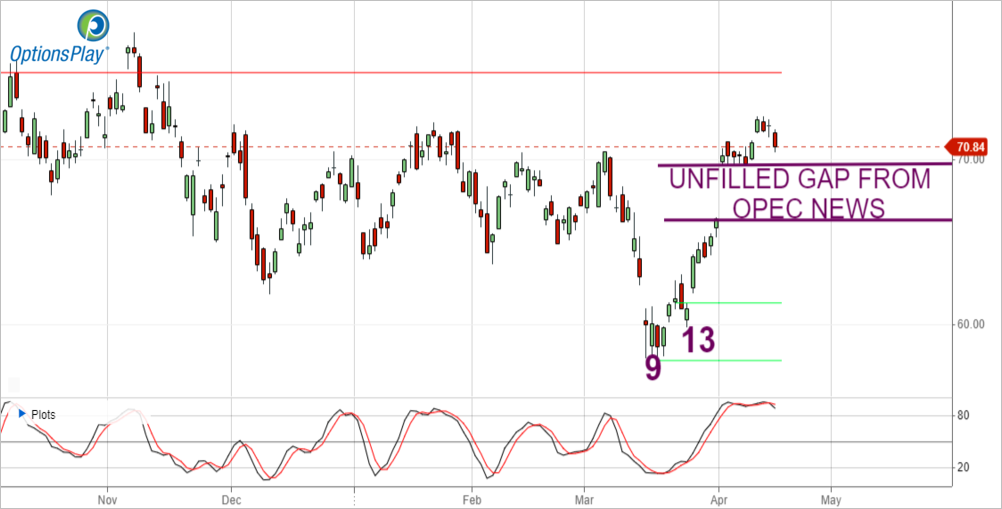
Lastly, for a new play, let’s revisit the bullish LYFT idea we had played earlier this year. With the stock two weeks ago again having bounced right on the -13s Risk level ($8.63), let’s look to this time to sell the May 12th $10/$9 put spread. (Earnings do come out on May 2nd.) We can collect $0.41 on this, which is 41% of the strike differential, and effectively brings our cost down to $9.59 if exercised. We know that we don’t want to be long on Friday closes beneath $8.63.
LYFT – Weekly
$MDT
DailyPlay – Opening Trade ( MDT) – April 14, 2023
MDT Bullish Opening Trade Signal
View MDT Trade
Strategy Details
Strategy: Long Call
Direction: Bullish
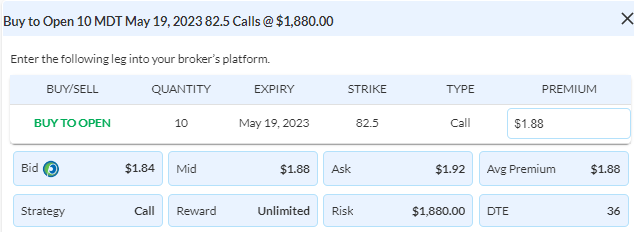
Details: Buy to Open 10 Contracts May 19th $82.50 Calls @ $1.88 Debit per contract.
Total Risk: This trade has a max risk of $1,880 (10 Contracts x $188) based on a hypothetical $100,000 portfolio risking 2%. We suggest using 2% of your portfolio value and divide it by $188 to select the # contracts for your portfolio.
Trend Continuation Signal: This stock has recently turned bullish and a continued bounce higher is expected.
1M/6M Trends: Bullish/Mildly Bullish
Technical Score: 5/10
OptionsPlay Score: 76
Entering the Trade
Use the following details to enter the trade on your trading platform. Please note that whenever there is a multi-leg option strategy, it should be entered as a single trade.
Please note that these prices are based on Thursday’s closing prices. Should the underlying move significantly during the pre-market hours, we will likely adjust the strikes and prices to reflect a more accurate trade entry.
Investment Rationale
With better-than-expected PPI numbers yesterday, the SPX surged higher and is now playing with a potential qualified upside breakout on a close above 4155 today. That level is 7 points above the bullish Propulsion Momentum level, as well as being the top of the weekly cloud. Doing so would set up next week to confirm the move, which would start by needing to see a higher open on Monday/a higher intra-week high sometime next week vs. this week’s high/and a Friday close next week above today’s close. Seeing that ups the odds for a move to fill the gap just north of 4200, and could then potentially get more follow-through buying as shorts get squeezed out (simply adding to the buying scenario).
With yesterday seeing PLNT up on the day going into the close, we did NOT enter Thursday’s Daily Play trade. The idea is canceled.
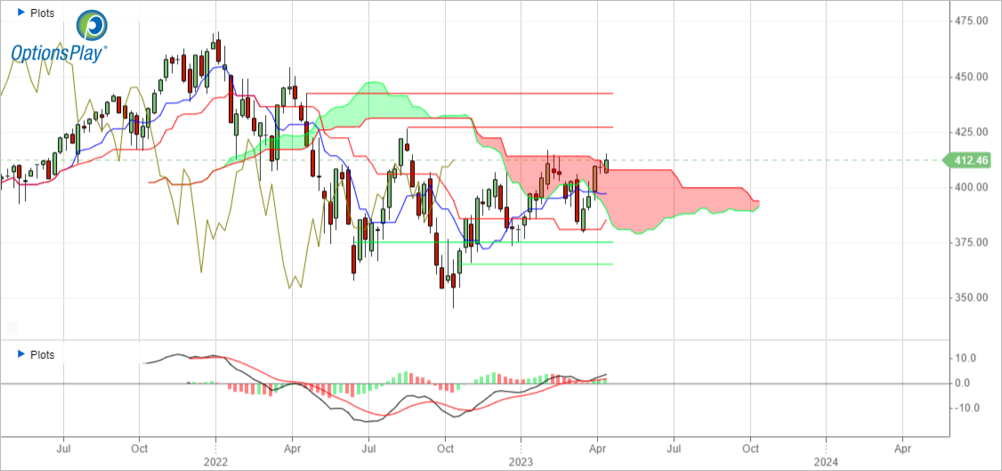
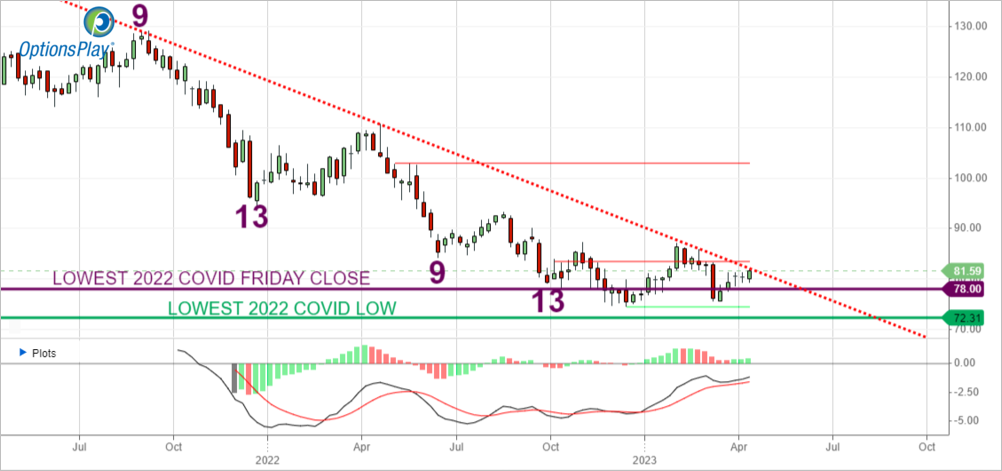
Here’s a new idea for today: Let’s get long the Medtronic (MDT) May 19th $82.5 call, which went out at $1.88 last night. (Based on the chart below, I would have bought the $82.5/$92.5 call spread, but selling that $92.5 only takes in 4 cents. It’s not worth it to cap the trade for that.) So, let’s just buy the call, given the trend line breakout against multiple prior lows.
MDT – Weekly
You know that I don’t like buying calls on a Friday, but if the SPX moves higher tomorrow, then I think it pays to lose the theta over the weekend and get long today.
$PLNT
DailyPlay – Closing Trades (ARCH, EBAY) Partial Closing Trade (BROS) – April 13, 2023
Closing Trades
- ARCH – 76.62% Loss: Buy to Close 3 Contracts (or 100% of your remaining Contracts) April 21st $135/$130 Put Vertical Spreads @ $3.45 Debit. DailyPlay Portfolio: By Closing the remaining 3 Contracts, we will pay $1,035. We partially closed this trade on April 11 when we closed 3 of the 6 contracts @ $3.15 Debit. Our average cost basis to exit this trade is therefore $3.30 Debit and our average loss on this trade is 68.94%.
- EBAY – 52.60% Loss: Sell to Close 3 Contracts (or 100% of your remaining Contracts) April 21st Call Vertical Spreads @ $0.91 Credit. DailyPlay Portfolio: By Closing the remaining 3 Contracts, we will receive $273. We partially closed this trade on April 4 when we closed 1 of the 6 contracts @ $2.14 Credit. Then again on April 11 when we closed 2 contracts @ $1.42 Credit. Our average cost basis to exit this trade is therefore $1.29 Credit and our average loss on this trade is 32.64%.
Partial Closing Trade
- BROS – 61.540% Gain: Buy to Close 5 Contracts (or 55% of your remaining Contracts) April 28th $30/$28 Put Vertical Spreads @ $0.30 Debit. DailyPlay Portfolio: By Closing 5 of the remaining 9 Contracts, we will be paying $150.
PLNT Bearish Opening Trade Signal
View PLNT Trade
Strategy Details
Strategy: Short Call Vertical Spread
Direction: Bearish
Details: Sell to Open 6 Contracts May 19th $77.50/$82.50 Call Vertical Spreads @ $2.00 Credit per contract.
Total Risk: his trade has a max risk of $1,800 (6 Contracts x $300) based on a hypothetical $100,000 portfolio risking 2%. We suggest using 2% of your portfolio value and divide it by $300 to select the # contracts for your portfolio.
Trend Continuation Signal: This stock is trading sideways to bearish, and we expect that it would not turn bullish over the duration of this trade.
1M/6M Trends: Neutral/Neutral
Technical Score: 9/10
OptionsPlay Score: 105
Condition: If the stock is trading lower at the end of today.
Entering the Trade
Use the following details to enter the trade on your trading platform. Please note that whenever there is a multi-leg option strategy, it should be entered as a single trade.

Please note that these prices are based on Wednesday’s closing prices. As this is a Conditional trade, the prices of this trade will be slightly different from what we list in this email.
Investment Rationale
Stocks see-sawed throughout most of yesterday’s session, but in the end, all four major US indexes fell, with the SPX down 17 pts. to 4092. The Nasdaq’s loss was its 6th in the past 7 sessions, and the Info Technology sector continues to underperform this month after having rocked higher in the first quarter. (I mentioned right at the start of this month that I believed that Tech would not hold up like it had vs. the SPX.)
I generally like to see a big data day like yesterday give us a better clue as to what we might expect over the short-term, but we didn’t get any real clarity to the next bigger move. With two trading days left for this week, a Friday close north of 4155 would likely lead to more gains – most especially if next week would also open higher on Monday/trade higher than this week’s high/close above this Friday’s close. A strong decline from today and tomorrow would be mildly bearish. Barring either of these two scenarios panning out, then we haven’t really learned much at all this week.
I don’t like the way both EBAY and ARCH are trading for our long spread positions. Let’s exit each of the last three spreads today in both names. Let’s also take off 5 of 9 BROS short put spreads as yesterday was the second time that the daily TDST line was the high in the past week.
BROS – Daily
Here’s a new idea on a consumer discretionary name that looks like it’s having trouble holding its recent rally. Planet Fitness (PLNT) just failed at its cloud, and it is just barely having its Lagging Line come out through the bottom of its cloud. A rally today would stop that Lagging Line break, but IF going into today’s close the stock is down on the day, let’s then sell a May 19th $77.5/$82.5 call spread. Yesterday this went out at $2, or 40% of the strike differential. It wouldn’t surprise me to see this get down to $71.50.
PLNT – Daily
$AKAM, $ADM, $CLX, $BROS
DailyPlay – Closing Trades (AKAM, ADM) Partial Closing Trades (CLX, BROS) – April 12, 2023
Closing Trades
- AKAM – 100% Gain: Sell to Close 2 Contracts (or 100% of your remaining Contracts) April 21st $75/$82.50 Call Vertical Spreads @ $5.45 Credit. DailyPlay Portfolio: By Closing the final 2 Contracts, we will receive $1,090. We partially closed this trade on March 29 when we closed 2 of the 4 contracts @ $2.68 Credit. Our average cost basis to exit this trade is therefore $4.07 Credit and our average gain on this trade is 49.27%.
- ADM – 92.63% Gain: Buy to Close 6 Contracts (or 100% of your remaining Contracts) April 21st $77.50/$75 Put Vertical Spreads @ $0.07 Debit. DailyPlay Portfolio: By Closing the final 6 Contracts, we will be paying $42. We partially closed this trade on March 30 when we closed 4 contracts @ $0.58 Debit, then again on April 4 when we closed 2 contracts @ $0.30 Debit, then on April 5 when we closed another 2 contracts @ $0.40 Debit. Our average cost basis to exit this trade is therefore $0.30 Debit and our average gain on this trade is 68.87%.
Partial Closing Trades
- CLX – 82.88% Loss: Sell to Close 3 Contracts (or 50% of your remaining Contracts) Apr 21st $155/$145 Put Vertical Spreads @ $0.50 Credit. DailyPlay Portfolio: By Closing 3 of the remaining 6 Contracts, we will receive $150. Please remember to close the final 3 Contracts, as described below.
- BROS – 64.10% Gain: Buy to Close 3 Contracts (or 25% of your Contracts) April 28th $30/$28 Put Vertical Spreads @ $0.28 Debit. DailyPlay Portfolio: By Closing 3 of the remaining 12 Contracts, we will be paying $84.
Investment Rationale
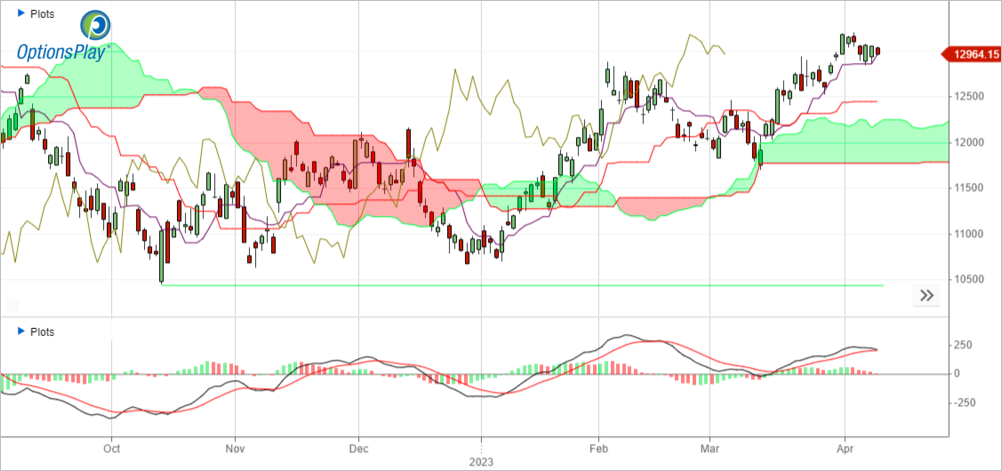
As traders were awaiting today’s CPI number and FOMC minutes, they were pretty sleep on Tuesday, as the SPX closed flat on the day, the NDX closed down again (that’s 5 of the last 6 sessions), and the Dow finished up by 30 bps. If you’re a bull, at least the NDX has traded and held the daily Conversion Line (in magenta) for the past three days.
NDX – Daily
With those key economic data points coming out today, I’m not going to put a new trade on this morning. (I like to put trades on when I think we have an edge, and there’s no way we can know which way to play today until both CPI (8:30am ET) and the FOMC minutes (2pm ET) are released.
I do want to exit the CLX trade – not because its price has moved well away from us – but because too much time is passing and expiration is coming closer and closer (i.e., a week from Friday) without it getting itself into-the-money. Personally, what I would do is exit 3 of the 6 this morning, and unless the market is getting sharply knocked to the downside after the FOMC figures come out, exit the other 3 by the close. (As of yesterday’s close, we are down 83% on these remaining 6 contracts.
But with bad comes some good: Our long AKAM call spread is up 100% on the last two we have on. Let’s take that off today and pocket that solid gain.
We are also having a good time of it with our short ADM put spread. With 10 days to go, we are up 93%. Let’s say goodbye to that trade today, too.
We are also up 64% on our short BROS put spread, expiring in 17 days. We’ve got 12 of these on, so let’s cut that down to 9 today. Moreover, should we see the stock trade up to $35.50 +/- 30 cents any day this week, take another 2 more off.
Lastly, our OP team generally marks the pricing of our “cost basis” in the portfolio from option prices at about 10am ET each day. You may or may not have that price as your actual debit paid or credit received on any given trade. It all depends what time of day you actually put the trade on. So, I use it as a guide for my follow-up recommendations, but you may have a better or worse price that you are really working with.