$TLT

DailyPlay – Closing Trade (TLT) – February 6, 2023
Closing Trade
- TLT – 97.84% Gain: Buy to Close 1 Contract (or 100% of your remaining Contracts) Feb 17th $100/$95 Put Vertical Spread @ $0.04 Debit. DailyPlay Portfolio: By Closing the remaining 1 Contract, we will be paying $4. We partially closed this trade on Jan 9 when we closed 2 Contracts at $0.66 Debit, then on Jan 17 when we closed 1 Contract at $0.39 Debit, on Jan 31 we closed 1 Contract at $0.16 Debit. Our average cost basis for this trade is therefore $0.38 Debit and our average gain on this trade is 79.35%.
Investment Rationale
Stocks sold off on Friday as the large jobs numbers don’t gel with the Fed’s goal of slowing the economy. Technically, the SPX reached above the 4148 bullish weekly Propulsion Momentum level last week but then closed beneath there. Along with several other things I’m looking (i.e., bullish sentiment having reached as high as 66% bulls last Thursday; UST 10-yr. bond rates again having held above the weekly 3.50% Base Line level after being under 3.4% a day earlier; the and DXY marking a new low last week before rallying sharply on Friday above its downtrend line), I’m looking for the recent rally in the SPX to give back as much as 5% in the near-term to target ~3900 to 3850.
I want to exit our last remaining TLT short Feb. 17th $100/$95 put spread today, up 98%.
We will stay short the ABBV put spread because I think that Health Care stocks will hold up better during this possible decline (as will any classic defensive sector). Our UNG short is against us, but I think the almost 5 weeks we have till expiration should be enough time for natgas to see a decent trading bounce take place.
$SLV, $SPOT
DailyPlay – Closing Trades (SLV, SPOT) – February 3, 2023
Closing Trades
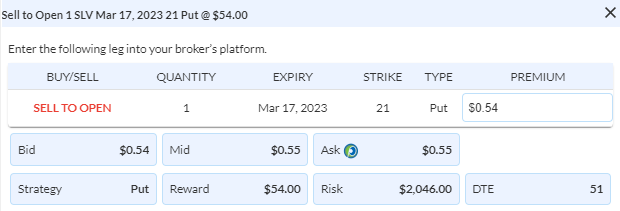
- SLV – 3.64% Gain: Buy to Close 1 Contract (or 100% of your remaining contracts) March 17th $21 Cash Secured Put @ $0.53 Debit. DailyPlay Portfolio: By Closing the 1 Contract, we will be paying $53.
- SPOT – 200.63% Gain: Sell to Close 1 Contract (or 100% of your remaining contracts) Feb 17th $90/$110 Call Vertical Spread @ $19.00 Credit. DailyPlay Portfolio: By Closing the remaining 1 of 3 Contracts, we will be receiving $1900. We Partially Closed this trade on Jan 18 at $6.45 Credit and then again on Jan 31 at $9.72 Credit. Our average cost basis to exit this trade is therefore $11.72 Credit, and our average gain is 85.5%.
Investment Rationale
Equities again moved higher on Thursday after the huge META report and Zuckerberg comments. However, S&P futures are down about 50 bps. as I write this late night after several large cap names reported earnings.
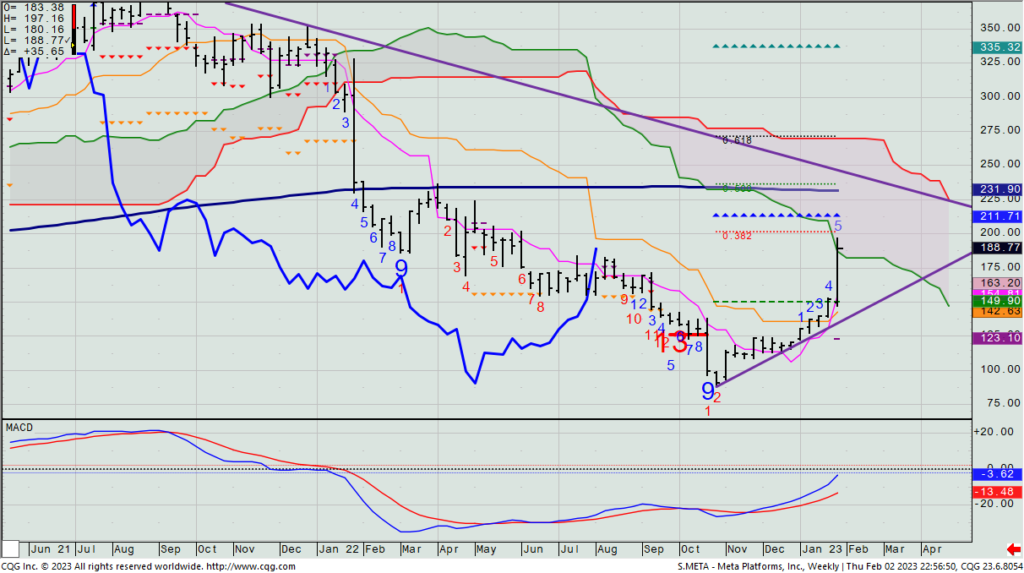
Today is another weekly options expiration, including a position we have open in the Feb.3rd short META $123/$113 put spread. The last spread we have on will go out with the full 100% capture of the premium received, and we did nicely on this one. (Many of you who listen to my Option Play webinars know that I personally bought META on the day it made the secular low last year. Under $89. I sold half yesterday precisely $100 above my entry point, as there is some potential resistance up here from the weekly cloud chart; the 38% Fibo retracement level at $201; and then the Propulsion Exhaustion level at ~$212. I choose not to be a pig.)
META – Weekly
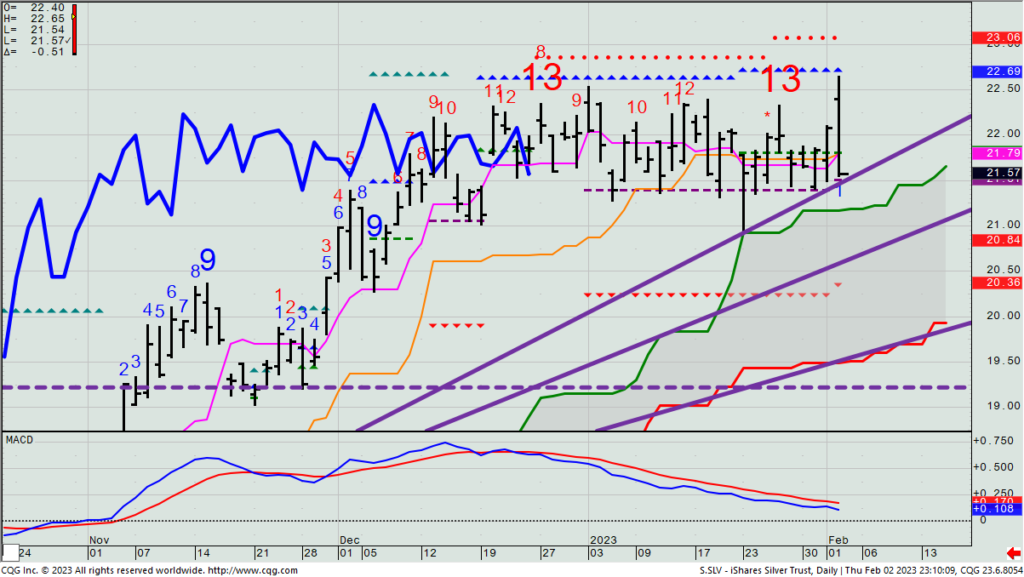
Yesterday, the price of silver jumped > $1 (~4%) before giving back everything to close unchanged on the day. The SLV ETF closed down about 50 cents (~2.5%) and is now pennies beneath where we first put on the March 17th short $21 put spread. Despite the SLV’s trendline still holding as support, I’m not loving its price action, so I am going to recommend we get out today, and look for another opportunity to be bullish this or gold in coming weeks at a better price.
SLV – Daily
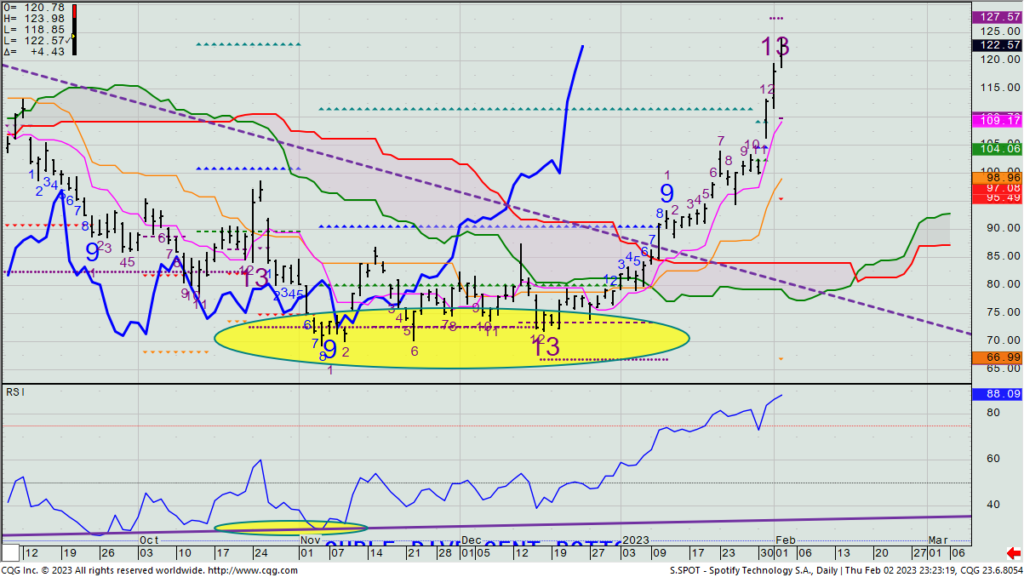
Let’s also now remove the SPOT Feb. 17th $90/$110 call spread we have on. We are up 200% on the last spread and it’s facing resistance on both the daily and weekly charts.
SPOT – Daily
$ABBV

DailyPlay – Opening Trade (ABBV) – February 2, 2023
ABBV Bullish Opening Trades
View ABBV Trade
Strategy Details
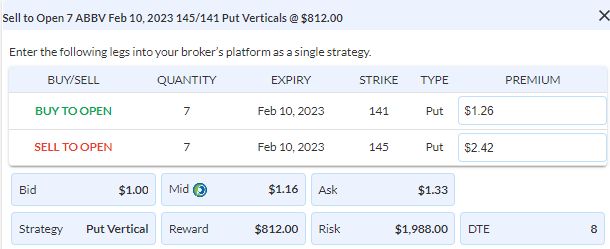
Strategy: Short Put Vertical Spread
Direction: Bullish
Details: Sell to Open 7 Contracts Feb 10th $145/$141 Put Vertical Spreads @ $1.16 Credit per contract.
Total Risk: This trade has a max risk of $1,988 (7 Contracts x $284).
Counter Trend Signal: This is a Bullish trade on a stock that is experiencing a bearish trend.
1M/6M Trends: Bearish/Bearish
Technical Score: 3/10
OptionsPlay Score: 88
Entering the Trade
Use the following details to enter the trade on your trading platform. Please note that whenever there is a multi-leg option strategy, it should be entered as a single trade.
Please note that these prices are based on yesterday’s closing prices. Should the underlying move significantly during the pre-market hours, we will likely adjust the strikes and prices to reflect a more accurate trade entry.
Investment Rationale
The Fed spoke, and it wasn’t that they particularly said bullish comments to make the market turnaround from a 1% loss to over a 1% gain. But it was the lack of any semblance of remarks similar to what Powell said in August at the Jackson Hole meeting that gave bears reason to cover shorts and bulls to put some money to work. (I still hear from trading desks that the bulk of buying is coming from shorts covering than it is from real new money coming in. They say that mutual fund PMs are still net sellers into this strength.) That should give you some reason not to be overzealous.
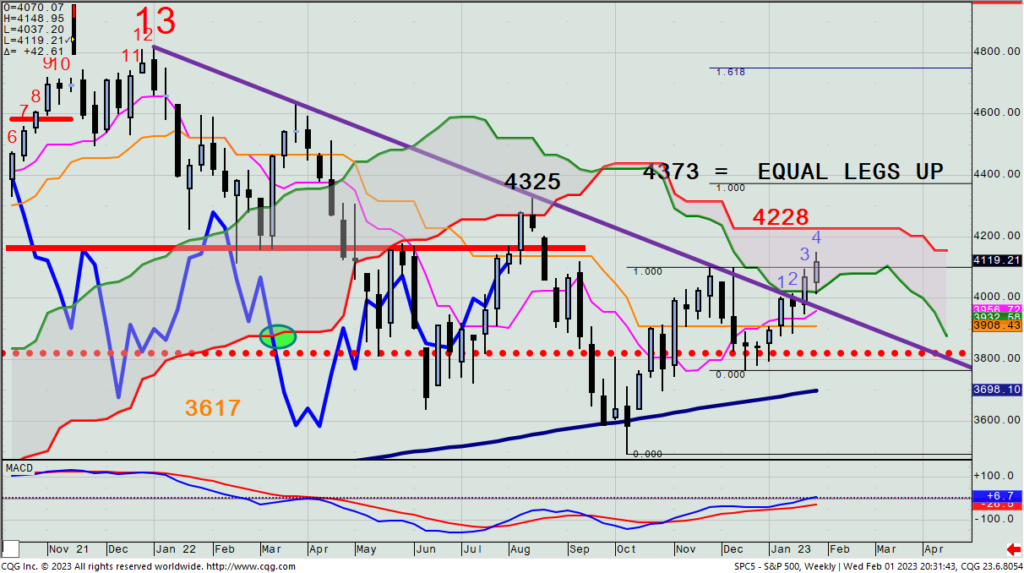
I can make the case that there’s still more upside to go, and we possibly see the SPX test the weekly cloud high at 4228, or even the August high near 4325. If it gets above the latter, I will likely start selling stocks again, as that move would almost assuredly drag out all previous shorts (i.e., actually increasing the odds that the upmove won’t have much more to go).
SPX – Weekly
Here’s an idea for a new trade that is very tactical in nature, and is playing that between now and earnings on the morning of Feb. 9th (giving us a max. of 6 days to hold the position (unless it surprisingly materially rallies between now and then, which would then potentially give us a reason to hold through the earnings report).
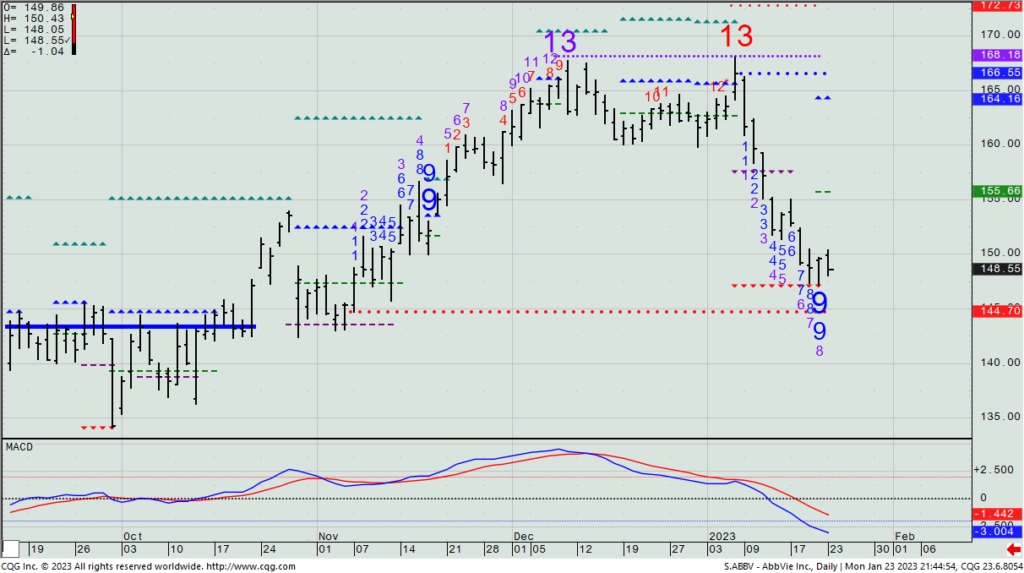
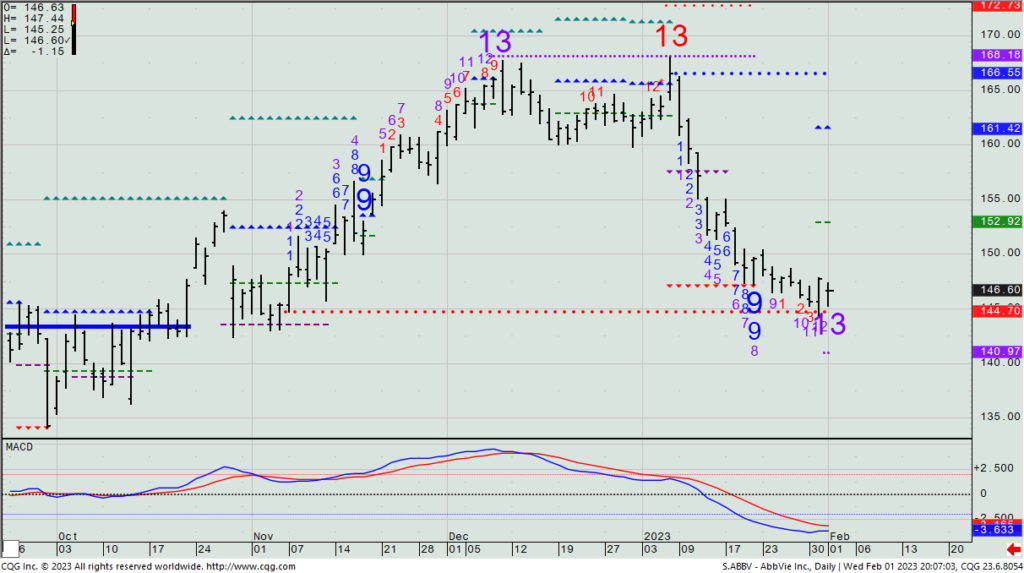
Let’s look at the daily chart of ABBV, a stock that we recently made very good money on when we were long a $160/$145 put spread. With it continually holding right around that $145 support level and then yesterday marking an Aggressive Combo -13 signal, I’d think that this will not materially decline before that 2/9 report, giving us the chance to make some money by collecting downside premium.
ABBV – Daily
As such, let’s look to sell a Feb. 10th $145/$141 put spread. It’s slightly out of the money, and only collects 29% of the spread differential ($1.165 as of yesterday’s closing mid price). Though this is not what I’d normally be willing to accept on a credit put spread, buying calls could easily see time pass to not accomplish the goal of us making money. (BTW- the $146/$152.50 call spread cost 39+ percent, so they’re definitely no bargain, either.)

DailyPlay Updates – February 1, 2023
Buyers came right back in on Tuesday, negating Monday’s decline after some earnings numbers gave them enthusiasm. For us, that was mostly a good thing, as all off yesterday’s Daily Play ideas were to lighten exposure either yesterday or today before the Fed’s announcements.
Today is both a key earnings day; economic reports day; and, of course, the all-important FOMC rate announcement and press conference. This should easily set the stage for the near-term market movement – certainly through the Feb. 14th CPI figure – but very possibly well beyond. As a habit, I typically lighten all trading exposure into such a key potentially large market moving event. (In fact, here’s the link to a video I just created yesterday for my own In The Know Trader YouTube channel that addresses how to handle this very issue: https://youtu.be/RwoSTXjsZNc. I really suggest you watch it.)
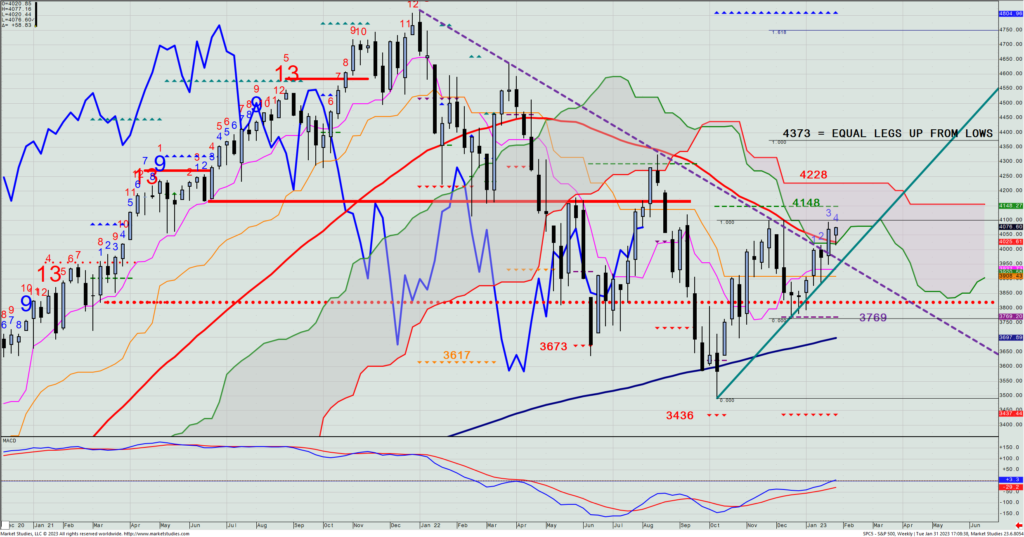
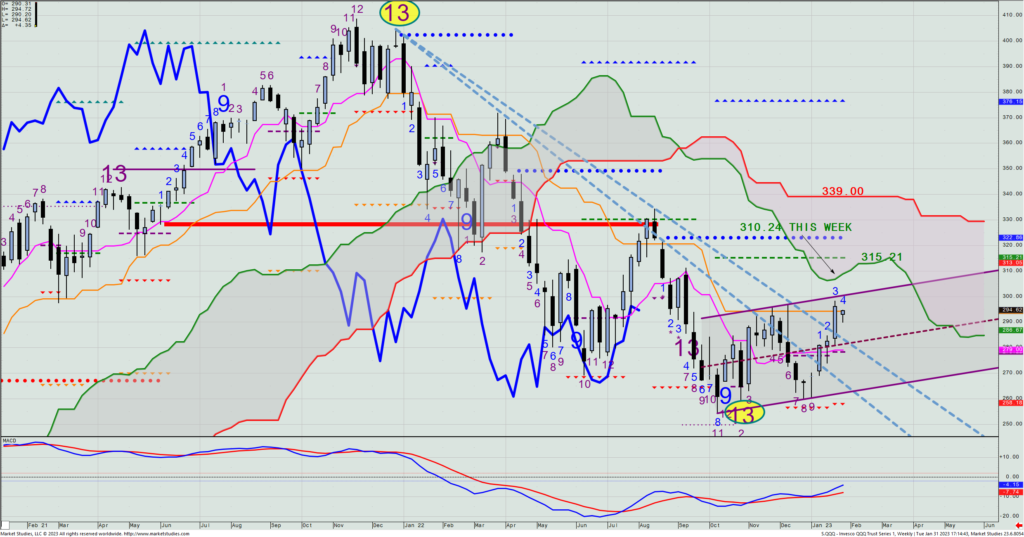
Here’s the look at both the weekly SPX and QQQ charts. They certainly have a much better look than we’ve seen in a while, but they both have overhead resistance to deal with to improve its medium-term picture. I remain in the camp that this year might very well be one that really messes with investors’ heads (for that matter, traders’, too) by which when you’re finally convinced that the market must be headed higher, it’s in the 9th inning of the rally. And when and if you’re convinced that selling is the right thing to do because the market has broken down, it could very well also be in the 9th inning of that decline. It may, actually, end up becoming the perfect year for counter-trend trading. We’ll have a better clue by week’s end.
SPX – Weekly
QQQ – Weekly
$META, $TLT, $SPOT, $XLF, $JNJ
DailyPlay – Partial Closing Trades (META, TLT, SPOT, XLF, JNJ) – January 31, 2023
Partial Closing Trades
- META – 87.90% Gain: Buy to Close 1 Contract (or 50% of your remaining Contracts) Feb 3rd $123/$113 Put Vertical Spread @ $0.45 Debit. DailyPlay Portfolio: By Closing 1 of the remaining 2 Contracts, we will be paying $45.
- TLT – 91.35% Gain: Buy to Close 1 Contract (or 50% of your remaining Contracts) Feb 17th $100/$95 Put Vertical Spread @ $0.16 Debit. DailyPlay Portfolio: By Closing 1 of the remaining 2 Contracts, we will be paying $16.
- SPOT – 53.80% Gain: Sell to Close 1 Contract (or 50% of your remaining Contracts) Feb 17th $90/$110 Call Vertical Spread @ $9.72 Credit. DailyPlay Portfolio: By Closing 1 of the remaining 2 Contracts, we will be receiving $972.
- XLF – 38.74% Loss: Sell to Close 9 Contracts (or a third of your remaining Contracts) Mar 3rd $35.5/$32.5 Put Vertical Spreads @ $0.41 Credit. DailyPlay Portfolio: By Closing 9 of the 26 Contracts, we will be receiving $369.
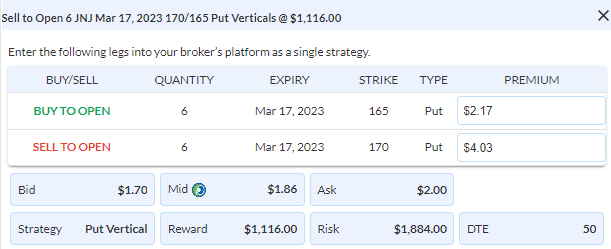
- JNJ – 78.79% Loss: Buy to Close 3 Contracts (or 50% of your remaining Contracts) Mar 17th $170/$165 Put Vertical Spreads @ $3.54 Debit. DailyPlay Portfolio: By Closing 3 of the 6 Contracts, we will be paying $1,062.
Investment Rationale
Profit-taking was clearly at play yesterday, as traders were locking in profits from the recent run-up before Wednesday’s FOMC announcement. For one of the very few times this year (or maybe even the first; I’m not sure), Staples led daily sector performance. (They were actually higher yesterday – the only sector up on the day while the SPX lost 1.3%.)
As I mentioned in Monday’s weekly outlook webinar, I am not looking to put on new equity positions before we see what transpires on Wednesday after the Fed press conference. Doing so would not only suggest that I can guesstimate what the Fed will say, but then also how investors will react to his press conference words and tone. That’s more than I care to prognosticate with my own money – let alone yours.
But yesterday’s decline does show how easily the market can come off when it wants to. Bulls aren’t going to buy more until they feel that it’s the right zone to do so. I don’t think it’s likely as easy as it just seeing a pullback to the broken downtrend line, for it that’s all it is, then yesterday already achieved that objective.
SPX – Daily
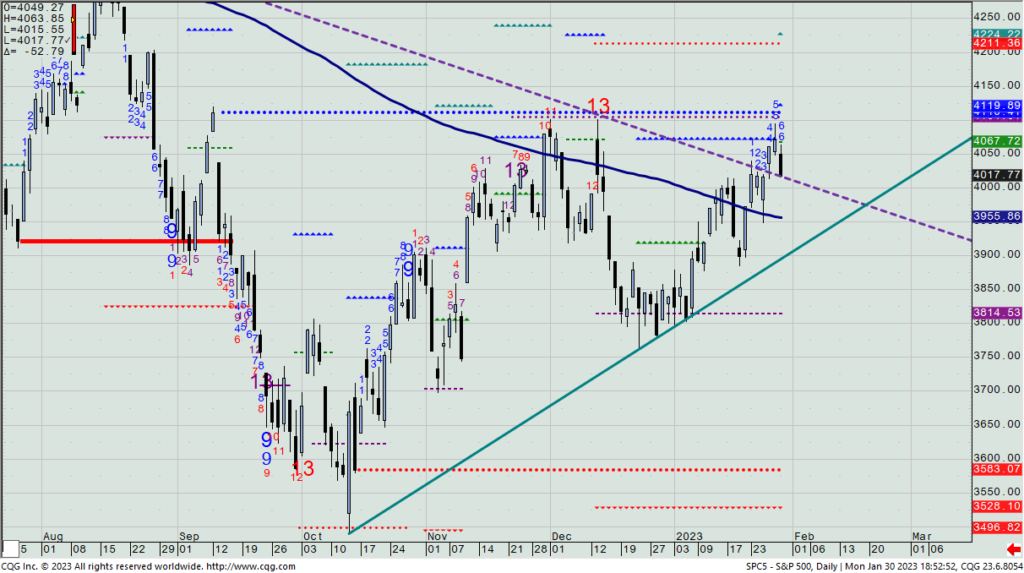
Now, an up-close today above Friday’s close that gets follow-through on Wednesday is potentially another bullish signal that would next target over 4200. Or a down close today that sees a close above last Friday’s high on Wednesday and follow-through on Thursday, also targets that same move to north of 4200 (though a possible Setup +9 count on Thursday could call for a pause and refresh first.
Let’s update some positions:
- META: We are still short 2 Feb 3rd $123/$113 put spread. They report tomorrow after the close. Let’s take one spread off either today or tomorrow (pre-Fed) and we’ll let the last one go through earnings, as we have a large cushion before being exercised.
- TLT: We’re still short 2 Feb. 17th $100/$95 put spreads, up 91%. Let’s get out of one of these today or tomorrow (pre-Fed) as 10-yr. rates continue to hold key support at the weekly Base Line (which this week has moved up to 3.50% (from 3.43%)
- SPOT: We’re still long 2 Feb 17th $90/$110 call spreads, up 54%. Let’s get out of one of these today or tomorrow (pre-Fed).
- XLF: We’re long 26 Mar. 3rd $35.5/$32.5 put spreads, down 29%. Let’s exit 9 of those today or tomorrow (pre-Fed).
- JNJ: We’re short 6 Mar. 17th $170/$165 put spreads. Yesterday’s news with a court not letting JNJ send some 38K talc-related lawsuits into a special bankruptcy situation sent the stock into a tailspin, breaking major support. Our position plunged to a 78% loss in a flash. I have no choice but to sell out of half of these now. JNJ’s intention to appeal this will very not likely be back in court before this expiration date. Now it’s about managing the loss.
$UNG
DailyPlay – Opening Trade (UNG) – January 30, 2023
UNG Bullish Opening Trades
View UNG Trade
Strategy Details
Strategy: Long Call Vertical Spread
Direction: Bullish
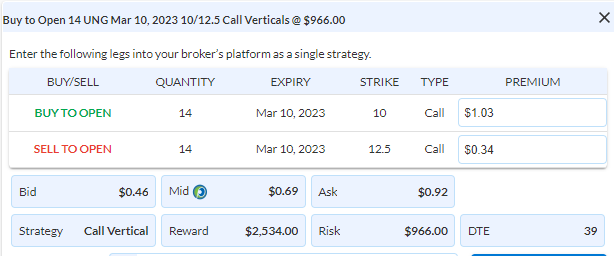
Details: Buy to Open 14 Contracts March 10th $10/$12.50 Call Vertical Spread @ $0.69 Debit per contract.
Total Risk: This trade has a max risk of $966 (14 Contracts x $69).
Counter Trend Signal: This is a Bullish trade on a stock that is experiencing a bearish trend.
1M/6M Trends: Bearish/Bearish
Technical Score: 1/10
OptionsPlay Score: 108
Entering the Trade
Use the following details to enter the trade on your trading platform. Please note that whenever there is a multi-leg option strategy, it should be entered as a single trade.
Please note that these prices are based on Friday’s closing prices. Should the underlying move significantly during the pre-market hours, we will likely adjust the strikes and prices to reflect a more accurate trade entry.
Investment Rationale
Stocks continue their upward ways, now just a few days from the all-important Fed meeting on Wednesday. Investors will be closely watching and listening to Jay Powell’s words, both for content and tonality. This Fed statement – along with the employment report on Friday and the slew of major firms reporting earnings this week – will set the tone for how the market trades up to and even possibly through the next monthly CPI figure on Feb.14th.
I don’t expect much fireworks this week till the Wednesday announcement, so don’t look to over trade or push the envelope on trades before then. I’ll likely use tomorrow and Wednesday morn to lighten some of our bullish positions into the number.
I do have a new idea for today, and because it’s in the commodity arena, I don’t expect for the Wednesday party to influence this trade. Natural gas has gotten completely obliterated in the past several months, as a way warmer than normal winter has been at hand in the US as well as commodity funds having been caught too long from 2022’s rally. (Just as an example, total snow accumulation in NYC has been less than 1” this winter, and it’s typically averaged 25” by this time of the year.) Temps here have hit 50 degrees here several times in recent weeks. Natural Gas demand has been reduced as one hasn’t needed to heat their homes to the degree as one normally would.
Natural Gas Futures – Weekly
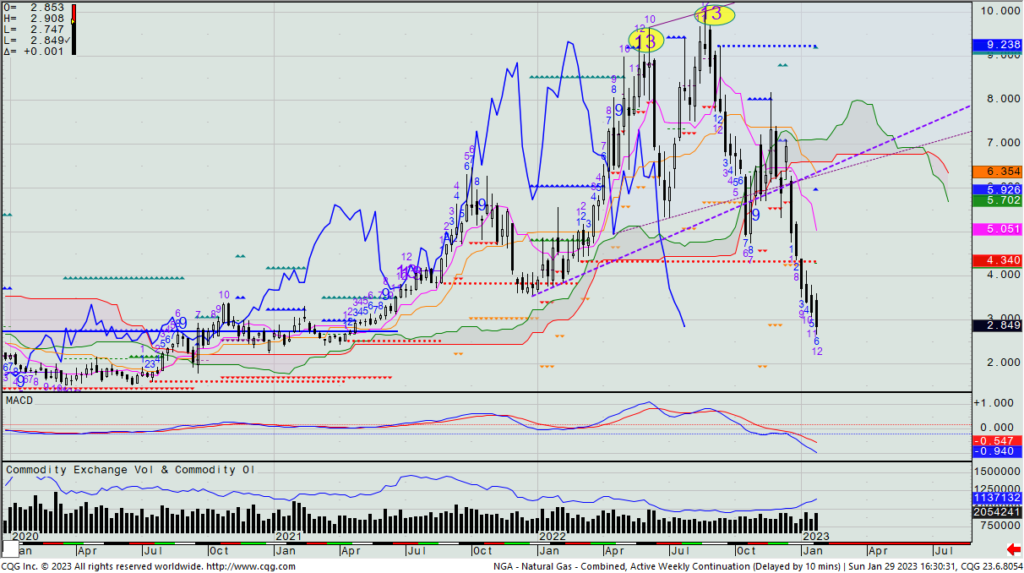
However, this week could very well mark the first Aggressive Combo -13 signal of the entire decline, and it was this same signal that marked both major highs last year. Although the associated ETF UNG doesn’t exactly match the price movement of front-month Natgas, we can look to start building into a long position this week.
I can see doing this in two separate ways, or possibly in a combination of both. Using options, you can buy a 1% position in the UNG March 10th $10/$12.5 call spread. It closed at 69 cents mid on Friday – a fairly priced 28% of the strike differential. Alternatively, you can look to buy a 1% position in the stock itself. Or thirdly, you can do a combination of both to give yourself a standard 2% bullish position.
DailyPlay Update – January 27, 2023
Investment Rationale
Buyers have been dominating January equity activity, and yesterday was no different; the SPX marked its best close since early December. Energy and Consumer Discretionary were the leading sectors, while Health Care and Staples were the worst, with the latter actually closing lower on the day.
Next Wednesday is the FOMC rate change and press conference. Bulls are thinking that they can influence the Fed and push them to halt the rate raises. I don’t think that is gonna work, nor is an equity rally what Chair Powell likely has in mind to reduce the quantitative tightening he’s in the midst of doing.
Today is a weekly option expiration, with the SPY 410 strike having the largest call open interest and the 390 strike having the largest put open interest (and twice that of the 410 calls). With the SPY having closed at $404.75 yesterday, the 410s are far closer and might possibly act as a magnet today. The second most put open interest expiring today is in the 395 strike, so that would only come into play on an approximate 100-pt. SPX decline.
As a heads up, I will probably be reducing long exposure before next Wednesday’s rate announcement, likely using Tuesday and Wednesday to do so.
$JNJ
DailyPlay – Opening Trade (JNJ) – January 26, 2023
JNJ Bullish Opening Trades
View JNJ Trade
Strategy Details
Strategy: Short Put Vertical Spread
Direction: Bullish
Details: Sell to Open 6 Contracts March 17th $170/$165 Put Vertical Spreads @ $1.86 Credit per contract.
Total Risk: This trade has a max risk of $1,884 (6 Contracts x $314).
Counter Trend Signal: This is a Bullish trade on a stock that is experiencing a bearish trend.
1M/6M Trends: Bearish/Bearish
Technical Score: 3/10
OptionsPlay Score: 92
Entering the Trade
Use the following details to enter the trade on your trading platform. Please note that whenever there is a multi-leg option strategy, it should be entered as a single trade.
Investment Rationale
Stocks started off well lower on Wednesday from MSFT and TXN forward guidance concerns. They slowly climbed back to near breakeven by 3pm, and ended up closing mixed with negligible gains and losses. Sector leadership came from Financials and Consumer Discretionary while Utilities and Industrials were the biggest losers.
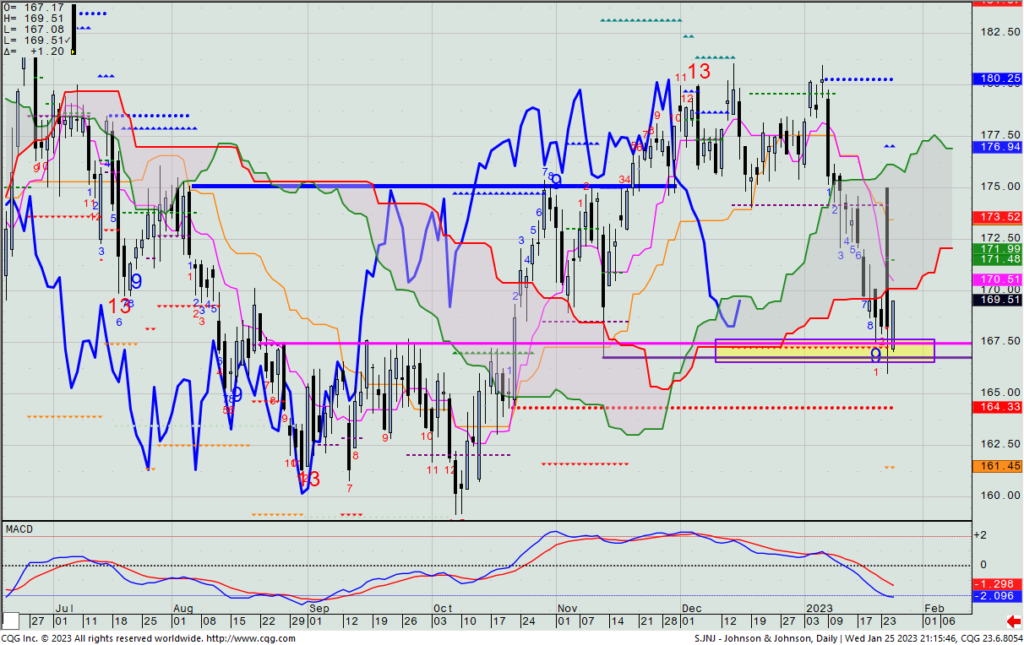
Now that earnings are out, the weekly chart of JNJ looks interesting on the long side. It has held key support (highlighted) at $167, and it was accompanied by a Setup -9, too. As such, let’s look to short the $JNJ Mar. 17th $170/$165 put spread. (Yesterday, this went out at $1.85 mid, and it represents a credit of 37% of the strike differential, and it is the only option strike combo using the ATM one that is close to being fairly priced. (Calls are silly expensive and puts are relatively cheap to sell.) Alternatively, if you are so inclined, you could consider buying the stock outright (given the very clear support level still holding.
JNJ – Daily
$SLV
DailyPlay – Opening Trade (SLV) – January 25, 2023
SLV Bullish Opening Trades
View SLV Trade
Strategy Details
Strategy: Cash Secured Put
Direction: Bullish
Details: Sell to Open 1 Contract March 17th $21 Cash Secured Put @ $0.55 Credit.
Total Risk: This trade has a max risk of $2,046 (1 Contract x $2,046).
Trend Continuation Signal: This is a Bullish trade on a stock that is experiencing a neutral to bullish trend.
1M/6M Trends: Neutral/Bullish
Technical Score: 9/10
OptionsPlay Score: N/A
Entering the Trade
Use the following details to enter the trade on your trading platform. Please note that whenever there is a multi-leg option strategy, it should be entered as a single trade.
Investment Rationale
Stocks were mixed on Tuesday with the Dow higher, but the SPX and Nasdaq were marginally lower. After the bell, we got MSFT and TXN earnings, and after initially seeing the former rally 4%, it ended up giving back all those gains, and then some, after the conference call. As I write this, the S&P futures are down 45 bps. and the NDX 75 bps.
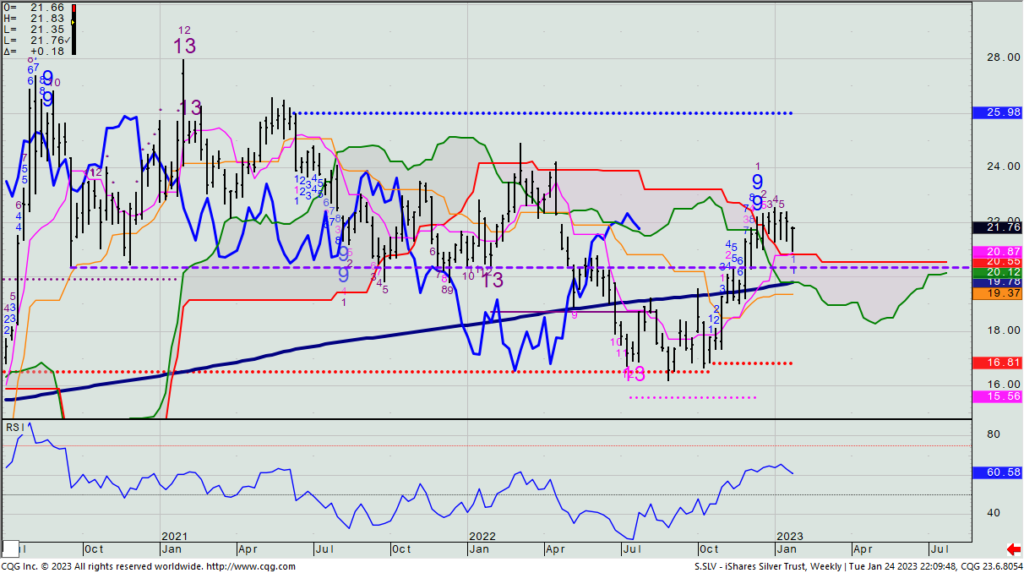
You know that I am bullish the precious metals, and I noticed that last week the iShares Silver Trust (SLV) sold down to its weekly cloud model and immediately bounced. I think that low is a good trading low, and as such, I will propose the following to get long exposure: sell Cash Secured SLV Mar. 17th $21 Puts. Yesterday, this strike closed at $0.545 mid, meaning you’d receive a credit of $54.50 for each put you’d like to sell, with the understanding that you’d be a willing buyer of SLV if exercised. Given my belief that both gold and silver will be higher down the road, consider this as a way of getting long silver at a discounted price if exercised OR simply collecting the premium if not exercised. Notice the top of the cloud remains pretty flat for the entire first half of the year.
SLV – Weekly
$ABBV
DailyPlay – Closing Trade (ABBV) – January 24, 2023
Closing Trade
- ABBV – 139.43% Gain: Sell to Close 1 Contract (or the remainder of your positions) Feb 17th $160/$145 Put Vertical Spreads @ $9.17 Credit. DailyPlay Portfolio: By Closing the remaining 1 Contract, we will be receiving $917. We took partial profit on this trade on Jan 13 when we Closed 3 Contracts at @6.68 Credit per Contract and then again on Jan 17 when we Closed 1 Contract at $6.28 Credit. Our average cost to exit this trade is therefore $7.10 Credit per Contract, and our average gain on this trade is 85.33%.
Investment Rationale
Stocks finally got the lift that bulls have been hoping for, pushing up and through the SPX’s major downtrend line from all-time highs. This is a good thing for longs and the general tactical bullish call we’ve had this year. Does it have more to go? Very possibly, BUT, the Fed rate hike and press conference on 2/1 could very possibly change the game, especially if the market continues to rally from now till then. Remember: The Fed does NOT want to see asset prices rallying while they are demonstrably trying to cool inflation. The higher stocks now go, the more likely we hear even more hawkish words from Jay Powell and gang on Feb. 1. (They are in their quiet period now so you will not hear anything between now and the rate announcement.)
We’re still long one ABBV Feb 17th $160/$145 put spread that we’ve played very well. Any daily close that’s now above the close from four days prior (so today, if above $149.20, last Wednesday’s close) going into the close, we will exit the remaining position. The stock has made a daily Setup -9 count right at its daily Propulsion Exhaustion level.
ABBV – Daily