
$PANW

DailyPlay – Conditional Opening Trade (PANW) – January 23, 2023
PANW Conditional Bullish Opening Trades
View PANW Trade
Strategy Details
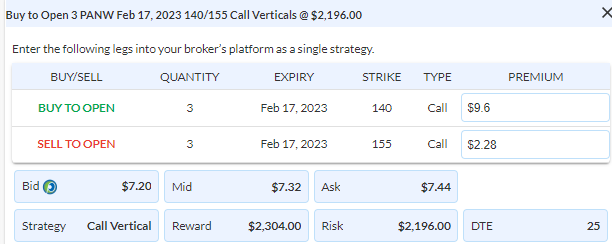
Strategy: Long Call Vertical Spread
Direction: Bullish
Details: Buy to Open 3 Contracts Feb 17th $140/$155 Call Vertical Spread @ $7.32 Debit per contract.
Total Risk: This trade has a max risk of $2,196 (3 Contracts x $732).
Counter Trend Signal: This is a Bullish trade on a stock that is experiencing a neutral to bearish trend.
1M/6M Trends: Neutral/Bearish
Technical Score: 2/10
OptionsPlay Score: 91
Entering the Trade
Use the following details to enter the trade on your trading platform. Please note that whenever there is a multi-leg option strategy, it should be entered as a single trade.
Please note that this is a Conditional trade. The condition that has to be met, before you enter this bullish trade is if we see any minor pullback to the $140 area. Therefore, the price for this trade will be different than what we are showing here, which is only acting as a guideline.
Investment Rationale
Stocks surged on Friday but again, the SPX closed just beneath its major downtrend line. What a hurdle that has been for bulls to be able to push above. Meanwhile, UST 10yr. yields again held support at its weekly Base Line at 3.42%. To me, that is still the key level to use to determine if rates hold or break further down to 3%. As per a new trade idea for today, I’m looking at Palo Alto Networks, a premier name in the cybersecurity space. Like so many other tech stocks, the past year+ has been painful for stockholders.
PANW – Daily
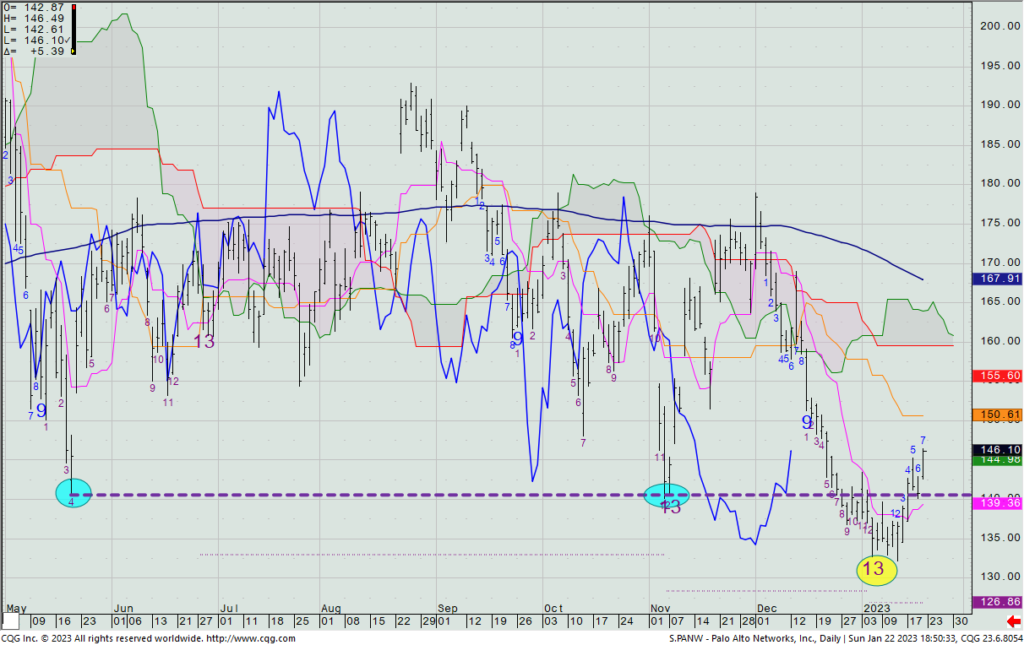
What I like is that price is back above its May and November lows, where it had previously double-bottomed before hitting sell-stops beneath $140 late last year and into early January. Now that it’s back above there, I’m looking to get long on any minor pullback to the $140 area — especially if it occurs by Wednesday’s close this week. If it does, let’s look to buy a Feb. 17th $140/$155 call spread at what then is its then current mid-price. Right now, calls are somewhat expensive, and puts are too cheap to sell, but an orderly pullback in price may help make the calls a bit cheaper. PANW reports on Feb. 21st, so we won’t be paying the extra premium for that report by using the 2/17 expiration.
$GLD
DailyPlay – Conditional Opening Trades (GLD) Partial Closing Trades (MDT, META, SPY, TLT, ABBV) – January 17, 2023
Partial Closing Trades
- MDT – 44.33% Loss: Sell to Close 1 Contract (or 25% of the remaining position) Jan 20th $80/87.5 Call Vertical Spread @ $1.13 Credit. DailyPlay Portfolio: By Closing 1 of the remaining 4 Contracts, we will be receiving $113.
- META – 52.68% Gain: Buy to Close 1 Contract (or 33% of the remaining position) Feb 3rd $123/$113 Put Vertical Spread @ $1.76 Debit. DailyPlay Portfolio: By Closing 1 of the 3 Contracts, we will be paying $176.
- SPY – 40.76% Gain: Sell to Close 1 Contract (or 33% of the remaining position) Feb 10th $387/$405 Call Vertical Spread @ $11.12 Credit. DailyPlay Portfolio: By Closing 1 of the 3 Contracts, we will be receiving $1,112.
- TLT – 78.92% Gain: Buy to Close 1 Contract (or 25% of the remaining position) Feb 17th $100/$95 Put Vertical Spread @ $0.39 Debit. DailyPlay Portfolio: By Closing 1 of the remaining 4 Contracts, we will be paying $39.
- ABBV – 63.97% Gain: Sell to Close 1 Contract (or 50% of the remaining position) Feb 17th $160/$145 Put Vertical Spread @ $6.28 Credit. DailyPlay Portfolio: By Closing 1 of the remaining 2 Contracts, we will be receiving $628.
GLD Conditional Bullish Opening Trades
GLD Conditional Trade 1
View GLD Trade 1
Strategy Details
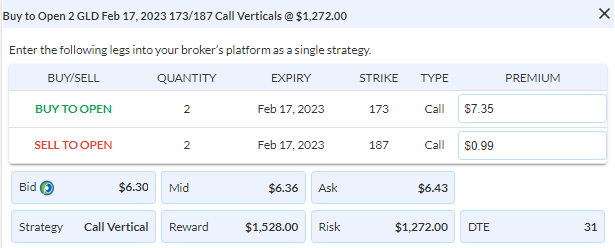
Strategy: Long Call Vertical Spread
Direction: Bullish
Details: Buy to Open 2 Contracts Feb 17th $173/$187 Call Vertical Spread @ $6.36 Debit.
Total Risk: This trade has a max risk of $1,272 (2 Contracts x $636).
Trend Continuation Signal: This is a Bullish trade on a stock that is experiencing a bullish trend.
1M/6M Trends: Bullish/Bullish
Technical Score: 8/10
OptionsPlay Score: 106
Entering the Trade
Use the following details to enter the trade on your trading platform. Please note that if there is a multi-leg option strategy, it should be entered as a single trade.
Please note that this is a Conditional trade. The condition that has to be met, before you enter this bullish trade is if we see a pullback to $173. Therefore, the Debit for this trade will be different than what we are showing here, which is only acting as a guideline.
GLD Conditional Trade 2
View GLD Trade 2
Strategy Details
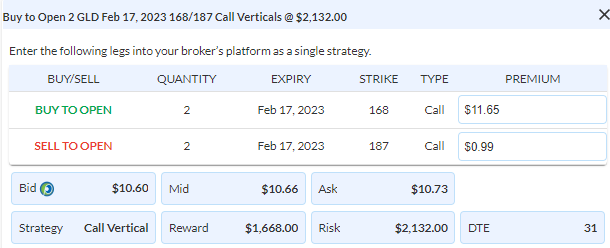
Strategy: Long Call Vertical Spread
Direction: Bullish
Details: Buy to Open 2 Contracts Feb 17th $168/$187 Call Vertical Spread @ $10.66 Debit.
Total Risk: This trade has a max risk of $2,132 (2 Contracts x $1,066).
Trend Continuation Signal: This is a Bullish trade on a stock that is experiencing a bullish trend.
1M/6M Trends: Bullish/Bullish
Technical Score: 8/10
OptionsPlay Score: 108
Entering the Trade
Use the following details to enter the trade on your trading platform. Please note that if there is a multi-leg option strategy, it should be entered as a single trade.
Please note that this is a Conditional trade. The condition that has to be met, before you enter this bullish trade is if we see a pullback to $168. Therefore, the Debit for this trade will be different than what we are showing here, which is only acting as a guideline.
Investment Rationale
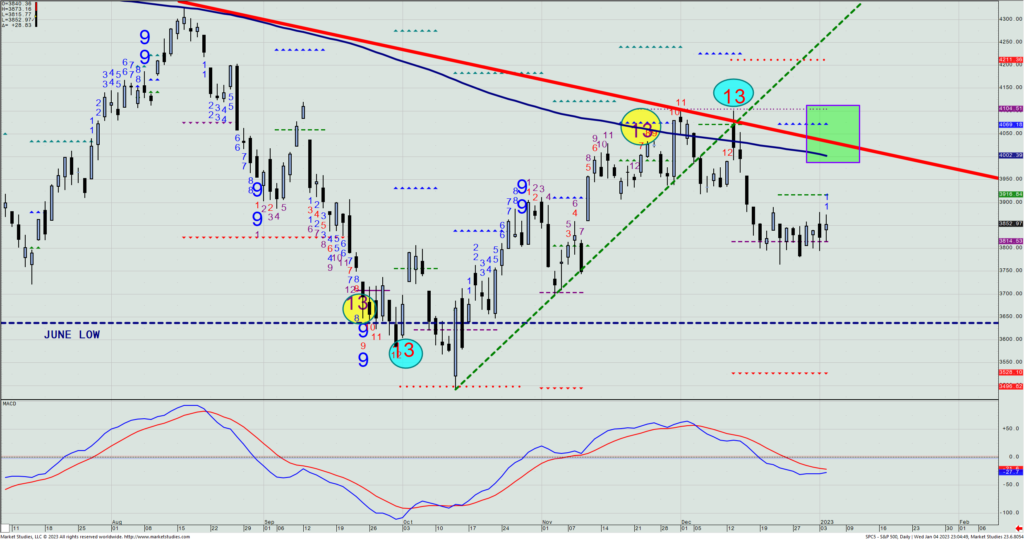
Stock futures traded mildly lower on Monday as US markets were closed for MLK Day. The market has had a very strong first-half of January, and the SPX is again poking right up against its downtrend line from all-time highs – the same line that it has failed against a few times last year.
SPX – Weekly
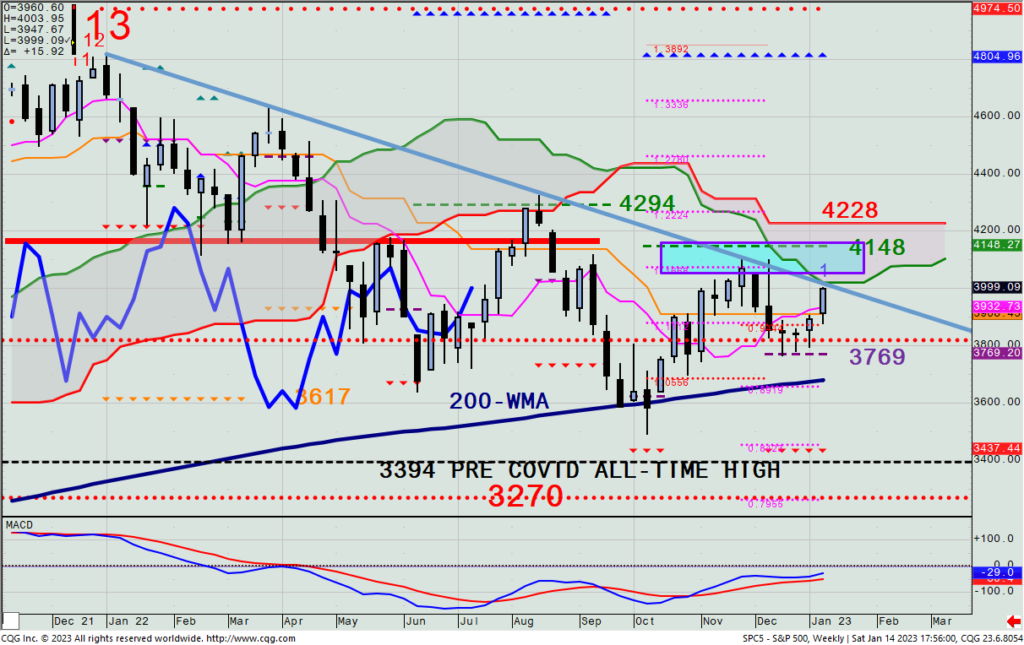
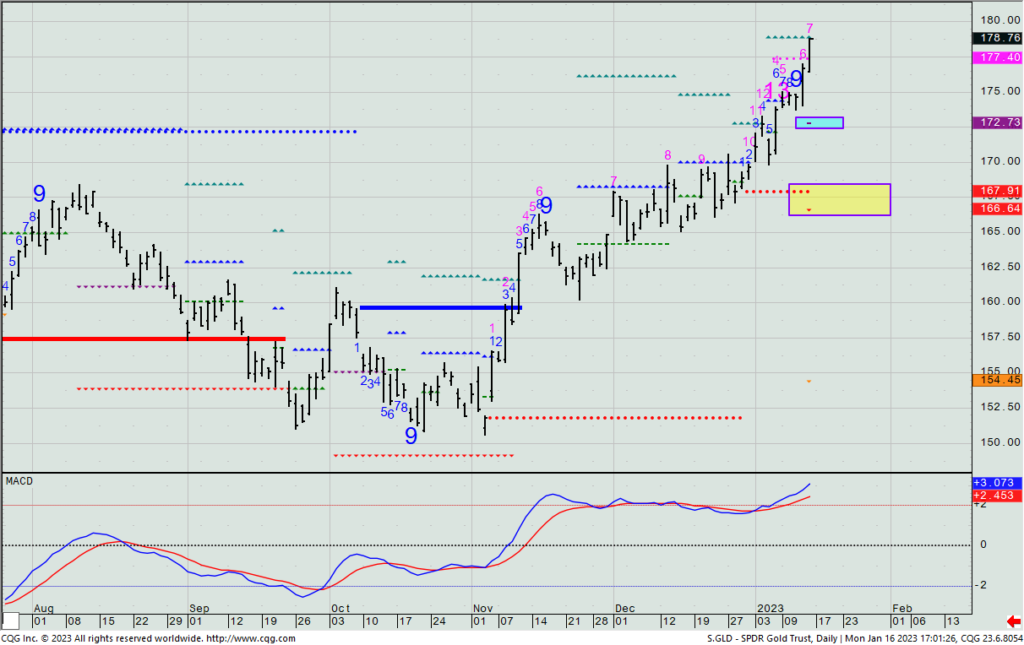
I recently wrote about wanting to get long gold on a pullback, and it hasn’t given us a chance to yet give in, recently hitting $1900/oz. and now less than 10% from all-time highs. The opportunity to get in may be coming as bullish consensus has reached 92% bulls in my preferred sentiment poll. As its most associated liquid ETF, the SPDR Gold Trust (GLD), hasn’t even once pulled back to its daily bullish Propulsion Momentum level on this rally. (It’s currently at $172.73.)
If the opportunity comes to get long near $173, let’s buy a 1% position of a Feb. 17th $173/$187 call spread for what is the then current mid-price. If GLD were to sell off even further to the $168 level, then I’d look to put on an additional 2% position there, buying a ~45 day out $168/$187 call spread at the then mid-price level.
GLD – Daily
We also have on 5 open positions that I have recently gotten you into, namely: MDT, META, SPY, TLT, and ABBV. The MDT is down 44%, and the others are up 53%, 41%, 79%, and 64%, respectively. I’d like to remove one spread in each of those 5 different positions today.

DailyPlay Update – January 12, 2023
Stocks continued their recent rally on Tuesday with gains of 1.76% in the NDX; 1.3% in the SPX; and 0.75% in the Dow, as investors reverse last year’s weakness in direct opposite magnitude of what was beaten down the most. The SPX marked a qualified and confirmed upside breakout of its daily bullish Propulsion Momentum level (3917) to next target 4069. (Of course, it still has to get above the downtrend line to get there.) With today being the much looked at monthly CPI figure, be prepared for any and everything to happen by the market’s close.
SPX -Daily
We’ve recently added some new positions, including longs in the SPY and SPOT and a short in ABBV. All are working to start, but today is anyone’s guess what’s going to happen. I’m hearing some talk that the CPI will come in better than expected (thus, the rally we’ve seen the past few days) and that those who bought ahead of the number will lighten up on a rally after the number comes out. Recall, that is what happened last month, too.
No new ideas today until we see what the CPI brings us. Tomorrow financial stocks will be in play as several key earnings reports in that space come out Friday morn. In the meantime, expect some craziness today.
$SPY
DailyPlay – Conditional Opening Trades (SPY) Partial Closing Trade (TLT) – January 9, 2023
Partial Closing Trade
- TLT – 64.32% Gain: Buy to Close 2 Contracts Feb 17th $100/$95 Put Vertical Spreads @ $0.66 Debit. DailyPlay Portfolio: By Closing 2 of the 6 Contracts, we will be paying $132.
SPY Conditional Bullish Opening Trades
SPY Conditional Trade 1
View SPY Trade 1
Strategy Details
Strategy: Long Call Vertical Spread
Direction: Bullish
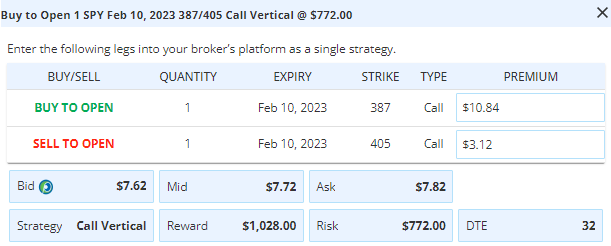
Details: Buy to Open 1 Contract Feb 10th $387/$405 Call Vertical Spread @ $7.72 Debit.
Total Risk: This trade has a max risk of $772 (1 Contract x $772).
Counter Trend Signal: This is a Bullish trade on a stock that is experiencing a neutral to bearish trend.
1M/6M Trends: Neutral/Bearish
Technical Score: 5/10
OptionsPlay Score: 91
Entering the Trade
Use the following details to enter the trade on your trading platform. Please note that if there is a multi-leg option strategy, it should be entered as a single trade.
Please note that this is a Conditional trade. The condition that has to be met, before you enter this bullish trade is if we see a pullback to between $387.70 and $387. Therefore, the credit received for this trade will be different than what we are showing here, which is only acting as a guideline.
SPY Conditional Trade 2
View SPY Trade 2
Strategy Details
Strategy: Long Call Vertical Spread
Direction: Bullish
Details: Buy to Open 1 Contract Feb 10th $384/$405 Call Vertical Spread @ $9.55 Debit.
Total Risk: This trade has a max risk of $955 (1 Contract x $955).
Counter Trend Signal: This is a Bullish trade on a stock that is experiencing a neutral to bearish trend.
1M/6M Trends: Neutral/Bearish
Technical Score: 5/10
OptionsPlay Score: 90
Entering the Trade
Use the following details to enter the trade on your trading platform. Please note that if there is a multi-leg option strategy, it should be entered as a single trade.
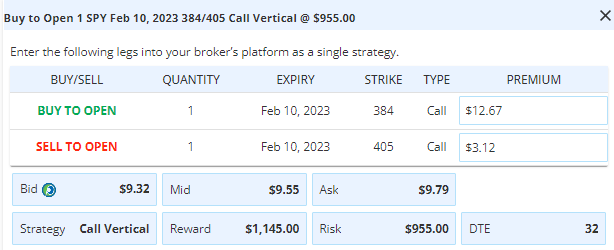
Please note that this is a Conditional trade. The condition that has to be met, before you enter this bullish trade is if we see a pullback to just north of $384. Therefore, the credit received for this trade will be different than what we are showing here, which is only acting as a guideline.
Investment Rationale
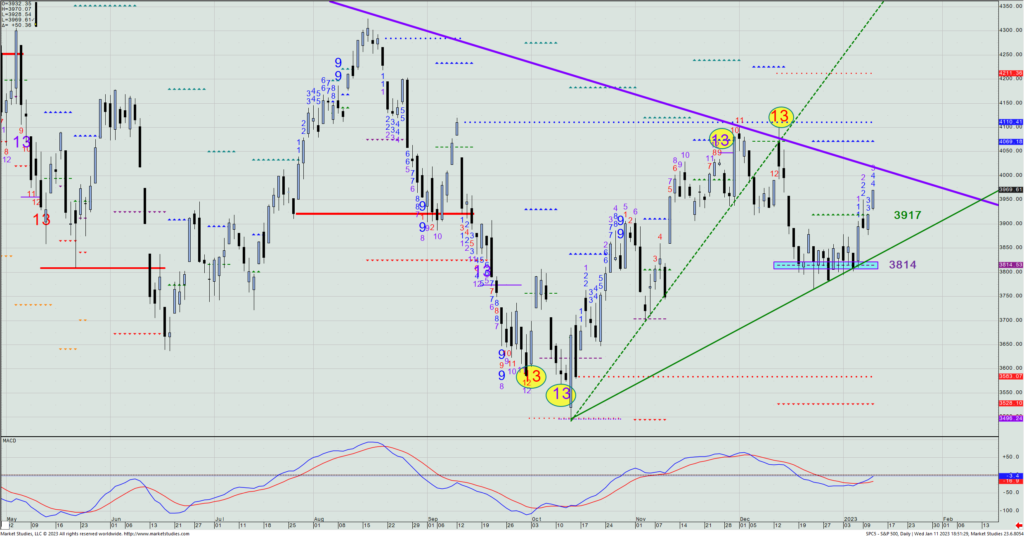
With stocks bouncing sharply on Friday and remaining above the SPX daily (3814) and weekly (3769) bearish Propulsion Momentum levels without any qualified and confirm closes beneath them, respectively, in the past 2+ weeks, Friday’s 86-point SPX gain keeps the early-2023 picture bullish.
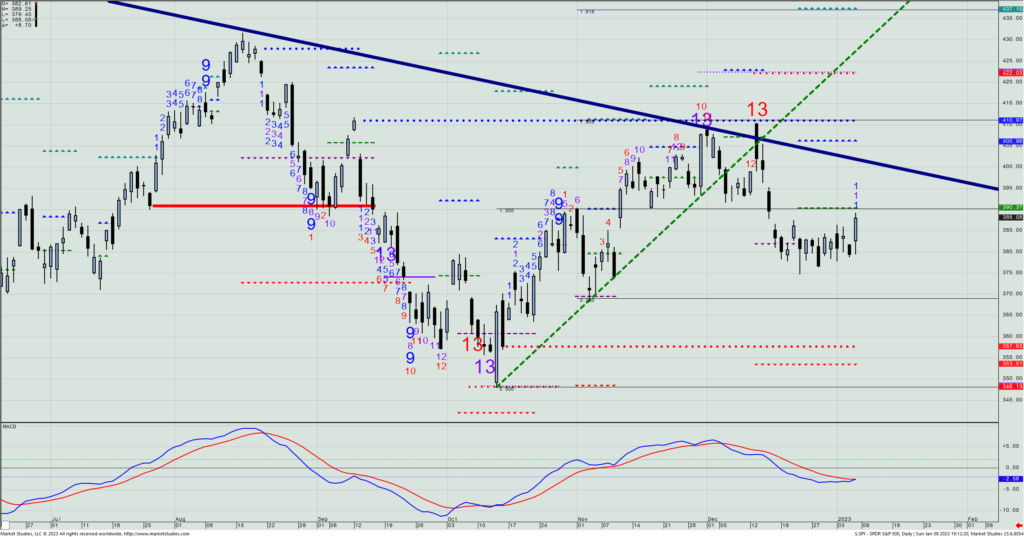
When I look more closely into Friday’s rally in the SPY – as well as the past 15 trading days since price gapped down on Dec. 16th – I see three distinct areas of support that I can discern from both Friday and then collectively since mid-December: They are $387.70 to $387; just north of $384; and $379.50 (the latter being the heaviest-volumed price of all SPY trading over the past three weeks and right by Friday’s low).
As Friday only marked a Setup +1 count – suggesting that we’re not near upside exhaustion from timing models along with a VIX right near 21 – we’ll look to get long two separate 1% portfolio positions on a pullback in price to the first and second of the above written support areas: 1) a Feb. 10th $387/$405 call spread, and then, 2) a Feb. 10th $384/$405 call spread. Each of these spreads are to be entered when price declines to near the first of the two strike prices at what then are their real-time trading mid-prices.
SPY – Daily
Elsewhere, we had on a very good long natural gas call spread in UNG that then collapsed in price as natgas lost over one-third of its value very quickly. Fortunately, we previously sold half the spreads for good profits, greatly reduce the loss on the other half which will go out worthless later this week.
The short Feb. 6th TLT $100/$95 put call is working nicely in just the few days since we put it on last week. We’re up 64% on it right now, so let’s remove 2 of the 6 today.
DailyPlay Update – January 6, 2023
Jobs numbers didn’t give bulls the look they wanted, and stocks again came off to now finally see the SPX close beneath the 3814 level. A close back above there today probably doesn’t make yesterday’s breach meaningful, but another down day today would not be a good look for recent buyers. A close beneath 3769 today would be a bigger problem without next week materially rallying.
Today is the first Friday of the month, so it’s the big employment report day for the market. It’s a possible make or break day for the market, and it’s the bulls who need to prove themselves because they are continually fighting the downtrend and the onus is on them to show why there is any merit to that approach.
Today is also a weekly option expiration, and when it comes to the SPX, the nearest highest open interest strikes are the 3825 calls (1604) and the 3825 puts (6736). The 3850 calls have 8244 contracts set to expire worthless, and the 3750 puts have 11,545 contracts still open also set to go out worthless. It will be interesting to see if either the 3850s or 3750s get targeted late in the day.
I may very well end up using what happens today to make portfolio changes on Monday, potentially reducing or fully exiting bullish option positions I’ve given you if today dives.
As a heads up, if the GLD high from this week ($173.30) stays the high through today’s close, the Conversion Line will move up to $166.76 next week. We’ll look to play a pullback to that level by then selling the March 17th $166/$162 put spread.
$GE

DailyPlay – Conditional Opening Trade (GLD) Closing Trade (GE) – January 5, 2023
Closing Trade
- GE –92.35% Loss: Buy to Close 1 Contract Jan. 6th $85/$90 Call Vertical Spreads @ $3.77 Debit. DailyPlay Portfolio: By Closing the last Contract, we will be paying $377. We partially closed this trade on December 16 with 3 Contracts at a $0.37 Debit, then on December 29 with 1 Contract at $0.49 Debit, and then again on January 4 with 1 Contract at $1.21 Debit. Our average gain for this trade is therefore 44.05% and our average cost basis to exit this trade is $1.10 Debit.
Investment Rationale
On Wednesday, stocks gave back some of their early gains, as Fed minutes once again gave little to the bulls to grab onto. 10-yr. UST benchmark yields dropped 8 bps. on the day to 3.71%, while gold rallied nicely to near $1860, and it continues to look like it’s heading higher. (You should be looking to start or add long positions on pullbacks. I expect a good year for it in ’23.)
The SPX remains above the short-term level I am leaning on (3814), so I will keep my early-’23 bull bias until proven otherwise. (This is no way changes my overall bearish outlook for the year.) Be mindful that a downside breach of that level following an up-close day (like Wednesday was) that then sees a lower open/lower low/lower close the following day does up the odds that the market likely heads lower.
SPX – Daily
We have one GE short call spread left that expires tomorrow. GE spun out its new healthcare stock yesterday, which unfortunately gave a boost to the stock price at an untimely time for us. We will cover the last spread we have on today.
I have a new idea for us (though something I’ve mentioned in both yesterday’s and Tuesday’s webinars I hosted) that gold is looking good, especially after zooming higher from its false breakdown in the fall. (A major false breakdown usually comes back to test the high end of the trading range it was previously in, or in this case, essentially to a move up to near all-time highs.)
GLD – Weekly

We see that it has now reached both the weekly cloud bottom and 50% retracement level (i.e., the bold red horizontal line) this week. With the GLD now also having gone 8 weeks without touching its moving-higher Conversion Line (in magenta), we may see a pullback in the next few weeks down to it. When and if it gets there, I’ll want to buy that decline that touches the Conversion Line (it may be higher than where it is now). You can do that by simply buying the stock outright, or selling a then ATM/$162 put spread (with a three-month expiration), or buying a call spread (but only if able to buy for no more than 30% of your chosen strike differential). Right now, calls are priced quite expensively.
Generally, conditional trades that I recommend have a one-week time period to enter. This one, I will leave open longer than that given my belief that gold will be a good winner this year.
$META
DailyPlay – Opening Trade (META) – January 4, 2023
META Bullish Opening Trade
View META Trade
Strategy Details
Strategy: Short Put Vertical Spread
Direction: Bullish
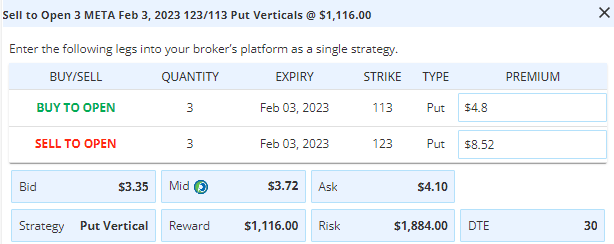
Details: Sell to Open 3 Contracts Feb 3rd $123/$113 Put Vertical Spreads @ $3.72 Credit.
Total Risk: This trade has a max risk of $1,884 (3 Contracts x $628).
Counter Trend Signal: This is a Bullish trade on a stock that is experiencing a neutral to bullish trend.
1M/6M Trends: Bullish/Neutral
Technical Score: 3/10
OptionsPlay Score: 87
Entering the Trade
Use the following details to enter the trade on your trading platform. Please note that if there is a multi-leg option strategy, it should be entered as a single trade.
Please note that these prices are based on the previous day’s closing prices. Should the underlying move significantly during the pre-market hours, we will likely adjust the strikes and prices to reflect a more accurate trade entry.
Investment Rationale
Stocks first rallied and then declined on a PMI figure that didn’t give bulls any more juice to push higher. Stock indexes were down yesterday, but at least importantly in the short-term, the SPX 3814 level still held as support on the close.
I find it interesting (and anguishing) how difficult it was to come up with a DP for today that meets our general guidelines for putting on vertical call or put spreads that also don’t cost too much or collect too little, respectively. Option prices seem to be the wrong way for most ideas I would enter based upon the chart work I do. But, after over an hour looking, I found an idea with right pricing for what I want us to do.
META has advanced sharply after bottoming in the fall at ~$89. It’s now $124 and was up nicely in yesterday’s down tape. Though it is now close to filling a prior unfilled gap, I think analysts are just getting started in upgrading it, and that it still has decent upside relative to downside risk. As such, let’s look to sell a Feb. 3rd $123/$113 put spread. It closed on Tuesday at $3.725 mid- , which is 37% of the strike differential. Meta reports earnings on Feb. 1, so we will be out of it just before then if it trades our way over the next month.
META – Daily
Last week we took off one of three remaining short GE Jan. 6th $85/$90 put spreads that we’ve made good money on since entering almost a month ago. Let’s take one more off today, as price is getting closer back to the $85 level. The last one we’ll take off tomorrow after we see what the Fed minutes say later today.
$TLT
DailyPlay – Opening Trade (TLT) – January 3, 2023
TLT Bullish Opening Trade
View TLT Trade
Strategy Details
Strategy: Short Put Vertical Spread
Direction: Bullish
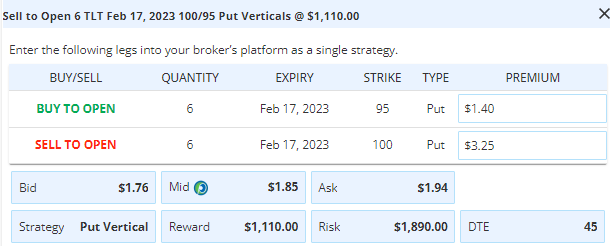
Details: Sell to Open 6 Contracts Feb 17th $100/$95 Put Vertical Spreads @ $1.85 Credit.
Total Risk: This trade has a max risk of $1,890 (6 Contracts x $315).
Counter Trend Signal: This is a Bullish trade on a stock that is experiencing a neutral to bullish trend.
1M/6M Trends: Bearish/Bearish
Technical Score: 3/10
OptionsPlay Score: 90
Entering the Trade
Use the following details to enter the trade on your trading platform. Please note that if there is a multi-leg option strategy, it should be entered as a single trade.
Please note that these prices are based on the previous day’s closing prices. Should the underlying move significantly during the pre-market hours, we will likely adjust the strikes and prices to reflect a more accurate trade entry.
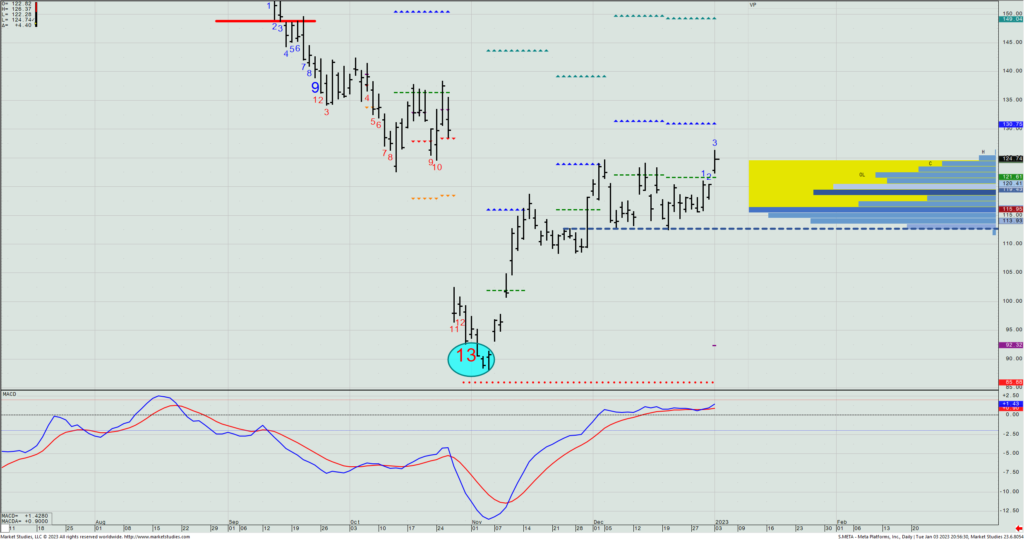
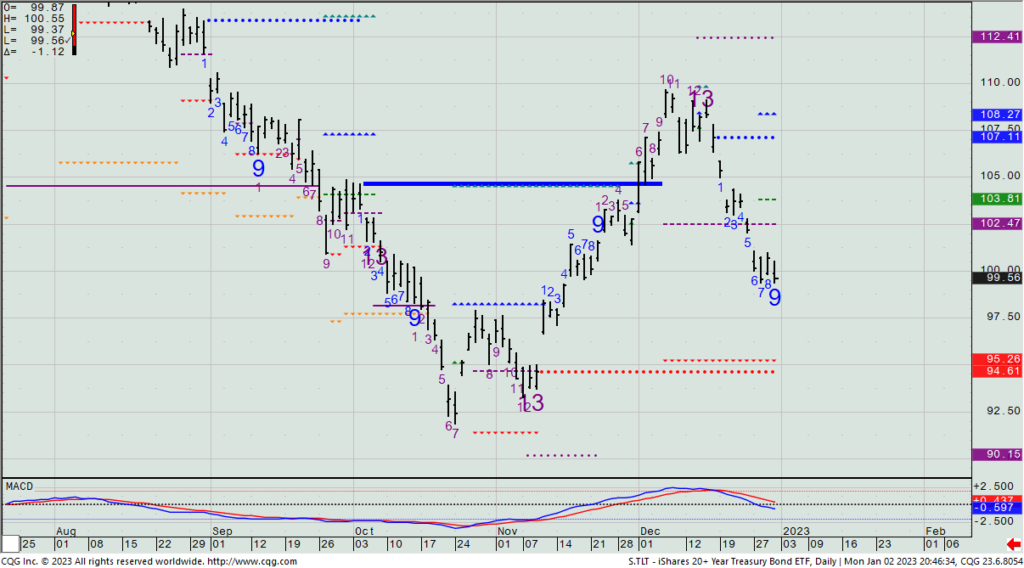
Investment Rationale
UST 10-yr. bonds rallied XMAS week to where I have resistance pegged near 3.86%, so let’s look to sell a TLT Feb. 17th $100/$95 put spread for $1.85 credit, which represents a 37% differential between strikes. (With bond futures trading down as I write this Monday night, the TLT is now trading above $100, so we should actually be able to get a bit more for this spread than quoted based upon Friday’s closing mid prices.)
TLT – Daily
$GE
DailyPlay – Partial Closing Trade (GE) – December 29, 2022
Just a quick update on GE: With the stock again finding support at its cloud top, let’s remove another 1 of 3 remaining short Jan 6th $85/$90 call spreads we’re short.
Partial Closing Trade
- GE – 75% Gain: Buy to Close 1 Contract Jan. 6th $85/$90 Call Vertical Spreads @ $0.49 Debit. DailyPlay Portfolio: By Closing 1 of the remaining 3 Contracts, we will be paying $49.
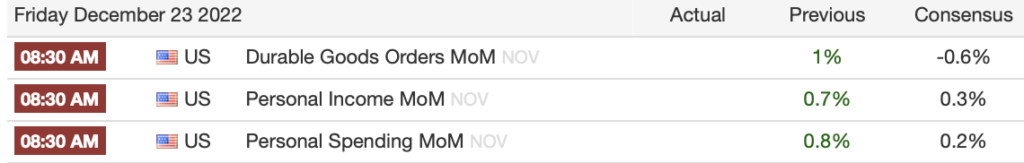
Dailyplay Update – December 23, 2022
A very rough day for bulls yesterday, though the late rebound into the close brought the SPX back above 3814, keeping that as the important short-term support level. First level resistance has moved lower to 3917/3932. (Both areas are highlighted on the chart below.)
SPX – Daily
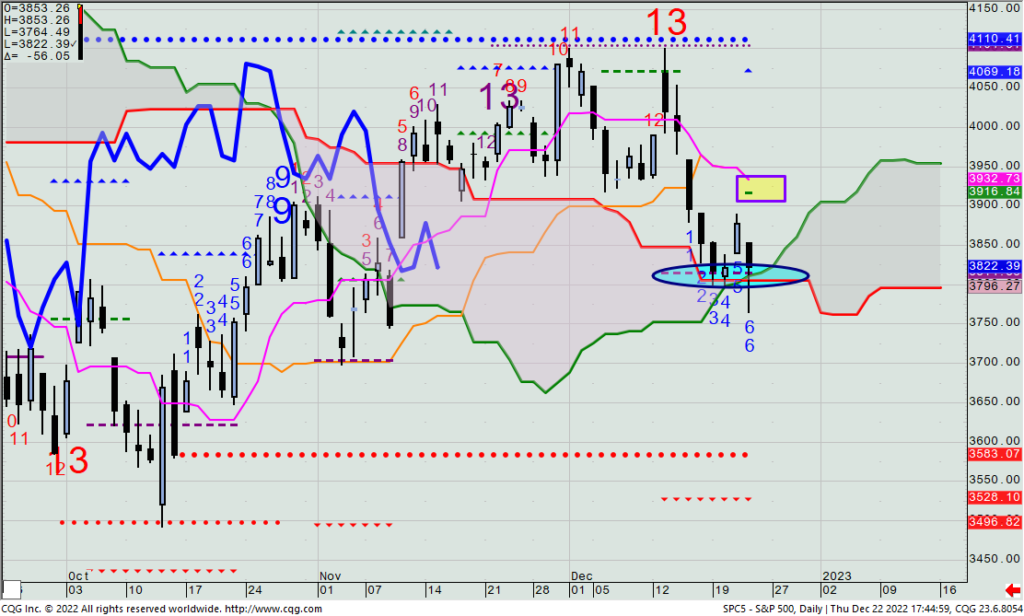
Without a new closing low for December tomorrow, the downward Setup count will flip to a +1, removing the bearish momentum we’ve seen since the peak two Tuesdays ago on the CPI spike higher that marked the top.
Today is a weekly option expiration and the last potentially meaningful economic reports of the year, as well as the last day most PMs will be in the office this year.
Yesterday saw a down close in GE, and yesterday I said that if the stock was down on the day going into the close, we’d take off 1 of the remaining 3 credit call spreads we had on. (It closing mid-price was 67 cents, so you should have been filled right about there.) For now, we’ll keep the final two of these that we put on at a $1.96 credit.
This is my last communication with you through Tuesday, Jan. 3, when I’ll return to do our next weekly technical outlook webinar. I wish all of you, our loyal readers, a very happy holiday season and good health and prosperity for the new year. – Rick