
$GE

DailyPlay – Partial Closing Trade (GE) – December 29, 2022
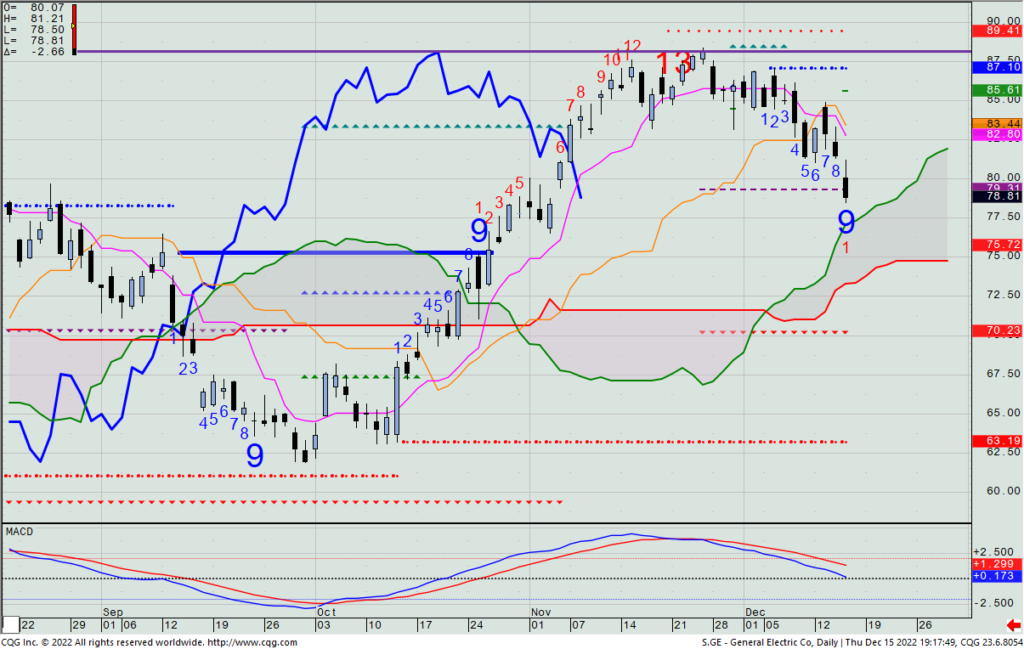
Just a quick update on GE: With the stock again finding support at its cloud top, let’s remove another 1 of 3 remaining short Jan 6th $85/$90 call spreads we’re short.
Partial Closing Trade
- GE – 75% Gain: Buy to Close 1 Contract Jan. 6th $85/$90 Call Vertical Spreads @ $0.49 Debit. DailyPlay Portfolio: By Closing 1 of the remaining 3 Contracts, we will be paying $49.

Dailyplay Update – December 23, 2022
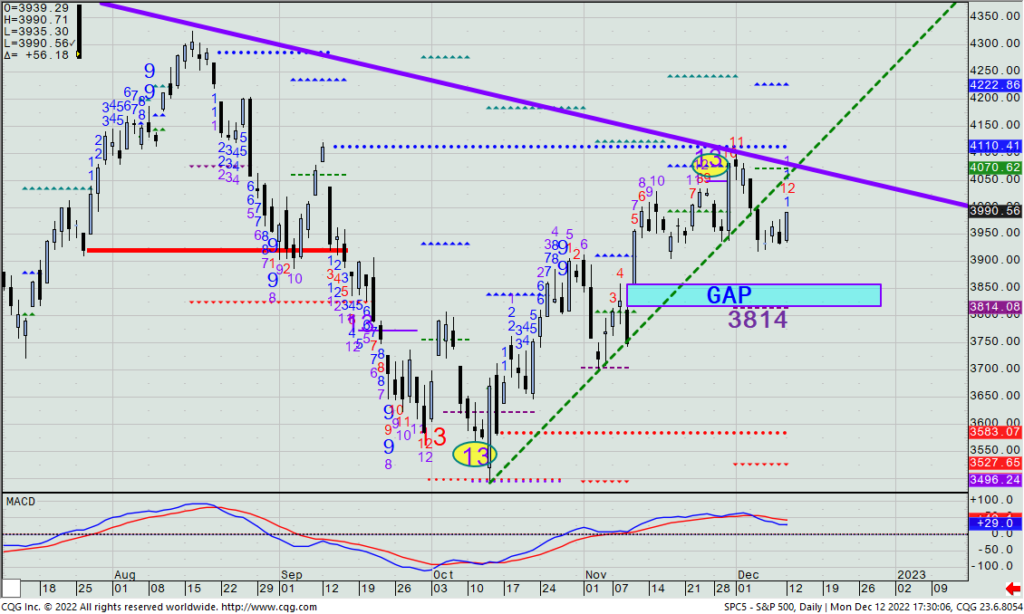
A very rough day for bulls yesterday, though the late rebound into the close brought the SPX back above 3814, keeping that as the important short-term support level. First level resistance has moved lower to 3917/3932. (Both areas are highlighted on the chart below.)
SPX – Daily
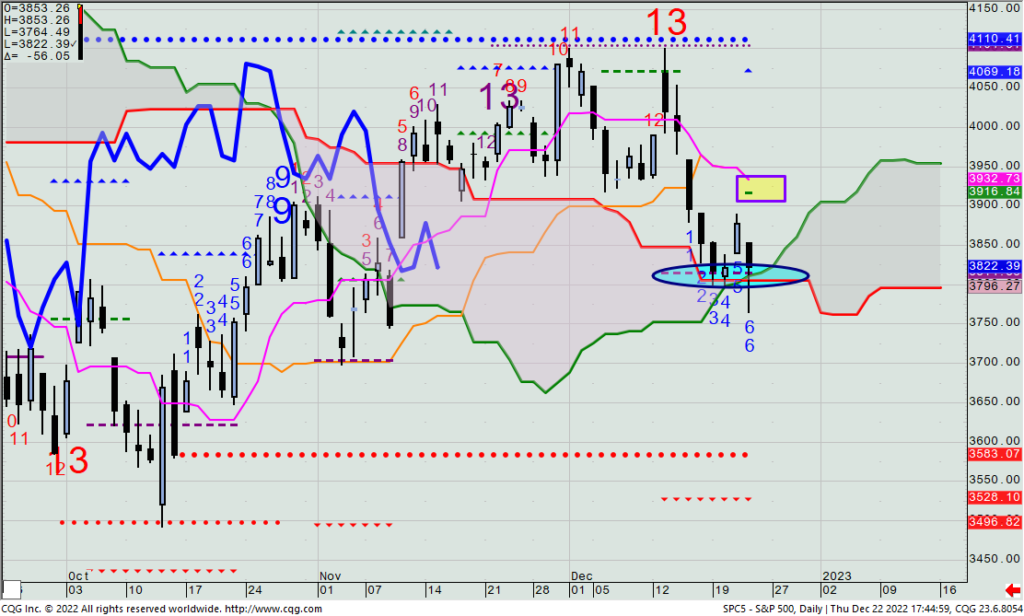
Without a new closing low for December tomorrow, the downward Setup count will flip to a +1, removing the bearish momentum we’ve seen since the peak two Tuesdays ago on the CPI spike higher that marked the top.
Today is a weekly option expiration and the last potentially meaningful economic reports of the year, as well as the last day most PMs will be in the office this year.
Yesterday saw a down close in GE, and yesterday I said that if the stock was down on the day going into the close, we’d take off 1 of the remaining 3 credit call spreads we had on. (It closing mid-price was 67 cents, so you should have been filled right about there.) For now, we’ll keep the final two of these that we put on at a $1.96 credit.
This is my last communication with you through Tuesday, Jan. 3, when I’ll return to do our next weekly technical outlook webinar. I wish all of you, our loyal readers, a very happy holiday season and good health and prosperity for the new year. – Rick
DailyPlay Update – December 22, 2022
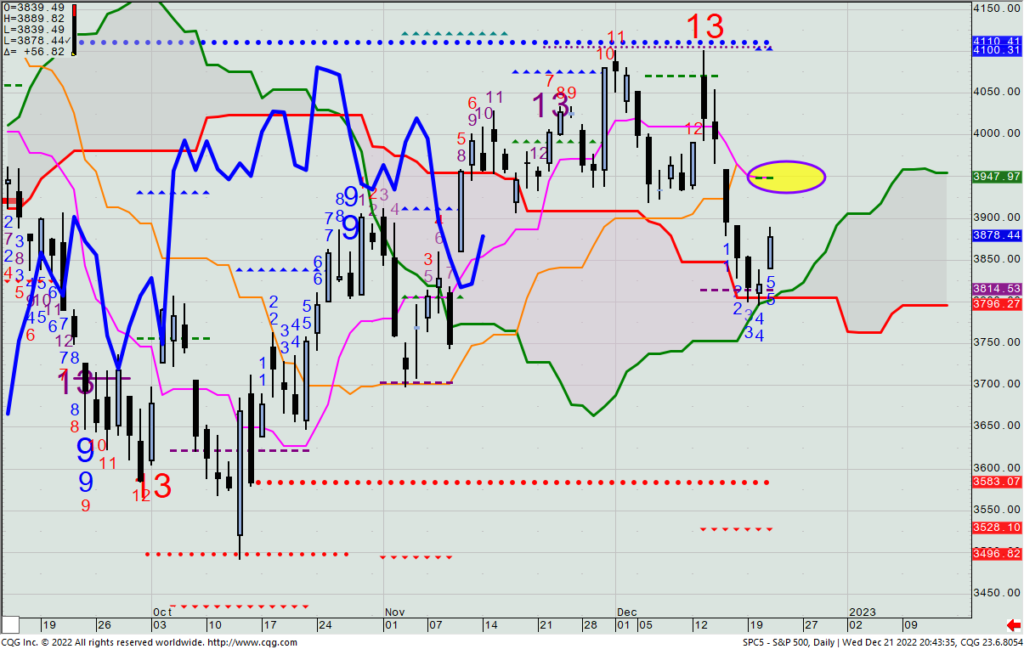
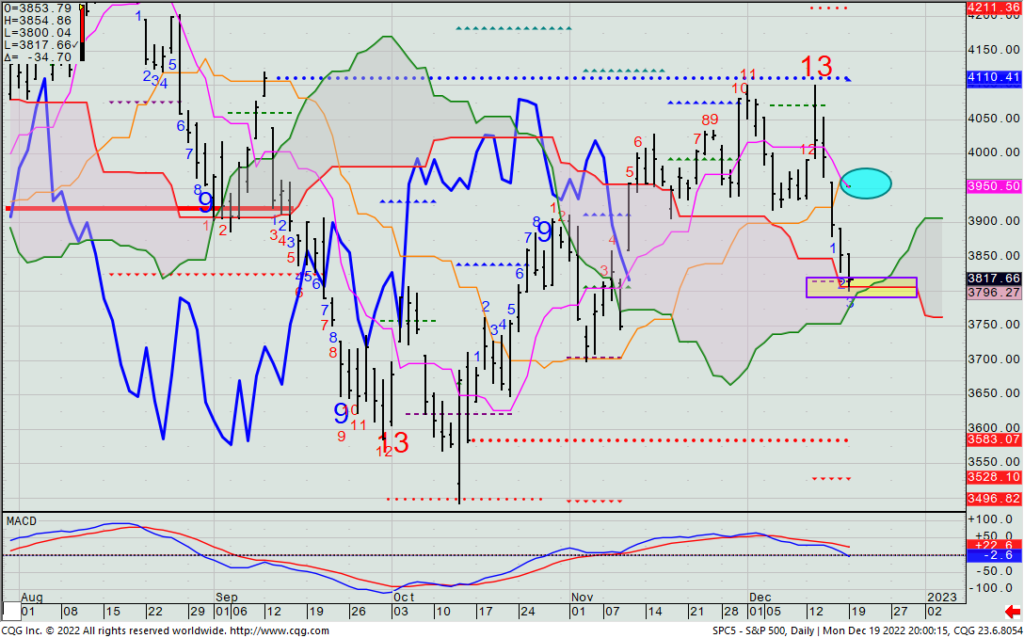
Stocks got a rally right on cue from what was my downside target of 3814, surely aided by solid earnings from both Nike and Federal Express and the best Consumer Confidence number since April. The SPX jumped 57 points to 3874 and marked its second up day in a row.
Today and tomorrow are really the last two days of the year that most PMs are likely working, meaning that they will finish adjusting their positions to be the way they want to end the year with, barring something unexpected happening next week. Personally, I’m not looking for a move to get materially above the 3948 level (highlighted on the daily chart below in a yellow ellipse), so it would indeed surprise me to see anything meaningful above there occur in a Santa Claus rally.
SPX – Daily
If I’m not mistaken, we have four conditional trades still awaiting entry. I’d like to see us get into any/all of them by Friday’s close (not because they couldn’t be possibly entered into next week, but because I am off next week and we will not be writing Daily Plays next week (nor doing any webinars). So, it’s your choice if you want to enter any of these ideas should their entry price zones be achieved after Friday.
There isn’t much to do with the current open positions I’ve gotten you into. The TSLA looks like we’ll lose our entire paid-out premium, and with 9 days to go till expiration, we might as well see if there’s any considerable rally to come to reduce that full loss from occurring. Should th stock see a large one-day upmove in the next few trading days, take advantage of it to exit with a slightly better price than where it’s at now.
The one thing I will do today is if GE is trading down on the day going into the close, let’s take off 1 of the remaining 3 short call spreads we have on. Otherwise, we’ll just sit tight until January.

DailyPlay – Conditional Opening Trade (NVDA) – December 21, 2022
NVDA Conditional Bearish Opening Trade
View NVDA Trade
Strategy Details
Strategy: Short Call Vertical Spread
Direction: Bearish
Details: Sell to Open 6 Contracts Jan 6th $170/$175 Call Vertical Spreads @ $1.50 Credit.
Total Risk: This trade has a max risk of $2,100 (6 Contracts x $350).
Counter Trend Signal: This is a Bearish trade on a stock that is experiencing a neutral to bullish trend.
1M/6M Trends: Neutral/Mildly Bullish
Technical Score: 6/10
OptionsPlay Score: 101
Entering the Trade
Use the following details to enter the trade on your trading platform. Please note that if there is a multi-leg option strategy, it should be entered as a single trade.
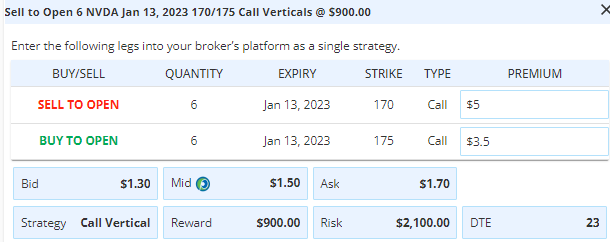
Please note that this is a CONDITIONAL trade. We will only enter the trade when the condition is met, which is If we see NVDA trade back to the $168 to $170 area. Also note that the cost basis, premium paid, as well as the number of contracts when we open this trade will therefore be different from what we post today. This condition is only valid for a week unless advised otherwise.
Investment Rationale
A quiet day for stocks on Tuesday, with gains in all four major US equity indexes (though not the NDX). The SPX posted its first up day in the last five, and it is holding, at least for now, the level I expected it to (i.e., the bearish Propulsion Momentum level at 3814 and its cloud (the latter being extremely narrow right now).
SPX – Daily
We have several conditional trades that have not yet reached their respective entry points. Consider all those active open recommendations through week’s end. (I am not looking to enter new trades the last week of the year.)
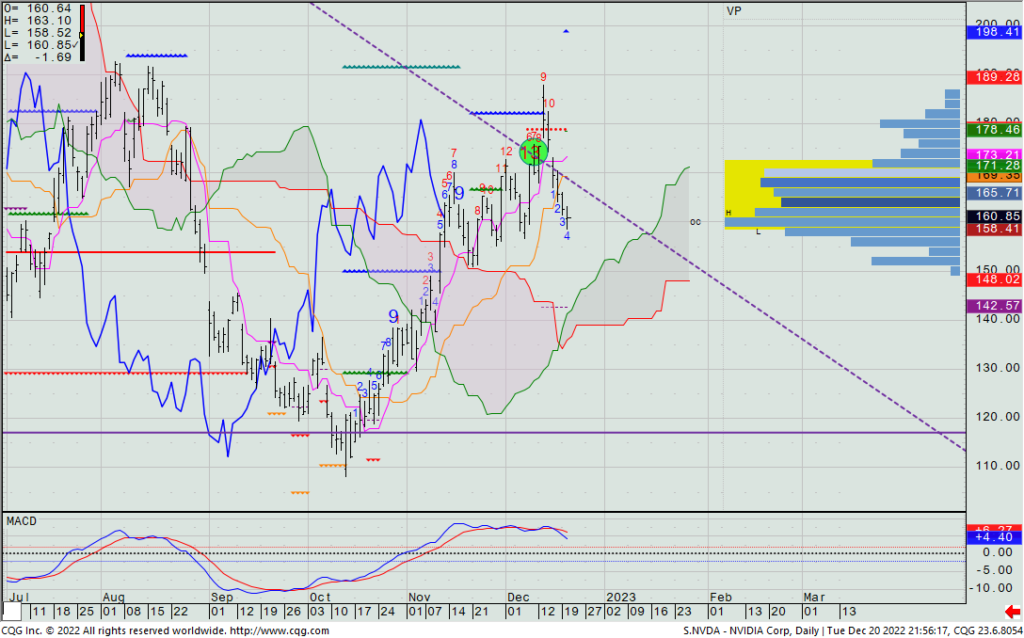
Here’s another one to add to the list: Last Tuesday’s spike high in NVIDIA (NVDA) hit its daily Propulsion Exhaustion level at $181.73 and then dove since then. You can see that yesterday closed very close to where the bottom of its “Value Range” is (i.e., the yellow horizontal area from roughly $160 to $172.50). If we do see a market rally now from the reason I showed above in the SPX, this could easily get back up to the high end of that same Value Area.
Therefore, if we see NVDA trade back to the $168 to $170 area, we’ll then look to sell the Jan. 13th $170/$175 call spread for what is then its current bid/offer spread mid-price. (The current ATM/$5 OTM call spread is fetching about 45% of the strike differential, which as a seller, I am always content with receiving.)
This is also a good way of seeing that even when the VIX is relatively low, some individual stocks have high enough volatility that you can still sell their options.
NVDA – Daily
$MRNA

DailyPlay – Conditional Opening Trade (MRNA) Closing Trade (GNRC) – December 20, 2022
Closing trade
- GNRC – 102.50% Loss: Buy to Close 6 Contracts Dec 23rd $100/$95 Put Vertical Spreads @ $4.05 Debit. DailyPlay Portfolio: By Closing all 6 Contracts, we will be paying $2.430.
MRNA Conditional Bullish Opening Trade
View MRNA Trade
Strategy Details
Strategy: Short Put Vertical Spread
Direction: Bullish
Details: Sell to Open 6 Contracts Jan 20th $180/$175 Put Vertical Spreads @ $1.77 Credit.
Total Risk: This trade has a max risk of $1,938 (6 Contracts x $323).
Trend Continuation Signal: This is a Bullish trade on a stock that is experiencing a bullish trend.
1M/6M Trends: Bullish/Bullish
Technical Score: 10/10
OptionsPlay Score: 94
Entering the Trade
Use the following details to enter the trade on your trading platform. Please note that if there is a multi-leg option strategy, it should be entered as a single trade.
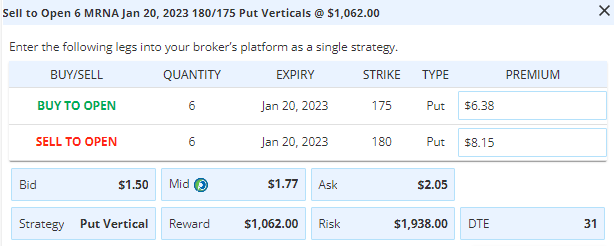
Please note that this is a CONDITIONAL trade. We will only enter the trade when the condition is met, which is If we see it pullback to the $181 to $176 range. Also note that the cost basis, premium paid, as well as the number of contracts when we open this trade will therefore be different from what we post today. This condition is only valid for a week unless advised otherwise.
Investment Rationale
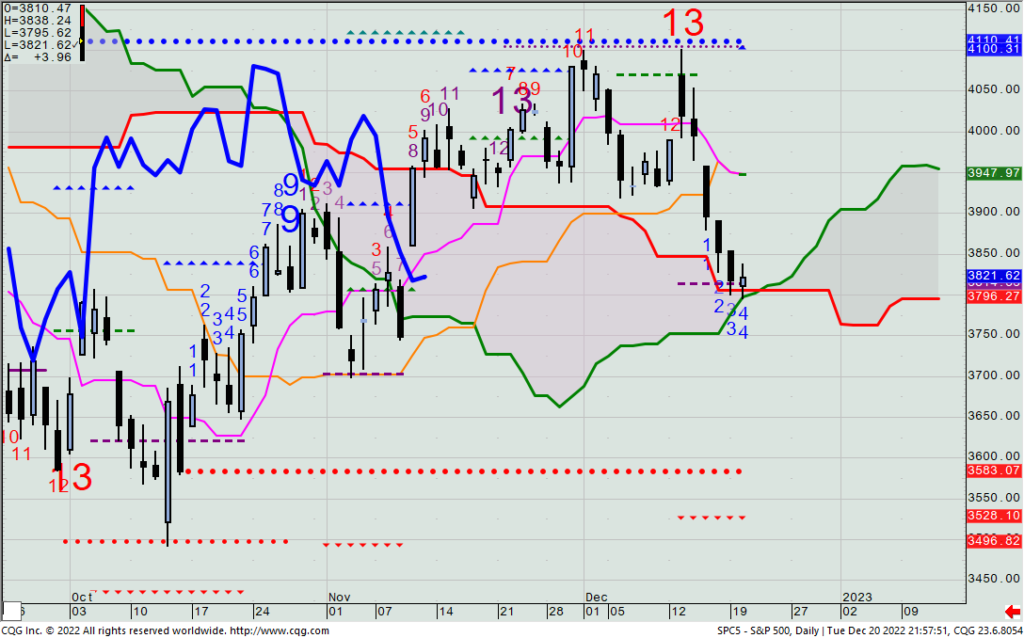
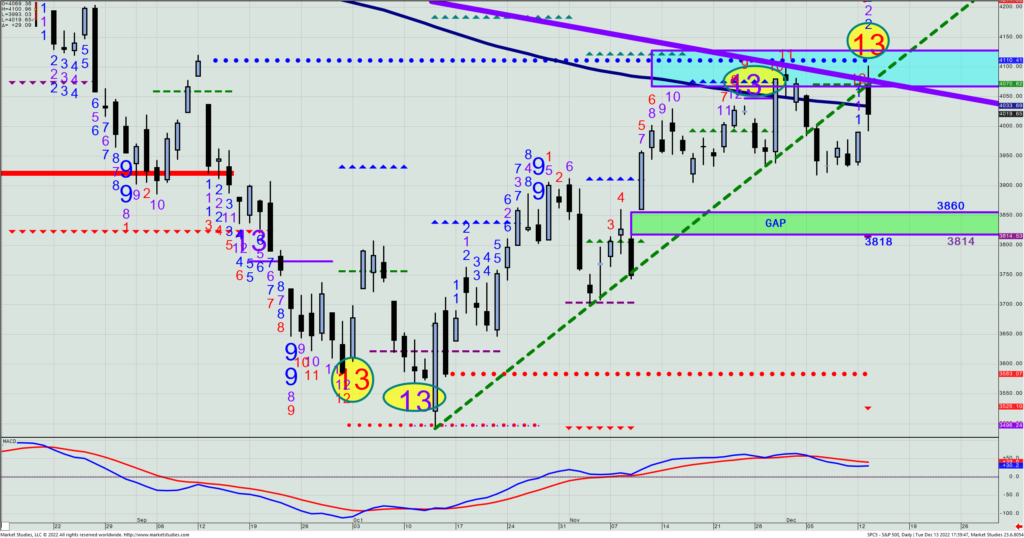
Stocks remained under pressure as prior bulls keep getting forced out of their longs, with year-end tax loss selling adding further fuel, and time running out for Santa Claus rally-thinking bulls that it’s actually going to happen. The SPX made a low of 3800 on Monday, filling the bottom of the 40+ pt. gap at 3818, while also holding above its daily bearish Propulsion Momentum level of 3814. This area is where the market needs to hold for bulls to have any sense that even a small trading bounce can occur before year-end. Yesterday’s new low for this current decline brought the daily bullish Propulsion Momentum level down to 3952, which unrelatedly is right near the daily Conversion and Base Lines’ values. (All three are currently in the highlighted cyan-colored ellipse. That’s your closest resistance area right now.
SPX – Daily
Let’s do some house-cleaning of non-performing trades that I’ve recently recommended:
- Let’s exit the GNRC Dec. 23rd short $100/$95 put spread that expires on Friday. We’re down just over 100% and that’s basically the max loss I’m willing to take on an option position.
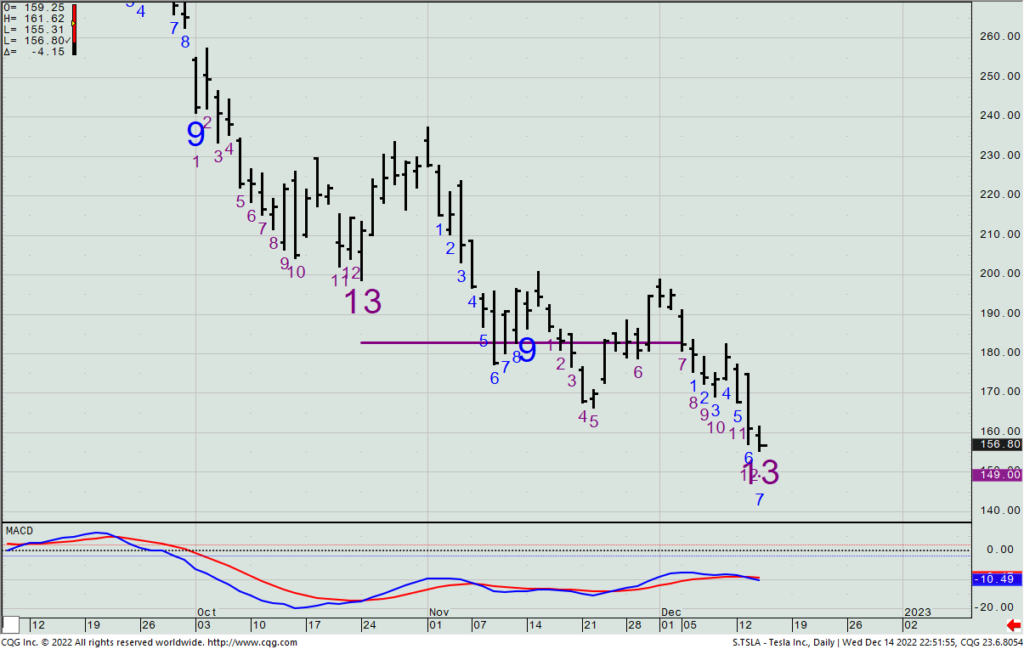
- If TSLA closes above $156.80 today, it will confirm the -13 downside exhaustion signal and give us a better chance to shortly exit with a lesser loss than the 91% we’re down now. Our long $190/$225 call spread expires on the 30th, so we need see this lift quickly in price to be able to possibly cut the loss by a third or half. If we were to see anything near $175+ in coming days, I’d take that “as good as it’ll get” and just exit.
- On Dec. 12th we exited half our long UNG $16.50/$18 call spread, up ~70% on that half. Price has come back down to the hedge strike (i.e., $18), so today let’s take off another 5 of the remaining 10 contracts we have on.
- The four conditional trades in ( WBA, SPY, TSLA and NFLX ) are still open trade ideas to initiate bearish trades on if we see rallies up to my preferred entry zones.
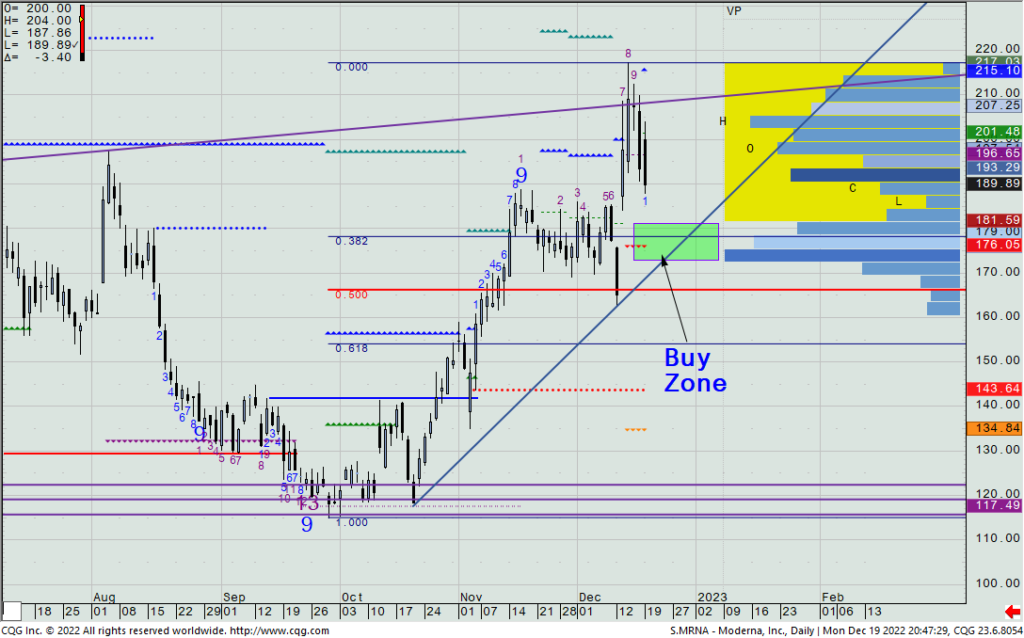
With my having four pending bearish ideas to potentially get into, I’m going to give you a bullish one to buy on a pullback. Moderna (MRNA) has recently rallied to its best level since January ’22, finally breaking out above an 8-month trading range. If we see it pullback to the $181 to $176 range (I’d probably enter the spread when/if I saw price hit right near both of those prices, meaning I’d do half at each of those levels), we’ll look to sell the Jan. 20th $180/$175 put spread at the then bid/offer mid-price. Right now, the Jan. 20th ATM/ $5 OTM is going for about $2.40, meaning you’re collecting 48% of the $5 strike differential. I’d think that it should be somewhat similar if we get down to our entry zone highlighted in the green box in the below chart.
MRNA – Daily
$NFLX
DailyPlay – NFLX Conditional Opening Trade (NFLX) – December 19, 2022
NFLX Conditional Bearish Opening Trade
View NFLX Trade
Strategy Details
Strategy: Short Call Vertical Spread
Direction: Bearish
Details: Sell to Open 2 Contracts Jan 20th $300/$320 Call Vertical Spreads @ $7.23 Credit.
Total Risk: This trade has a max risk of $2,554 (2 Contracts x $1,277).
Counter Trend Signal: This is a Bearish trade on a stock that is experiencing a long-term bullish trend.
1M/6M Trends: Mildly Bearish /Bullish
Technical Score: 10/10
OptionsPlay Score: 102
Entering the Trade
Use the following details to enter the trade on your trading platform. Please note that if there is a multi-leg option strategy, it should be entered as a single trade.
Please note that this is a CONDITIONAL trade. We will only enter the trade when the condition is met, which is IF PRICE RALLIES TO THE $301/$305 AREA. Also note that the cost basis, premium paid, as well as the number of contracts when we open this trade will therefore be different from what we post today. This condition is only valid for a week unless advised otherwise.
Investment Rationale
Stocks slid again on Friday as selling begat selling – some expiration related; some prior longs giving up on their positions; and CTAs (i.e., Commodity Trading Advisors) turning into sellers as their computer programs turned bearish. S&P futures got very close to my downside target to cover my own short position (3852) I put on Tuesday just beneath 4100, so I covered at 3863 after a few attempts down to my level that didn’t quite get reached. (The SPX got close to the bottom of the prior unfilled gap (3818) and its disqualified bearish Propulsion Momentum level (3814), so I wasn’t gonna get greedy over the last few points.)
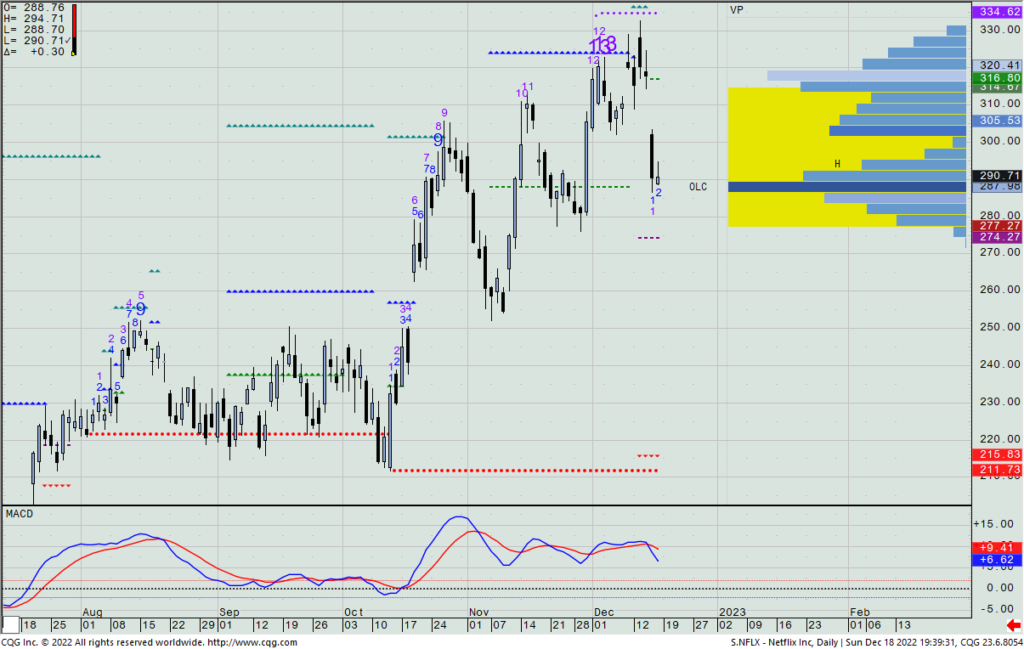
One of the more amusing things occurred earlier this month, whereby I had instructed my institutional clients to exit a NFLX long I had gotten them into on May 12 near $170. On December 2, I recommended they exit that long, and we got out at an average price of $311.
A week later, two Street analysts (one from Wells Fargo and one from Cowin) upgraded NFLX, causing the stock to take out what was a December high of $322 to push to $332. Just a week later, the stock is trading $290.
Once again, the supposed fundamental experts who cover this stock for a living, decided to upgrade only after the stock had rallied 80-plus percent off its low. It’s hysterically funny!
NFLX – Daily
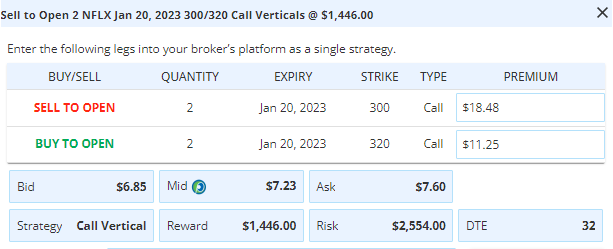
To me, it’s a short, and I’d like to use a rally to the $301 to $305 area to sell a Jan 20th $300/$320 call spread at the then bid/offer mid-price. (These calls are actually high-priced now and a better sell than puts are a buy.) The current Jan.20th ATM/$20 OTM call spread is collecting 43% of the strike differential.
THIS IS A CONDITIONAL TRADE THAT WILL GET EXECUTED IF PRICE RALLIES TO THE $301/$305 AREA.
$SPY

DailyPlay – Conditional Opening Trade (SPY) Partial Closing Trade (GE) – December 16, 2022
Partial Closing Trade
- GE – 81.12% Gain: Buy to Close 3 Contracts Jan. 6th $85/$90 Call Vertical Spreads @ $0.37 Debit. DailyPlay Portfolio: By Closing 3 of the remaining 6 Contracts, we will be paying $111.
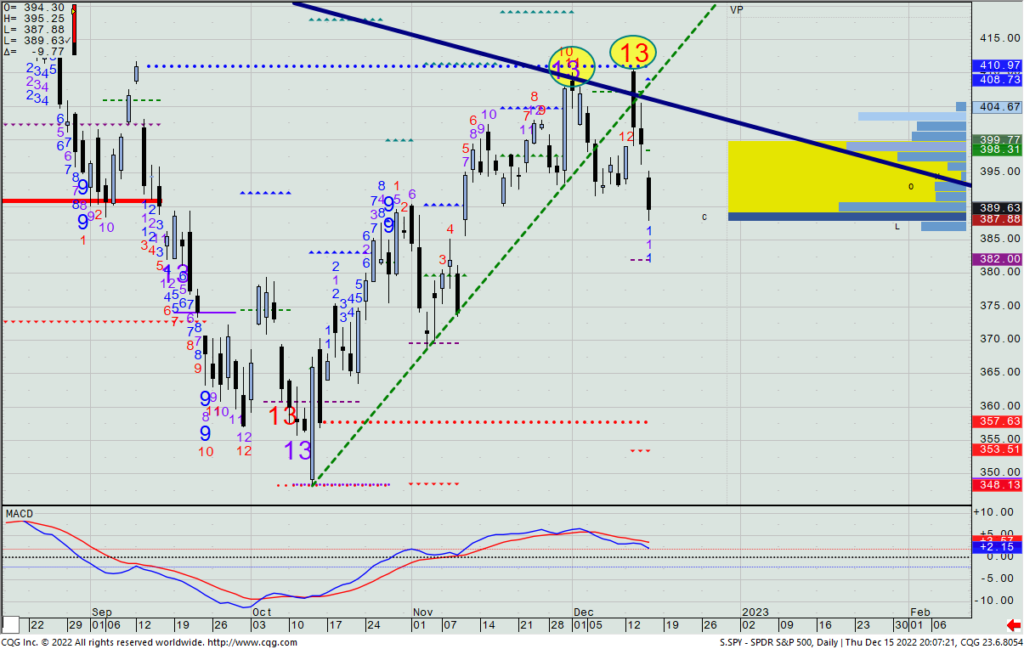
SPY Conditional Bearish Opening Trade
View SPY Trade
Strategy Details
Strategy: Long Put Vertical Spread
Direction: Bearish
Details: Buy to Open 3 Contracts Jan. 13th $396/$382 Put Vertical Spreads @ $6.44 Debit.
Total Risk: This trade has a max risk of $1,898 (3 Contracts x $644).
Trend Continuation Signal: This is a Bearish trade on a stock that is experiencing a mildly bearish trend.
1M/6M Trends: Mildly Bearish /Neutral
Technical Score: 8/10
OptionsPlay Score: 109
Entering the Trade
Use the following details to enter the trade on your trading platform. Please note that if there is a multi-leg option strategy, it should be entered as a single trade.
Please note that this is a CONDITIONAL trade. We will only enter the trade when the condition is met, which is IF SPY RALLIES TO THE $395/$398 AREA. Also note that the cost basis, premium paid, as well as the number of contracts when we open this trade will therefore be different from what we post today. This condition is only valid for a week unless advised otherwise.
Investment Rationale
Yesterday’s decline was a real game-breaker for the longs, as more investors came to grips with what I have been saying all along: The Fed wasn’t going to budge their message into a dovish stance (that bulls were looking for), and the rally that started in mid-October has likely come to a sudden end – at least for now.
Yesterday, I covered half of my very large short position that I put on after Tuesday’s CPI surge, and will look to cover more when/if the SPX declines into the unfilled gap area from 3860 to 3818. (This is for a fund that I am a PM for.)
As for today, I want to trim some of the short GE Jan. 6th $85/$90 call spread that we have. We originally sold 8 spreads; took 2 off when he hit a 50% profit within 4 days of holding it, and now with a daily Setup -9 against the bearish Propulsion Momentum level, I want to exit 3 more of the remaining six spreads, as we’re up 81% on these.
GE – Daily
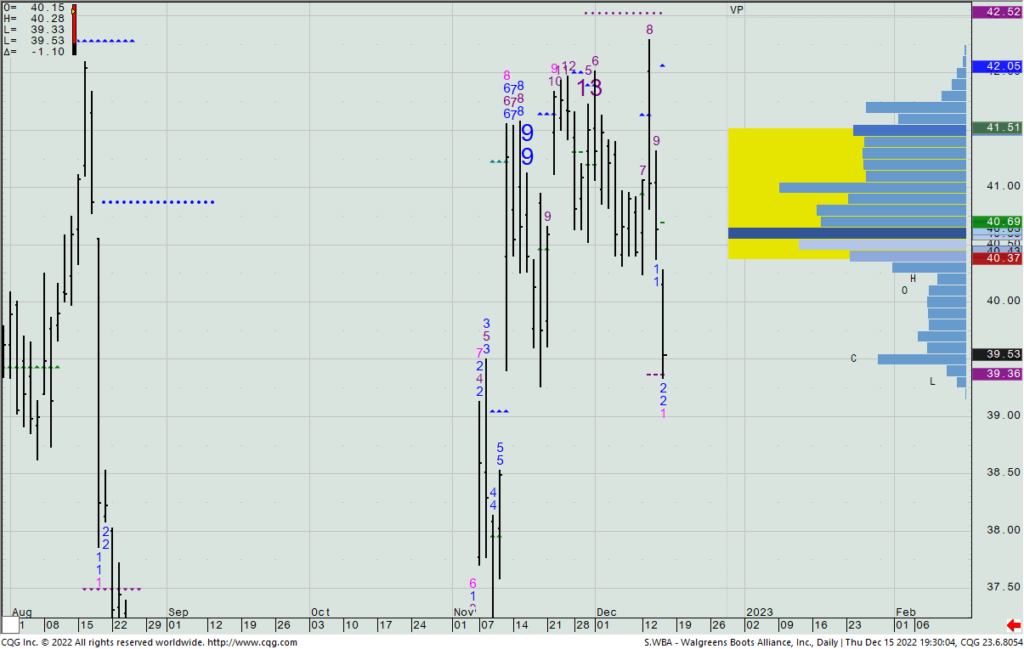
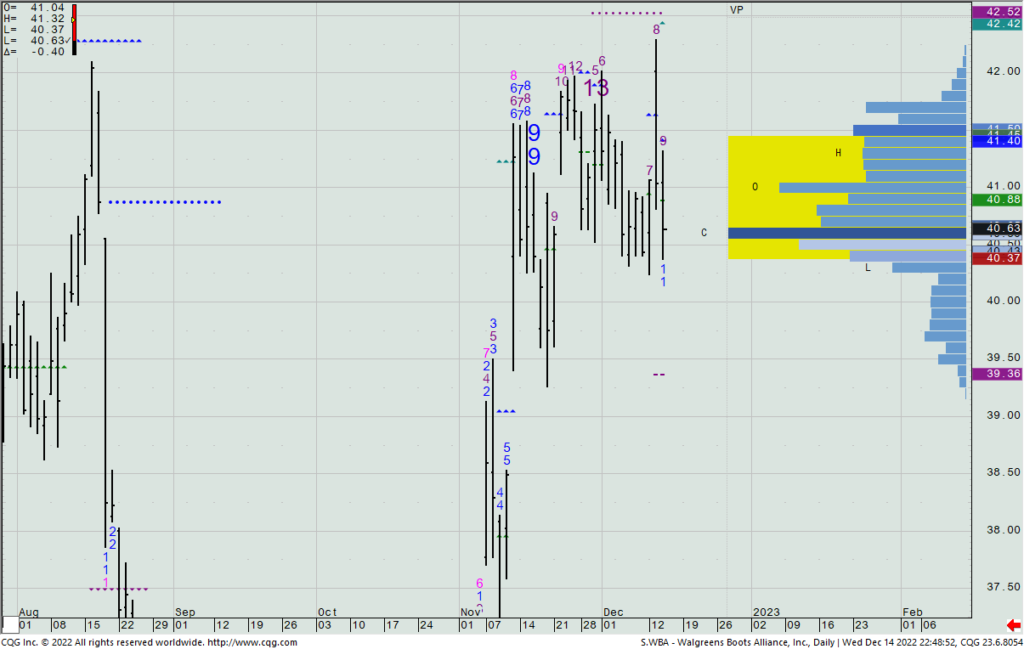
Yesterday, I suggested selling a WBA Dec. 30th $41.5/$42.5 call spread IF we saw price rally up to $41.45 by Tuesday. That now looks far less likely to happen given the decline to the bottom of its four-week range yesterday. I will reset this idea to now look to short the $40.5/$41.5 call spread (same expiration) if price gets back up to $40.5 by this coming Wednesday’s close.
WBA – Daily
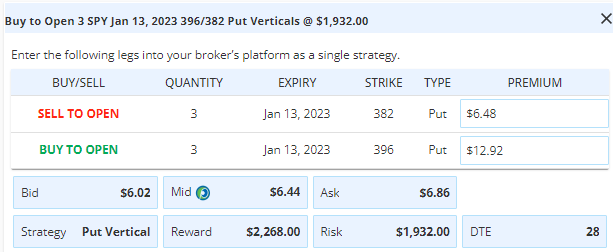
Lastly, as a new idea, should we see the SPY trade up to the $395 to $398 area in the next few days, we’ll look to buy the Jan. 13th $396/$382 put spread for what is then its bid/offer mid price. THIS IS A CONDITIONAL TRADE NEEDING A SPY RALLY TO THE $395/$398 AREA TO IMPLEMENT.
SPY – Daily
$WBA
DailyPlay – Conditional Opening Trade (WBA) Closing Trade (LEN) – December 15, 2022
Closing Trade
- LEN – 91.02% Gain: Buy to Close 1 Contract Dec. 16th $82.50/$77.50 Put Vertical Spreads @ $0.15 Debit. DailyPlay Portfolio: By Closing the remaining 1 Contract, we will be paying $15. We took partial profit on this trade on December 2 when we Closed 1 Contract @ $0.59 Debit, and then again on December 12 when we Closed 1 Contract @ $0.62 Debit. Our average gain on this trade is 72.85% and our average cost basis to exit this trade is $0.45 Debit.
WBA Bearish Opening Trade
View WBA Trade
Strategy Details
Strategy: Short Call Vertical Spread
Direction: Bearish
Details: Sell to Open 26 Contracts Dec. 30th $41.50/$42.50 Calll Vertical Spreads @ $0.27 Credit.
Total Risk: This trade has a max risk of $1,898 (26 Contracts x $73).
Counter Trend Signal: This is a Bearish trade on a stock that is experiencing a neutral to bullish trend.
1M/6M Trends: Neutral /Bullish
Technical Score: 6/10
OptionsPlay Score: 97
Entering the Trade
Use the following details to enter the trade on your trading platform. Please note that if there is a multi-leg option strategy, it should be entered as a single trade.
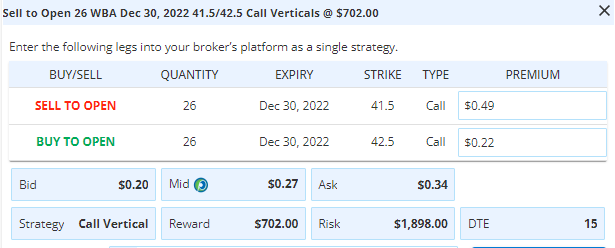
Please note that this is a CONDITIONAL trade. We will only enter the trade when the condition is met, which is IF we see a MOVE UP TO $41.45. Also note that the cost basis, premium paid, as well as the number of contracts when we open this trade will therefore be different from what we post today. This condition is only valid for a week unless advised otherwise.
Investment Rationale
The Fed’s 50 bp. rate hike was expected; Chair Powell’s comments were not unexpected (i.e., “rates stay higher for longer”; “won’t stop until the job gets done”); and yet, the SPX sold off from near a 35-pt. gain and turned into a day with a 24-pt. loss. My view on why the turnaround? Because bulls heard nothing particularly positive from Powell, and this rally has largely been based upon hearing just that tone.
We now have gotten the key economic data that we’re going to get between now and year’s end. And yet, we find the market is very close to where it was going into Tuesday’s CPI release, meaning that neither bull nor bear has any more decided edge than they did two 48 hours ago. Which to me, makes it less clear as to what the market will do between now and New Years. But what I will say is that my bearish stance does not get shaken until and if it’s proven wrong. With the SPX resistance area I’ve highlighted several times still capping the rally – and the spike high on Tuesday failing right by the daily bullish Propulsion Momentum level (4148) – I still have a decent sense of where I want to see the SPX hold beneath.
Lennar reported after the bell yesterday, and last I looked the stock was down about $2 near $88.50, and well-above the $82.50 short strike we have on in a Dec. 16th $82.5/$77.5 put spread. his expires tomorrow, so let’s exit today the last spread we have on. It’s been a good trade for us.
But we also need look at a bad one we have, too. We are long a TSLA Dec. 30th $190/$225 call spread. We’re down 93% on it, and I’m hoping that in the next few days it sees some type of bounce from a new daily -13 signal yesterday to help reduce the loss. This one never went our way. (It happens.) It’s another good reason why we keep our trades to a max. 2% on any single trade.
TSLA – Daily
After spending over two hours tonight looking for a new trade I can live with, I see one potentially lining up in Walgreens Boots (WBA). The below chart shows a Volume at Price indicator for the past month of trading, with the highlighted yellow zone representing where the first standard deviation (~68%) of the volume was traded. Given the range over the last two days, I would think that in the next few trading days (let’s say by Tuesday’s close next week), it is not a stretch to think that the top of that yellow zone (currently $41.45) may very well trade again. If it does, I’ll then want to short a Dec. 30th $41.50/$42.50 call spread (my assumption being that this will not make a new December high before Dec. 30th expiration). Based upon where the current ATM/$1 OTM call spread is trading, if you can then collect the same ~50% of the strike differential that one can get now – a fair but not necessarily an advantageous price for the spread – we’d look to do that as a short-term trade into year’s end.
THIS IS A CONDITIONAL TRADE NEEDING A MOVE UP TO ~$41.45 TO ENTER THE SHORT CALL SPREAD.
WBA – Daily
$V
DailyPlay – Closing Trade (V) – December 14, 2022
Closing Trade
- V -85.4% Loss: Sell to Close 4 Contracts Dec. 16 $205/185 Put Vertical Spreads @ $0.74 Credit. DailyPlay Portfolio: By Closing all 4 Contracts, we will be receiving $296.
Investment Rationale
The better-than-expected CPI figure gave the market an instant boost when it got released yesterday at 8:30am, taking S&P futures from about a 30-pt. gain to over a 100-pt. gain in very short order. The bulls seemingly had their reckoning, and the Tom Lee’s of the world were celebrating their believed prescient bullish calls.
But, as I wrote you yesterday in the DP email, a bullish move today would mark a Sequential +13 signal, potentially getting many bulled up at precisely the wrong time. Later in the morning, I sold the largest single trade position I have ever put on in the fund I trade for, shorting $5mm worth of S&P futures. I plan on holding them for several days if today’s Fed announcement doesn’t force me out of the trade, but having sold higher I also have some cushion to play with.
SPX – Daily
We have two option positions on that expire on Friday: one in Visa and one in Lennar. As mentioned yesterday, Tony suggested getting out of the Visa trade yesterday. Added my own thoughts to that it might just pay – at this point and the large loss – that perhaps it made sense to hold on till today to see if for any reason the market plunked after the Fed announcement. Either way, you want to be out of it by no later than Thursday’s close.
Lennar reports today after the close. We still have one of three short put spreads on in it, and with it having closed at $90.59 yesterday and our being short a Dec. 16th $82.5/$77.5 put spread, we have almost a 10% cushion to the downside before the remaining spread would move against us. Thus, we’ll take our chances and hold this through tomorrow, but will exit it fully by Thursday’s close.
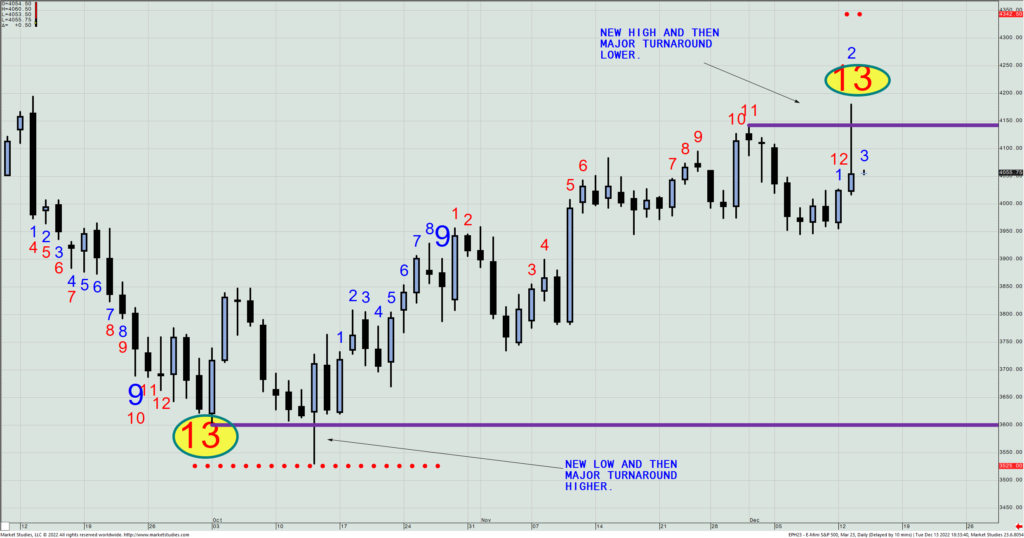
Lastly, look at how the market bottomed in October after the bearish CPI report came out, and what possibly could be how it topped yesterday after a bullish CPI report came out. They look very mirror-like – but inverted. So, I continue to be a bear up here until proven wrong.
S&P 500 Futures – Daily
DailyPlay Updates – December 13, 2022
Investment Rationale
A solid up day yesterday brought the SPX from recent support to a 50-point gain, and as much as this looks good to the average eye, it also marked a daily Standard Sequential +12 count, meaning that all today need do is open or close above 3977.02 AND also trade as high as 4027.26 to mark the +13 today. It should not go unnoticed by institutional players who know this model. However, they may not do anything until Wednesday’s Fed announcement/press conference, BUT, if the news is bad the 13 count is going to bring on even heavier selling than if it wasn’t there. (Something to keep note of.)
SPX – Daily
Yesterday we significantly trimmed several positions; most of them longs. As I explained on Monday’s webinar, anytime you have a big outside catalyst to meaningfully push a market one way or another, I often take down trading exposure so that a bad result wouldn’t kill all the hard work/profits put in and made over the past several weeks. Successful trading is about risk management, and I much rather be cautious than hope that a number comes out in a way that helps my positions. (Which also means that if you like what you hear tomorrow from the Fed, you can always put back on what you took off. That’s much easier to do than get out of something when it’s moving quickly against you.)
With today’s CPI number released at 8:30 am ET today, we’ll have a good clue as to investors’ take on what the Fed may very well do tomorrow. We certainly could see an SPX 100-pt. move happen tomorrow – even in just in the last 90 minutes of trading – so make sure you are on top of positions that need to be monitored.
Though I know this could disappoint some, I am not putting on any new option positions until after tomorrow’s Fed statement. I think it the prudent thing to do, given the possibility of them either creating or killing the chance for a Santa Claus rally. And as none of us have a clue as to which way they are going to lean on that choice, I don’t need to put on new exposure today that could possibly be down or up 50-100% a day later. (But of course, you are always free to do as you see fit that best suits your own risk tolerance.)
I spoke with Tony yesterday and he suggests taking off the long Visa Dec. 16th $205/$185 put spread we have on that expires on Friday. (At this point, I’d personally wait until we see what happens Wednesday afternoon on the odd chance that the market dives.) Also, Lennar (LEN) reports after the close on Wednesday. As we have 1 of 3 remaining bullish spreads in it and have made good money on the two spreads we’ve already exited, I will likely hold it until we see what it does on Thursday. It expires on Friday and will be out of it by Thursday’s close regardless.