
GOOGL

DailyPlay – Closing Trade (GOOGL) & Portfolio Review – August 25, 2025
Closing Trade
- GOOGL – 78% gain: Buy to Close 6 Contracts (or 100% of your Contracts) Sep 05 $190/$185 Put Vertical Spreads @ $0.35 Debit. DailyPlay Portfolio: By Closing 6 Contracts, we will be paying $210. We initially opened these 6 contracts on July 29 @ $1.60 Credit. Our gain, therefore, is $750.
DailyPlay Portfolio Review
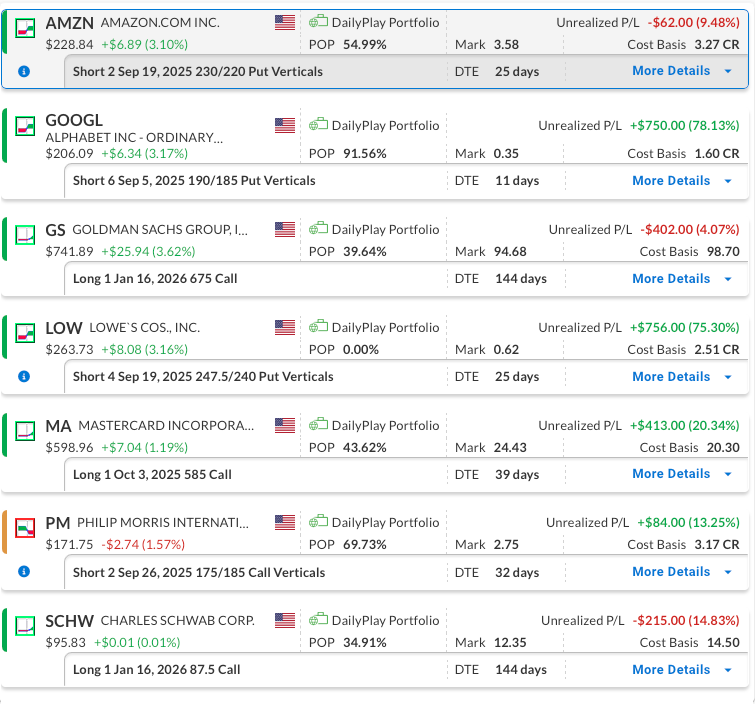
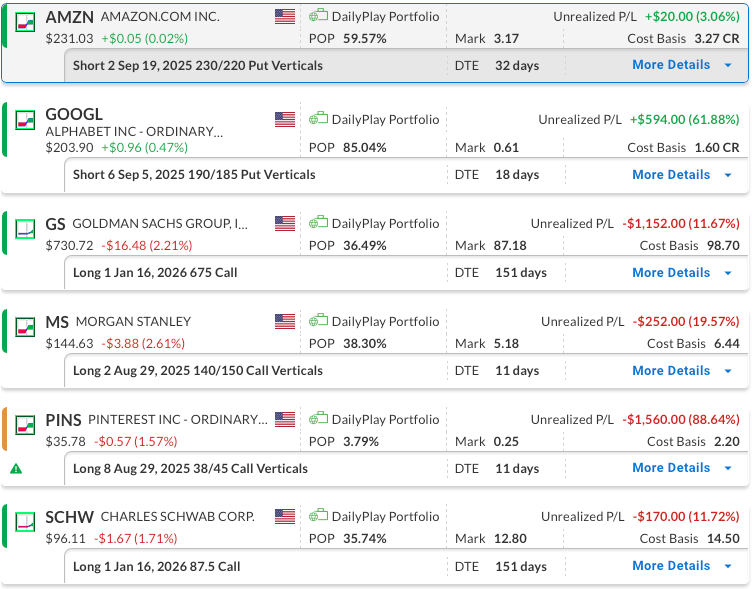
Our Trades
AMZN – 25 DTE
Bullish Credit Spread – Amazon.com, Inc. (AMZN) – The recent CCI dip signaled strength within an established bullish trend, highlighted by a short-term pullback. We entered our position last week and plan to stay the course as the trade develops.
GOOGL – 11 DTE
The position will be closed at the market open on today (Monday).
GS – 144 DTE
Bullish Long Call – Goldman Sachs Group, Inc. (GS) – We recently initiated this position and intend to maintain it. Continued strength in the financial sector, driven by Powell’s dovish comments at Jackson Hole, remains supportive for GS.
LOW – 25 DTE
Bullish Credit Spread – Lowe’s Companies, Inc. (LOW) – We recently established this position and we plan to stay the course for now.
MA – 39 DTE
Bullish Long Call – Mastercard Incorporated (MA) – We recently opened this position and plan to hold it for now. We chose a straight long call because the implied volatility (IV) rank was very low at 6/100, making spread strategies less favorable in terms of the risk/reward ratio compared to purchasing the call outright.
PM – 32 DTE
Bearish Credit Spread – Philip Morris International Inc. (PM) – We recently established this position and we plan to stay the course for now.
SCHW – 144 DTE
Bullish Long Call – Charles Schwab Corp. (SCHW) – We continue to see upside potential, supported by strong fundamentals and resilience in the financial sector. We closed our initial long call position once the option’s delta hit 1.00, then shifted into a higher strike call with a 0.80 delta and a later expiration. We plan to hold steady with this adjustment.
MA

DailyPlay – Opening Trade (MA) – August 22, 2025
MA Bullish Opening Trade Signal
Investment Rationale
Investment Thesis
Mastercard (MA) continues to demonstrate leadership in the global payments space, benefitting from structural tailwinds in digital transactions, cross-border volumes, and secular declines in cash usage. Despite trading at a premium valuation, the company’s consistent ability to generate superior profitability and cash flows supports the case for further upside. With recent price action confirming strength against broader markets, Mastercard presents a compelling bullish opportunity targeting the $640 level over the medium term.
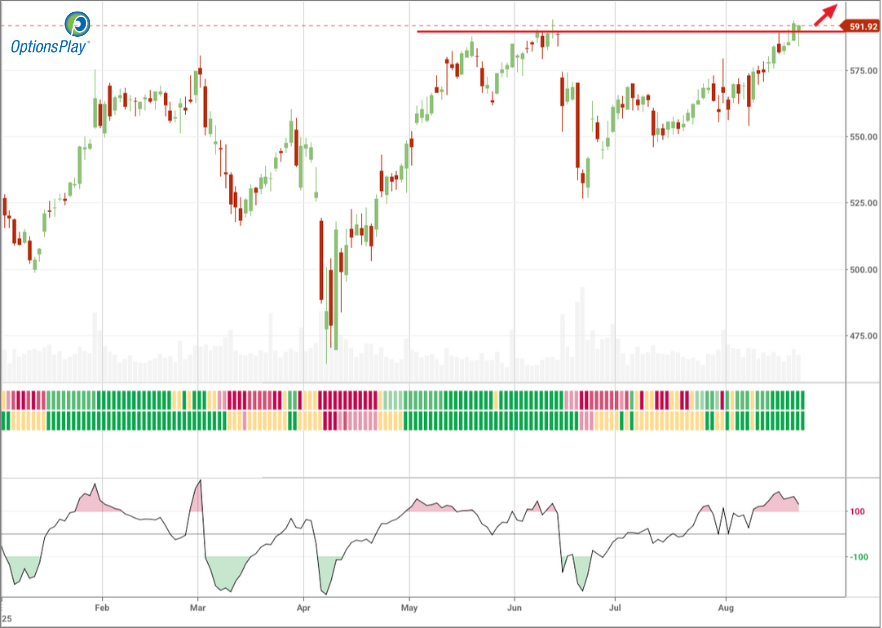
Technical Analysis
Mastercard (MA) recently surpassed the critical $590 resistance level, gaining new momentum after a summer of consolidation. The stock is trading above its 20-day, 50-day, and 200-day moving averages, supporting a positive trend. RSI at ~66 indicates bullish momentum without overbought signals. This breakout, alongside outperformance against the S&P 500, suggests potential to rise further.
Fundamental Analysis
Mastercard’s fundamentals remain robust, with valuation justified by superior growth and profitability metrics relative to industry peers:
- Forward PE Ratio: 36.21x vs. Industry Median 12.53x
- Expected EPS Growth: 14.95% vs. Industry Median 13.30%
- Expected Revenue Growth: 13.10% vs. Industry Median 6.54%
- Net Margins: 44.93% vs. Industry Median 18.67%
Options Trade
A straightforward way to express bullish exposure is via a call option. The recommended trade is to buy the MA October 3, 2025 $585 call at $20.30 (~$2,030 per contract). This strike sits just below current levels, providing a slightly in-the-money position with strong delta exposure to upside. The risk is limited to the $2,030 premium paid, while upside remains unlimited should MA continue its breakout toward and above the $640 target. This setup provides defined risk with leveraged upside participation, making it an efficient vehicle to express a bullish view.
MA – Daily
Trade Details
Strategy Details
Strategy: Long Call
Direction: Bullish Call
Details: Buy to Open 1 MA Oct 03 $585 Call @ $20.30 Debit per Contract.
Total Risk: This trade has a max risk of $2,030 (1 Contract x $2,030) based on a hypothetical $100k portfolio risking 2%. We suggest risking only 2% of the value of your portfolio and divide it by $2,030 to select the # contracts for your portfolio.
Trend Continuation Signal: This is a bullish trade on a stock that is expected to continue higher over the duration of this trade.
1M/6M Trends: Bullish/Bullish
Relative Strength: 8/10
OptionsPlay Score: 85
Stop Loss: @ $10.15 (50% loss of premium)
View MA Trade
Entering the Trade
Use the following details to enter the trade on your trading platform. Please note that whenever there is a multi-leg option strategy, it should be entered as a single trade.
PLEASE NOTE that these prices are based on Thursday’s closing prices. Should the underlying move significantly during the pre-market hours, we will likely adjust the strikes and prices to reflect a more accurate trade entry.
View MA Trade
PM

DailyPlay – Opening Trade (PM) – August 21, 2025
PM Bearish Opening Trade Signal
Investment Rationale
Investment Thesis
With a premium valuation and softening margins, Philip Morris International offers limited upside while carrying heightened downside risk. The company’s inability to sustain profitability growth at levels that justify its multiple leaves shares vulnerable, particularly as price action continues to reject higher levels. This alignment of weak fundamentals and technical resistance supports a bearish stance.
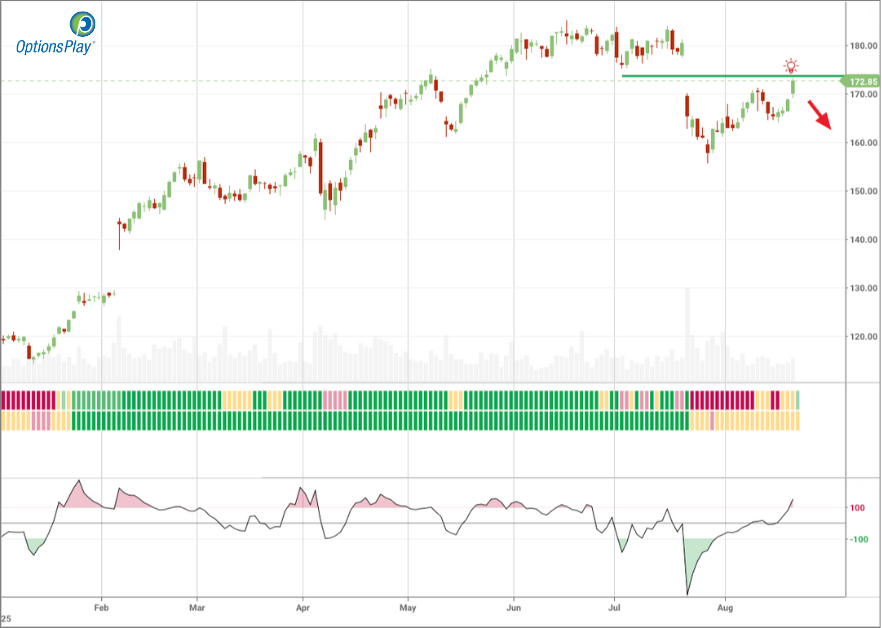
Technical Analysis
The recent bounce in PM has stalled at the 50-day moving average, underscoring the lack of follow-through from buyers. The move fits the pattern of a counter-trend rally within a broader downtrend, rather than a true reversal. A decisive break of the $160 support level could act as a catalyst for accelerated selling, opening the door to a retest of $130 and confirming the bearish setup.
Fundamental Analysis
Philip Morris maintains stronger revenue and earnings growth than industry averages, but its valuation premium and weaker margins highlight a disconnect. Investors are paying a higher multiple for growth that may already be priced in, while profitability lags peers. This imbalance increases downside risk should growth expectations disappoint.
- Forward PE Ratio: 22.03x vs. Industry Median 17.36x
- Expected EPS Growth: 11.80% vs. Industry Median 7.57%
- Expected Revenue Growth: 7.84% vs. Industry Median 3.68%
- Net Margins: 21.08% vs. Industry Median 32.23%
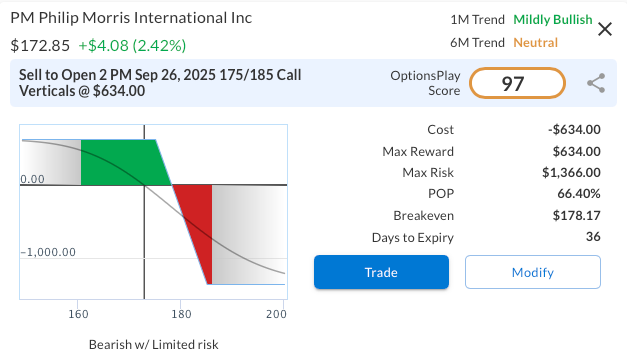
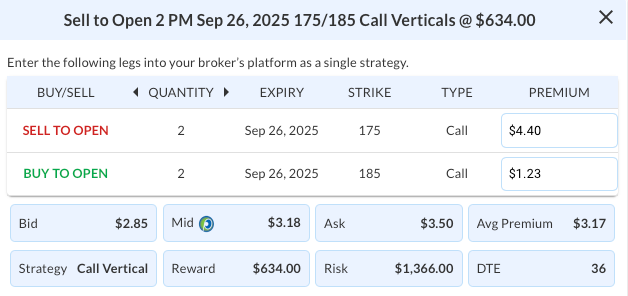
Options Trade
To capture downside while defining risk, consider the Sep 26, 2025 175/185 call credit spread. This trade sells the 175 strike call and buys the 185 strike call for a net credit of $3.17, offering a maximum reward of $317 against a maximum risk of $683 per contract. The position profits if PM stays below $175, aligning with the expectation that resistance near the 50-day moving average holds. The structure provides favorable risk/reward and defined risk while taking advantage of bearish technical and fundamental signals.
PM – Daily
Trade Details
Strategy Details
Strategy: Short Call Vertical Spread
Direction: Bearish Credit Spread
Details: Sell to Open 2 PM Sep 26 $175/$185 Call Vertical Spreads @ $3.17 Credit per Contract.
Total Risk: This trade has a max risk of $1,366 (2 Contract x $683) based on a hypothetical $100k portfolio risking 2%. We suggest risking only 2% of the value of your portfolio and divide it by $683 to select the # contracts for your portfolio.
Trend Continuation Signal: This is a bearish trade on a stock that is expected to continue lower over the duration of this trade.
1M/6M Trends: Mildly Bullish/Neutral
Relative Strength: 9/10
OptionsPlay Score: 97
Stop Loss: @ $6.34 (100% loss to value of premium)
View PM Trade
Entering the Trade
Use the following details to enter the trade on your trading platform. Please note that whenever there is a multi-leg option strategy, it should be entered as a single trade.
PLEASE NOTE that these prices are based on Wednesday’s closing prices. Should the underlying move significantly during the pre-market hours, we will likely adjust the strikes and prices to reflect a more accurate trade entry.
View PM Trade
PINS, MS
DailyPlay – Closing Trade (PINS, MS) – August 20, 2025
Closing Trade
- PINS – 98% loss: Sell to Close 8 Contracts (or 100% of your Contracts) Aug 29 $38/$45 Call Vertical Spreads @ $0.05 Credit. DailyPlay Portfolio: By Closing 8 Contracts, we will be collecting $40. We initially opened these 8 contracts on August 05 @ $2.20 Debit. Our loss, therefore, is $215 per contract.
- MS – 17% loss: Sell to Close 2 Contracts (or 100% of your Contracts) Aug 29 $140/$150 Call Vertical Spreads @ $4.85 Credit. DailyPlay Portfolio: By Closing 2 Contracts, we will be collecting $970. We adjusted the short call on Aug 01 reducing our cost basis to $1,162 Debit. Our loss, therefore, is $96 per contract.
LOW
DailyPlay – Opening Trade (LOW) – August 19, 2025
LOW Bullish Opening Trade Signal
Investment Rationale
Investment Thesis
We have a bullish outlook on Lowe’s (LOW) as the company approaches its earnings report on August 20th. The recent breakout above key resistance suggests improving investor sentiment, with shares now trading in alignment with broader market strength. With Home Depot reporting ahead of Lowe’s, sector sentiment could act as an early catalyst. A strong Lowe’s earnings print would reinforce the breakout and position the stock for continuation toward our $265 upside target.
Technical Analysis
LOW has staged a notable recovery, breaking above its $235 resistance level and now trading firmly above the 20-day, 50-day, and 200-day moving averages. The stock’s momentum has accelerated in recent weeks, reflecting strong relative performance against the S&P 500. The RSI sits near overbought territory but remains supportive of sustained upside, particularly given the sharp improvement in trend structure.The 200-day moving average now serves as a critical support level near $240, while the breakout structure creates a clear pathway toward $265 should earnings act as the next upside catalyst.
Fundamental Analysis
Lowe’s valuation remains modestly discounted relative to peers, despite comparable growth prospects and stronger profitability metrics. This relative undervaluation, coupled with earnings momentum and resilient demand in the home improvement category, provides a constructive setup for further upside.
- Forward PE Ratio: 20.57x vs. Industry Median 23.35x
- Expected EPS Growth: 7.21% vs. Industry Median 7.18%
- Expected Revenue Growth: 2.86% vs. Industry Median 3.75%
- Net Margins: 8.22% vs. Industry Median 6.55%
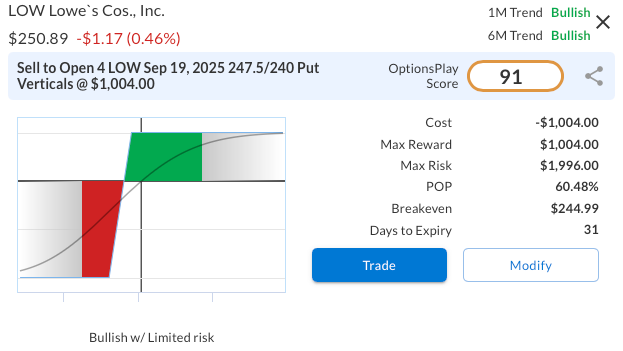
Options Trade
We recommend a bullish put credit spread to position for continued upside while taking advantage of elevated implied volatility ahead of earnings. Specifically, selling the Sep 19, 2025 $247.5/$240 put spread for a net credit of $2.51. The trade risks $499 to make a maximum reward of $251, offering a 50% potential return on risk. This strategy profits if LOW holds above $247.50 into expiration, aligning with our bullish outlook that earnings strength will reinforce momentum and sustain prices above key support levels.
LOW – Daily
Trade Details
Strategy Details
Strategy: Short Put Vertical Spread
Direction: Bullish Credit Spread
Details: Sell to Open 4 LOW Sep 19 $247.50/$240 Put Vertical Spreads @ $2.51 Credit per Contract.
Total Risk: This trade has a max risk of $1,996 (4 Contracts x $499) based on a hypothetical $100k portfolio risking 2%. We suggest risking only 2% of the value of your portfolio and divide it by $499 to select the # contracts for your portfolio.
Trend Continuation Signal: This is a bullish trade on a stock that is expected to continue higher over the duration of this trade.
1M/6M Trends: Bullish/Bullish
Relative Strength: 8/10
OptionsPlay Score: 91
Stop Loss: @ $5.02 (100% loss to value of premium)
View LOW Trade
Entering the Trade
Use the following details to enter the trade on your trading platform. Please note that whenever there is a multi-leg option strategy, it should be entered as a single trade.
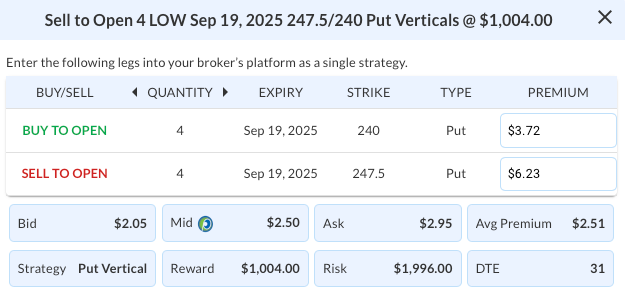
PLEASE NOTE that these prices are based on Monday’s closing prices. Should the underlying move significantly during the pre-market hours, we will likely adjust the strikes and prices to reflect a more accurate trade entry.
View LOW Trade

DailyPlay – Portfolio Review – August 18, 2025
DailyPlay Portfolio Review
Our Trades
AMZN – 32 DTE
Bullish Credit Spread – Amazon.com, Inc. (AMZN) – We recently established this position and we plan to stay the course for now.
GOOGL – 18 DTE
Bullish Credit Spread – Alphabet Inc. (GOOGL) – The position remains profitable. Bullish momentum continued last week, with GOOGL trading above all major moving averages. The 20-day moving average is acting as short-term support, so we plan to continue holding the trade.
GS – 151 DTE
Bullish Long Call – Goldman Sachs Group, Inc. (GS) – We recently established this position and we plan to stay the course for now.
MS – 11 DTE
Bullish Debit Spread – Morgan Stanley (MS) – The position is currently at a slight loss. We made an adjustment a few weeks ago to reduce overall risk, and with expiration drawing near, we will continue holding but will monitor it closely.
PINS – 11 DTE
Bullish Call Spread – Pinterest, Inc. (PINS) – The stock fell sharply following the company’s earnings announcement. The position is down near its maximum loss, and since we did not have the opportunity to close at the 50% stop loss, we may allow the position to run its course.
SCHW – 151 DTE
Bullish Long Call – Charles Schwab Corp. (SCHW) – We continue to see upside potential, supported by strong fundamentals and resilience in the financial sector. We closed our initial long call position once the option’s delta hit 1.00, then shifted into a higher strike call with a 0.80 delta and a later expiration. We plan to hold steady with this adjustment.
AMZN
DailyPlay – Opening Trade (AMZN) & Closing Trade (LOW) – August 15, 2025
Closing Trade
- LOW – 50% gain: Buy to Close 6 Contracts (or 100% of your Contracts) Sep 12 $235/$230 Put Vertical Spreads @ $0.65 Debit. DailyPlay Portfolio: By Closing 6 Contracts, we will be paying $390. We initially opened these 6 contracts on Aug 12 @ $1.31 Credit. Our gain, therefore, is $396.
AMZN Bullish Opening Trade Signal
Investment Rationale
Investment Thesis
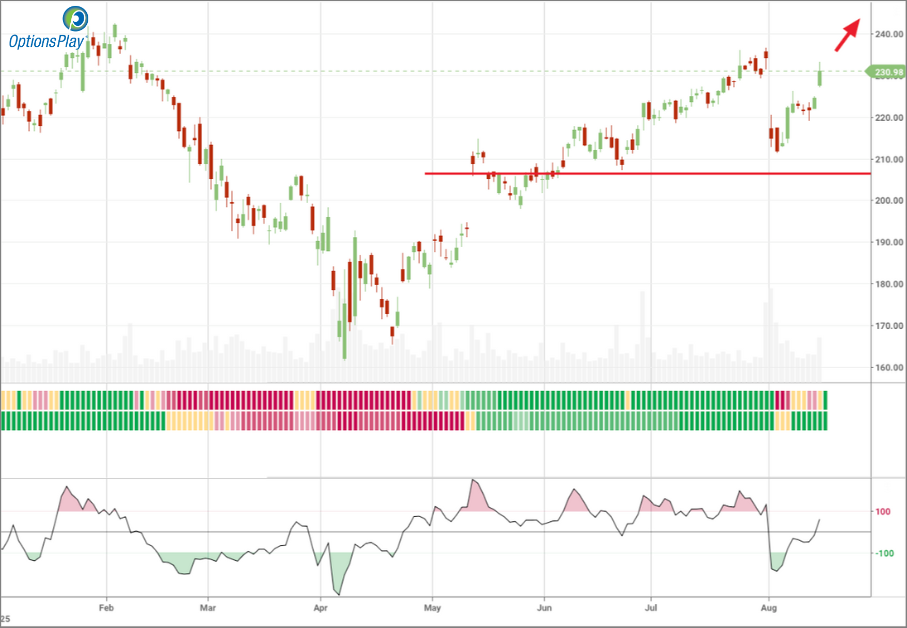
Amazon (AMZN) continues to show strong upside momentum supported by both technical resilience and robust fundamental positioning. The company’s ongoing expansion into AI-driven services, coupled with its leadership in e-commerce and cloud infrastructure, positions it to outperform in the coming quarters. While valuations are elevated relative to peers, Amazon’s superior growth profile and operational leverage justify the premium. With the stock recently reclaiming key resistance levels, a bullish stance remains compelling heading into late Q3 and early Q4.
Technical Analysis
Price action in AMZN has accelerated, with the stock breaking above prior highs and holding firmly above its 20-day, 50-day, and 200-day moving averages—clear confirmation of sustained bullish control. The rising 200-day MA remains well below current levels, underscoring the strength of the longer-term uptrend. RSI is hovering near 69, reflecting strong momentum without yet signaling overbought extremes. The recent breakout also filled the August 1st gap, adding further technical conviction. The next key hurdle is the recent high just above $236; a decisive breakout there could set the stage for a sustained move toward the $260 target zone if momentum persists.
Fundamental Analysis:
Amazon’s valuation premium is underpinned by earnings growth acceleration, cloud market dominance, and strategic investments in AI. The company’s above-average profitability and revenue expansion offer a competitive advantage, even in a higher-rate environment.
- Forward PE Ratio: 35.95x vs. Industry Median 23.35x
- Expected EPS Growth: 16.37% vs. Industry Median 7.18%
- Expected Revenue Growth: 9.48% vs. Industry Median 3.75%
- Net Margins: 10.54% vs. Industry Median 6.55%
Options Trade
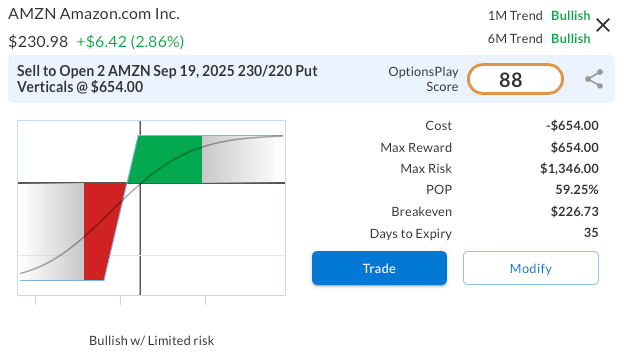
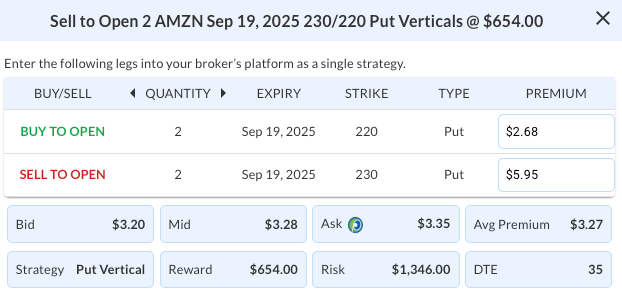
Consider selling the AMZN Sep 19, 2025 230/220 Put Vertical for a $3.27 credit. This trade risks $673 to make a maximum profit of $327, offering a 48.6% return on risk if AMZN remains above $230 at expiration. Structuring it as a short put spread limits downside exposure while still benefiting from time decay and the underlying bullish trend.
AMZN – Daily
Trade Details
Strategy Details
Strategy: Short Put Vertical Spread
Direction: Bullish Credit Spread
Details: Sell to Open 2 AMZN Sep 19 $230/$220 Put Vertical Spreads @ $3.27 Credit per Contract.
Total Risk: This trade has a max risk of $1,346 (2 Contracts x $673) based on a hypothetical $100k portfolio risking 2%. We suggest risking only 2% of the value of your portfolio and divide it by $673 to select the # contracts for your portfolio.
Trend Continuation Signal: This is a bullish trade on a stock that is expected to continue higher over the duration of this trade.
1M/6M Trends: Bullish/Bullish
Relative Strength: 5/10
OptionsPlay Score: 88
Stop Loss: @ $6.54 (100% loss to value of premium)
View AMZN Trade
Entering the Trade
Use the following details to enter the trade on your trading platform. Please note that whenever there is a multi-leg option strategy, it should be entered as a single trade.
PLEASE NOTE that these prices are based on Thursday’s closing prices. Should the underlying move significantly during the pre-market hours, we will likely adjust the strikes and prices to reflect a more accurate trade entry.
View AMZN Trade
GS
DailyPlay – Opening Trade (GS) – August 14, 2025
GS Bullish Opening Trade Signal
Investment Rationale
Investment Thesis
Goldman Sachs (GS) remains well-positioned for long-term growth following its strategic restructuring, which has sharpened focus on core revenue drivers and improved operational efficiency. The firm’s dominant capital markets franchise, combined with an experienced management team and disciplined execution, provides a competitive advantage in navigating cyclical and regulatory shifts. A gradually improving macroeconomic environment supports expansion in deal-making, lending, and trading activity, while potential easing in M&A regulation could unlock additional upside by lowering compliance costs and accelerating deal approvals. Together, these factors reinforce GS’s potential to deliver strong shareholder returns over the coming years.
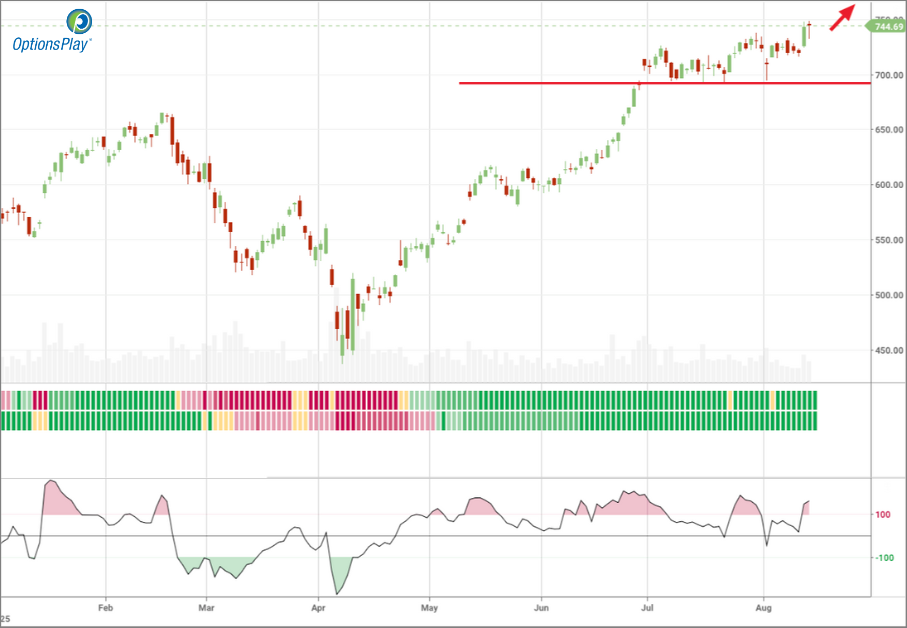
Technical Analysis
GS shares have been in a steady uptrend since May 2025, consistently trading above the 20-day, 50-day, and 200-day moving averages, highlighting strong short- and long-term momentum. After a robust rally from the mid-$600s, the stock recently consolidated around $745, reflecting a healthy pause to absorb gains before a potential breakout. The 200-day moving average continues its upward trajectory, reinforcing the long-term bullish outlook and acting as a key support level. With the RSI at 66, the stock is approaching overbought territory but remains below critical thresholds, indicating room for further upside if buying pressure persists. A decisive move above recent highs could propel GS to new all-time highs.
Fundamental Analysis
GS’s fundamentals highlight a mix of operational efficiency, earnings strength, and disciplined capital allocation. The firm has delivered consistent earnings beats in recent quarters, supported by resilient trading revenue and recovering investment banking activity. Its profitability metrics outpace most peers, aided by strong cost controls and high-margin businesses. Additionally, valuation remains attractive relative to the sector despite the recent price appreciation.
- Forward PE Ratio: 13.64 vs. Industry Median 15.20
- Expected EPS Growth: 11.79% vs. Industry Median 11.90%
- Expected Revenue Growth: 4.90% vs. Industry Median 7.01%
- Net Margins: 27.68% vs. Industry Median 21.10%
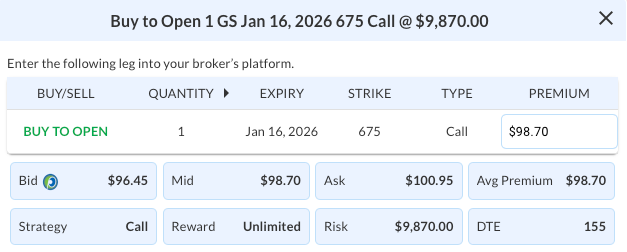
Options Trade
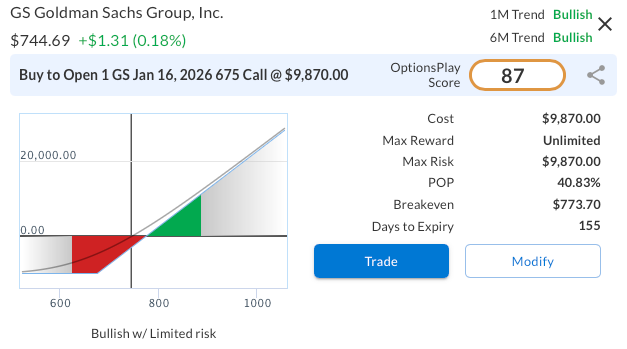
A long-dated call option provides leveraged exposure to GS’s long-term growth potential while capping downside risk to the premium paid. The suggested trade is to Buy to Open 1 GS Jan 16, 2026 675 Call @ $98.70 for a total cost of $9,870. This deep-in-the-money call offers high delta exposure, effectively mimicking stock ownership with significantly reduced capital requirements. The strike price sits well below current levels, providing intrinsic value and lowering the breakeven to $773.70 by expiration. Risk is limited to the premium paid, while upside remains unlimited if GS continues its uptrend over the next 17 months, particularly if macro tailwinds and M&A activity accelerate.
And then below we have an alternative trade for those who are not looking for a stock replacement and just want pure options exposure to GS.
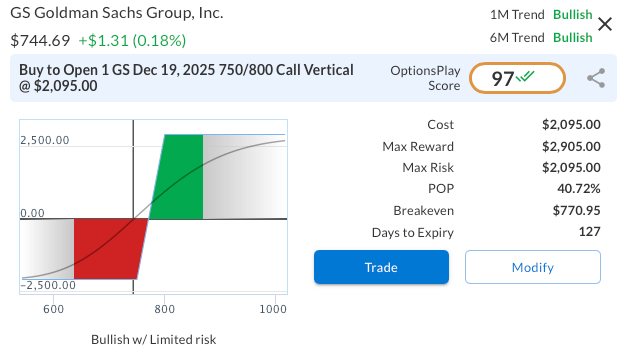
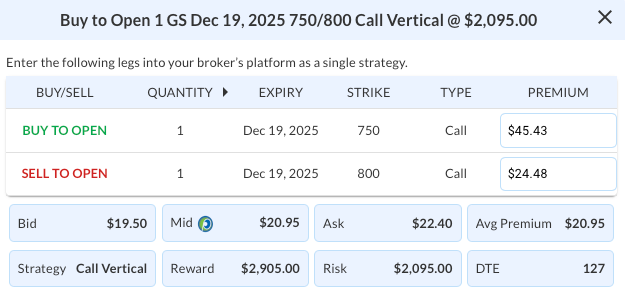
Alternate Options Trade
This trade is a GS Dec 19, 2025 750/800 Call Vertical Spread, entered for a net debit of $2,095. It involves buying the 750 strike call for $45.43 and selling the 800 strike call for $24.48, creating a bullish position with defined risk and reward. The maximum profit potential is $2,905 if GS closes at or above $800 at expiration, while the maximum loss is the initial debit of $2,095. This gives a reward-to-risk ratio of about 1.39:1. With 127 days to expiration, the trade benefits from upward movement toward the $800 strike.
GS – Daily
Trade Details
Strategy: Long Call
Direction: Bullish Call
Details: Buy to Open 1 GS Jan 16 $675 Call @ $98.70 Debit per Contract.
Total Risk: This trade has a max risk of $9,870 (1 Contract x $9,870) roughly 13% of buying 100 shares of GS. We suggest using this longer dated call option as a more capital efficient way to capture upside using options.
Trend Continuation Signal: This is a bullish trade on a stock that is expected to continue higher over the duration of this trade.
1M/6M Trends: Bullish/Bullish
Relative Strength: 9/10
OptionsPlay Score: 87
Stop Loss: If GS is below $675 (strike price) close the trade.
Alternate Trade Details
Strategy: Long Call Vertical Spread
Direction: Bullish Debit Spread
Details: Buy to Open 1 GS Dec 19 $750/$800 Call Vertical Spreads @ $20.95 Debit per Contract.
Total Risk: This trade has a max risk of $2,095 (1 Contract x $2,095) based on a hypothetical $100k portfolio risking 2%. We suggest risking only 2% of the value of your portfolio and divide it by $2,095 to select the # contracts for your portfolio.
Trend Continuation Signal: This is a bullish trade on a stock that is expected to continue higher over the duration of this trade.
1M/6M Trends: Bullish/Bullish
Relative Strength: 9/10
OptionsPlay Score: 97
Stop Loss: @ $10.48 (50% loss of premium)
View GS Trade
View Alternate GS Trade
Entering the Trade
Use the following details to enter the trade on your trading platform. Please note that whenever there is a multi-leg option strategy, it should be entered as a single trade.
View GS Trade
View Alternate GS Trade
PLEASE NOTE that these prices are based on Wednesday’s closing prices. Should the underlying move significantly during the pre-market hours, we will likely adjust the strikes and prices to reflect a more accurate trade entry.
GS
DailyPlay – Closing Trade (GS) – August 13, 2025
- GS – 97% gain: Sell to Close 1 Contract (or 100% of your Contracts) Aug 22 $695/$730 Call Vertical Spreads @ $29.97 Credit. DailyPlay Portfolio: By Closing 1 Contract, we will be collecting $2,997. We adjusted the short call on August 08 reducing our cost basis to $1,523 Debit. Our gain, therefore, is $1,474.
LOW
DailyPlay – Opening Trade (LOW) & Closing Trade (XYZ, MU) – August 12, 2025
Closing Trade
- XYZ – 60% loss: Sell to Close 5 Contracts (or 100% of your Contracts) Aug 29 $75/$85 Call Vertical Spreads @ $1.57 Credit. DailyPlay Portfolio: By Closing 5 Contracts, we will be collecting $785. We initially opened these 5 contracts on August 07 @ $3.93 Debit. Our loss, therefore, is $236 per contract.
- MU – 80% gain: Buy to Close 6 Contracts (or 100% of your Contracts) Aug 29 $109/$104 Put Vertical Spreads @ $0.40 Debit. DailyPlay Portfolio: By Closing 6 Contracts, we will be paying $240. We initially opened these 6 contracts on July 24 @ $1.98 Credit. Our gain, therefore, is $948.
LOW Bullish Opening Trade Signal
Investment Rationale
Investment Thesis
Lowe’s Companies, Inc. (LOW) is entering earnings season with strong relative performance and a favorable valuation backdrop. The stock has recently cleared a key resistance level, reflecting renewed investor confidence ahead of its August 20th report. With management continuing to drive operational efficiency and market share gains, LOW appears well positioned to extend its current momentum into the fall. The combination of technical strength, fundamental resilience, and a modest valuation discount supports a bullish stance into earnings and beyond.
Technical Analysis
Lowe’s recent breakout above the $235 resistance level marks an important shift in sentiment, with the stock now trading above both short- and intermediate-term moving averages while challenging its 200-day moving average. The uptrend has been reinforced by a series of higher lows since May, and relative strength remains favorable compared to the S&P 500. The RSI near 65 reflects healthy bullish momentum without signaling overbought conditions. A strong earnings catalyst could accelerate this trend, creating a clear path toward our $265 upside target.
Fundamental Analysis
Lowe’s valuation remains modestly below industry norms while profitability metrics remain superior. Continued operational execution, paired with a disciplined cost structure, provides a cushion against potential macro headwinds. Earnings growth is in line with peers, and revenue growth, though modest, is supported by steady demand in home improvement and construction markets.
- Forward PE Ratio: 19.66x vs. Industry Median 23.35x
- Expected EPS Growth: 7.62% vs. Industry Median 7.18%
- Expected Revenue Growth: 2.75% vs. Industry Median 3.75%
- Net Margins: 8.22% vs. Industry Median 6.55%
Options Trade
Selling the LOW Sep 12, 2025 235/230 Put Vertical at $2.02 offers an attractive risk/reward profile for bullish traders expecting the stock to hold above the $235 breakout zone post-earnings. The trade risks $298 to capture a maximum profit of $202, representing a reward-to-risk ratio of 0.68, meaning there’s potential to earn $0.68 for every $1.00 at risk if Lowe’s remains above $235 at expiration, 32 days from now. This setup benefits from both time decay and the potential for volatility contraction following earnings, while targeting a defined, favorable payoff if LOW maintains or builds on recent strength.
LOW – Daily

Trade Details
Strategy Details
Strategy: Short Put Vertical Spread
Direction: Bullish Credit Spread
Details: Sell to Open 6 LOW Sep 12 $235/$230 Put Vertical Spreads @ $2.02 Credit per Contract.
Total Risk: This trade has a max risk of $1,788 (6 Contracts x $298) based on a hypothetical $100k portfolio risking 2%. We suggest risking only 2% of the value of your portfolio and divide it by $298 to select the # contracts for your portfolio.
Trend Continuation Signal: This is a bullish trade on a stock that is expected to continue higher over the duration of this trade.
1M/6M Trends: Bullish/Bullish
Relative Strength: 5/10
OptionsPlay Score: 106
Stop Loss: @ $4.04 (100% loss to value of premium)
View LOW Trade

Entering the Trade
Use the following details to enter the trade on your trading platform. Please note that whenever there is a multi-leg option strategy, it should be entered as a single trade.

PLEASE NOTE that these prices are based on Monday’s closing prices. Should the underlying move significantly during the pre-market hours, we will likely adjust the strikes and prices to reflect a more accurate trade entry.