

BRK/B, CLF

OptionsPlay DailyPlay Ideas Menu – Jan 30th, 2026

💰 The Income Generators (High Probability, Cash Flow)
- BRK/B: Bull Put Vertical [Berkshire’s fortress balance sheet offers a defensive safe haven, with the recent dip providing a high-probability entry for income generation].
🚀 The Growth Seekers (Higher Risk, Max Reward)
- CLF: Bull Call Vertical [Cleveland-Cliffs is primed to capitalize on renewed infrastructure demand, making this dip in a bullish trend a compelling value play].
1. BRK/B ($476.36) – Betting on the Oracle’s Fortress
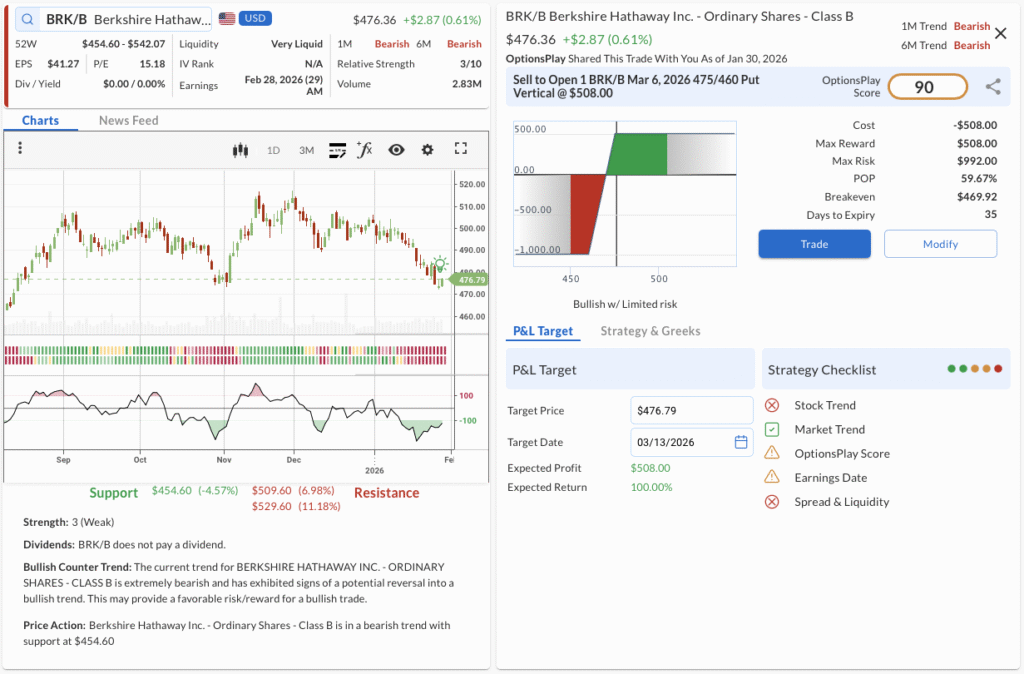
- The Trade: Sell to Open the BRK/B Mar 06 2026 475/460 Put Vertical @ $5.08 Credit.
- 🟢 BUY TO OPEN Mar 06, 2026 460 Put @ $4.22
- 🔴 SELL TO OPEN Mar 06, 2026 475 Put @ $9.30
- Trade Metrics: POP: 59.67% | Collect $508.00 per contract vs. a Max Risk of $992.00 (1.95:1).
- The Why: As macroeconomic uncertainty persists in early 2026, Berkshire Hathaway’s substantial cash reserves and diverse revenue streams provide a fundamental floor, making the stock an attractive counter-trend opportunity after recent selling pressure.
- The Technicals: While the long-term trend remains bearish, the stock has reached a critical support level near $454.60 and is exhibiting signs of an oversold reversal, offering a favorable risk/reward setup for a bullish counter-trend trade.
- Management:
- Stop Loss: Buy to Close the trade at $10.16 (Stop Loss @ 2.0x Credit).
- Take Profit: Buy to Close the trade at $2.54 (Take Profit @ 0.5x Credit).
2. CLF ($14.21) – Steel Strength on the Dip
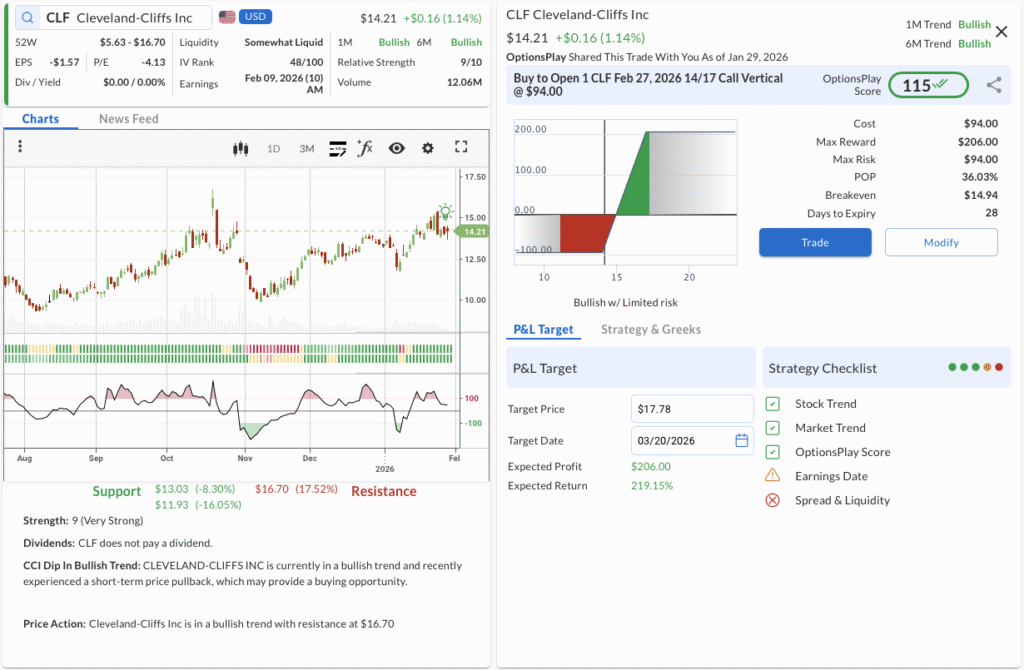
- The Trade: Buy to Open the CLF Feb 27 2026 14/17 Call Vertical @ $0.94 Debit.
- 🟢 BUY TO OPEN Feb 27, 2026 14 Call @ $1.34
- 🔴 SELL TO OPEN Feb 27, 2026 17 Call @ $0.40
- Trade Metrics: POP: 36.03% | Pay $94.00 per contract vs. a Max Reward of $206.00 (2.2:1).
- The Why: Cleveland-Cliffs remains a top pick in the materials sector due to robust automotive steel demand and operational efficiencies, suggesting the current price pullback is a temporary deviation in a fundamentally strong cycle.
- The Technicals: CLF is maintaining a strong 1M and 6M bullish trend, and the recent pullback to the $14.00 level represents a classic “buy the dip” technical setup within an established uptrend.
- Management:
- Stop Loss: Sell to Close the trade at $0.47 (Stop Loss @ 50% Debit).
- Take Profit: Sell to Close the trade at $1.65 (Take Profit @ 75% Debit).
LEU, TROW, NVDA
OptionsPlay DailyPlay Ideas Menu – Jan 29th, 2026
💰 The Income Generators (High Probability, Cash Flow)
- LEU: Put Vertical (Bull Put Spread) – The sole US-based uranium enricher capitalizing on the global nuclear renaissance.
- TROW: Put Vertical (Bull Put Spread) – Deep value asset manager offering reliable yield at a technical support floor.
🚀 The Growth Seekers (Higher Risk, Max Reward)
- NVDA: Call Vertical (Bull Call Spread) – AI infrastructure spending shows no signs of slowing ahead of the next earnings print.
🛡️ The Portfolio Protectors (Hedges & Bearish Bets)
- (No bearish trades featured today as markets show broad bullish resilience)
1. LEU ($337.88) – Nuclear Renaissance Powering Enrichment Demand
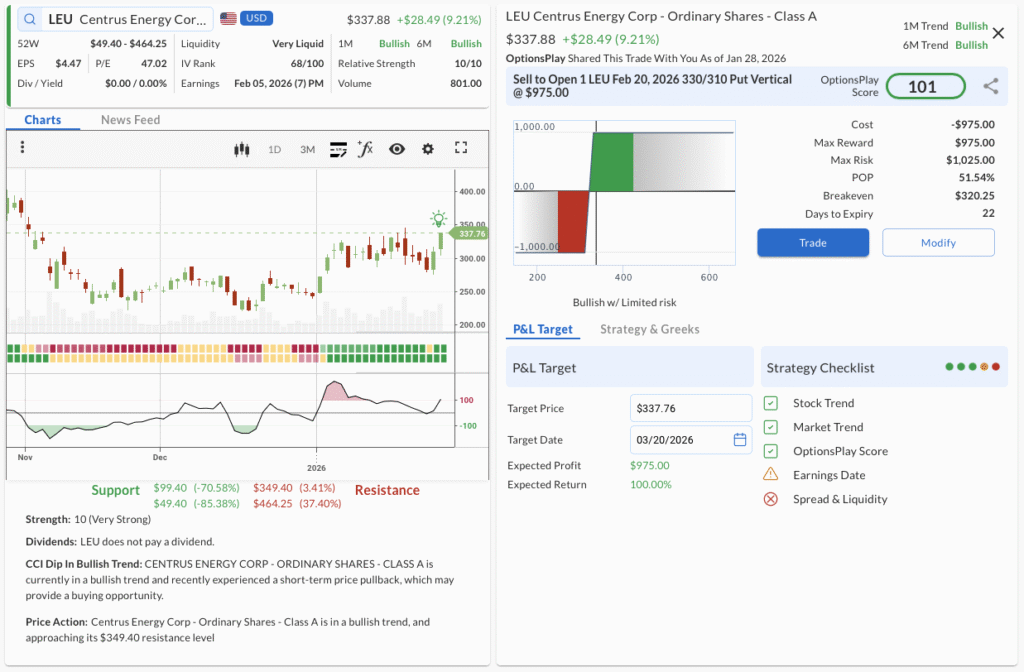
- The Trade:SELL TO OPEN the LEU Feb 20 2026 330/310 Put Vertical @ $9.75 Credit.
- 🔴 SELL TO OPEN Feb 20, 2026 330 Put @ $32.55
- 🟢 BUY TO OPEN Feb 20, 2026 310 Put @ $22.80
- Trade Metrics: POP: 51.54% | Collect $975 per contract vs. a Max Risk of $1,025 (1.05:1).
- The Why: Centrus Energy represents a critical choke point in the energy transition supply chain; as the primary domestic source for high-assay low-enriched uranium (HALEU), the company is uniquely positioned to benefit from bipartisan government support and increasing demand for next-generation nuclear reactors.
- The Technicals: The stock maintains a “Very Strong” (10/10) bullish trend rating and staged a pullback to the $300 zone, which aligns with previous resistance-turned-support, offering a strategic entry for trend continuation.
- Management:⚠️ Warning: Earnings is scheduled for Feb 05, 2026, which may require active management.
- Stop Loss: Buy to Close the trade at $19.50 (If premium doubles).
- Take Profit: Buy to Close the trade at $4.88 (Capture 50% of max profit).
2. TROW ($105.25) – Dividend Aristocrat Testing Key Support
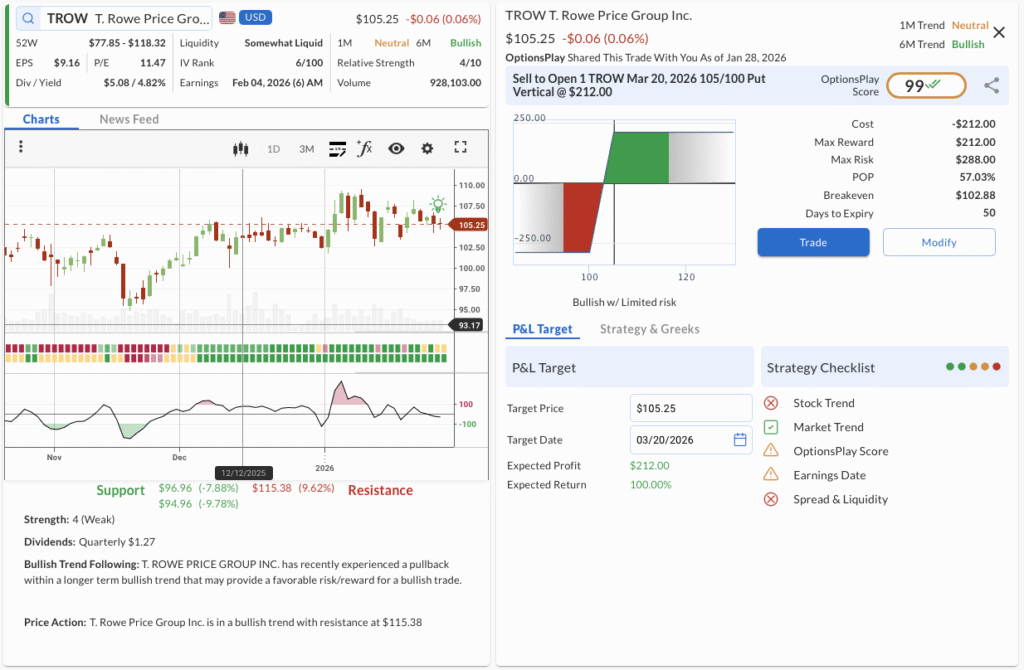
- The Trade:SELL TO OPEN the TROW Mar 20 2026 105/100 Put Vertical @ $2.12 Credit.
- 🔴 SELL TO OPEN Mar 20, 2026 105 Put @ $4.45
- 🟢 BUY TO OPEN Mar 20, 2026 100 Put @ $2.33
- Trade Metrics: POP: 57.03% | Collect $212 per contract vs. a Max Risk of $288 (1.36:1).
- The Why: T. Rowe Price remains a high-quality defensive play in the financial sector with zero debt and a robust dividend history; current valuations suggest the bad news regarding net outflows is priced in, favoring a mean reversion.
- The Technicals: While the 1-month trend is Neutral, the longer-term 6-month trend remains Bullish, and price action shows the stock respecting the $105 level as a firm support floor following a recent pullback.
- Management:⚠️ Warning: Earnings is scheduled for Feb 04, 2026, which may require active management.
- Stop Loss: Buy to Close the trade at $4.24 (If premium doubles).
- Take Profit: Buy to Close the trade at $1.06 (Capture 50% of max profit).
3. NVDA ($191.52) – Coiling for an AI-Driven Breakout
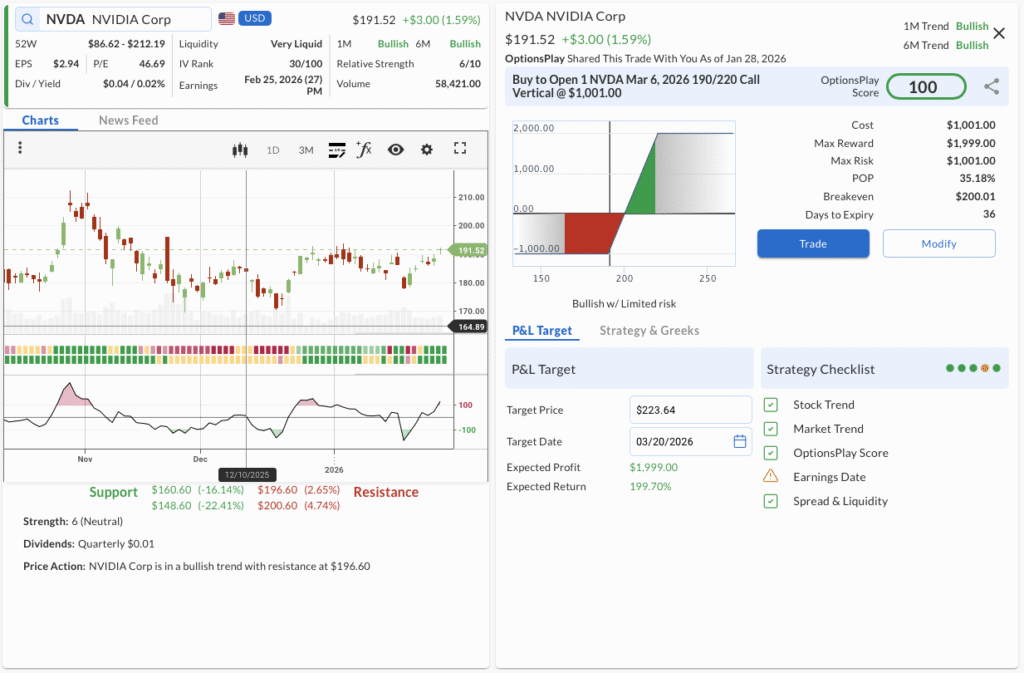
- The Trade:BUY TO OPEN the NVDA Mar 06 2026 190/220 Call Vertical @ $10.01 Debit.
- 🟢 BUY TO OPEN Mar 06, 2026 190 Call @ $12.08
- 🔴 SELL TO OPEN Mar 06, 2026 220 Call @ $2.07
- Trade Metrics: POP: 35.18% | Pay $1,001 per contract vs. a Max Reward of $1,999 (2.0:1).
- The Why: The hyperscaler capex cycle remains robust with insatiable demand for Blackwell chips; this trade positions for a pre-earnings run-up as the market anticipates another beat-and-raise quarter from the AI leader.
- The Technicals: NVIDIA is in a confirmed Bullish trend, currently consolidating tightly between $190 and $200; this “coiling” price action often precedes a high-velocity breakout to new highs.
- Management:⚠️ Warning: Earnings is scheduled for Feb 25, 2026, which may require active management.
- Stop Loss: Sell to Close the trade at $5.00 (Cut losses at 50% of debit).
- Take Profit: Sell to Close the trade at $17.52 (Target 75% gain).
MSI, LH, ITA
OptionsPlay DailyPlay Ideas Menu – Jan 28th, 2026
💰 The Income Generators (High Probability, Cash Flow)
- MSI: Put Vertical – Leveraging the stability of mission-critical communications for consistent income.
🚀 The Growth Seekers (Higher Risk, Max Reward)
- LH: Call Vertical – Capitalizing on the breakout momentum in the life sciences and diagnostics sector.
🛡️ The Portfolio Protectors (Hedges & Bearish Bets)
- ITA: Put Vertical – Hedging against a government shutdown affecting the aerospace and defense sector.
1. MSI ($406.08) – The Public Safety Income Play
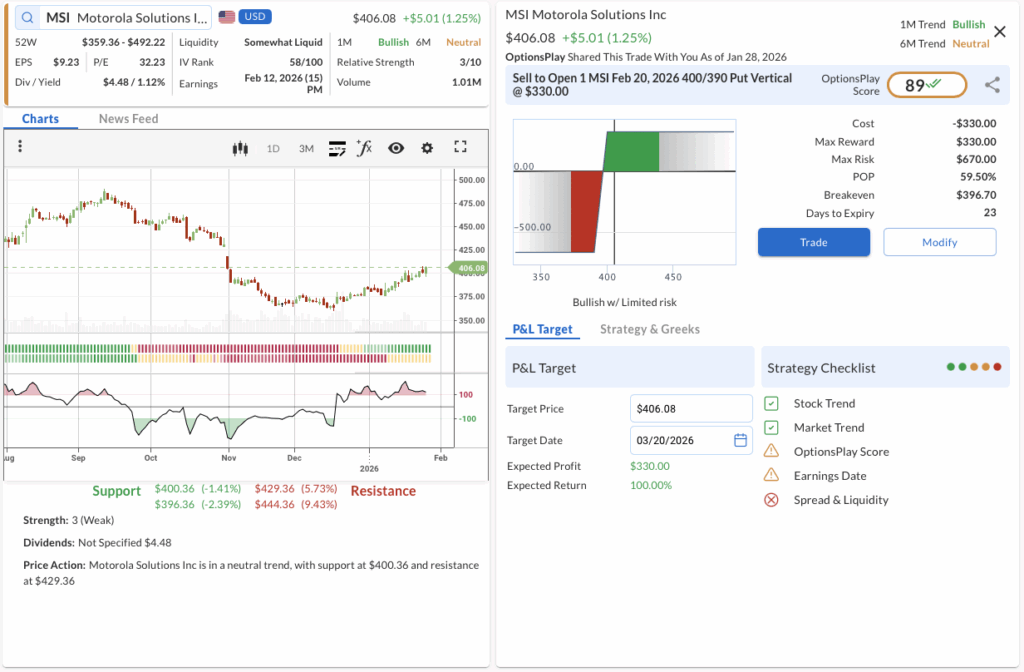
- The Trade:SELL TO OPEN the MSI Feb 20, 2026 400/390 Put Vertical @ $3.30 Credit.
- 🔴 SELL TO OPEN Feb 20, 2026 400 Put @ $9.80
- 🟢 BUY TO OPEN Feb 20, 2026 390 Put @ $6.50
- Trade Metrics: POP: 59.50% | Collect $330 per contract vs. a Max Risk of $670 (2.0:1).
- The Why: Motorola Solutions continues to dominate the public safety and enterprise security landscape; this trade generates income from their low-volatility, defensive cash flows while maintaining a buffer against minor pullbacks.
- The Technicals: The stock is consolidating in a neutral trend, but critically holding above the $400.36 support level, which aligns perfectly with our short strike to keep the trade profitable.
- Management:⚠️ Warning: Earnings is scheduled for Feb 12, 2026, which may require active management.
- Stop Loss: Buy to Close the trade at $6.60 (2.0x credit received).
- Take Profit: Buy to Close the trade at $1.65 (50% of max profit).
2. LH ($271.12) – The Diagnostics Breakout
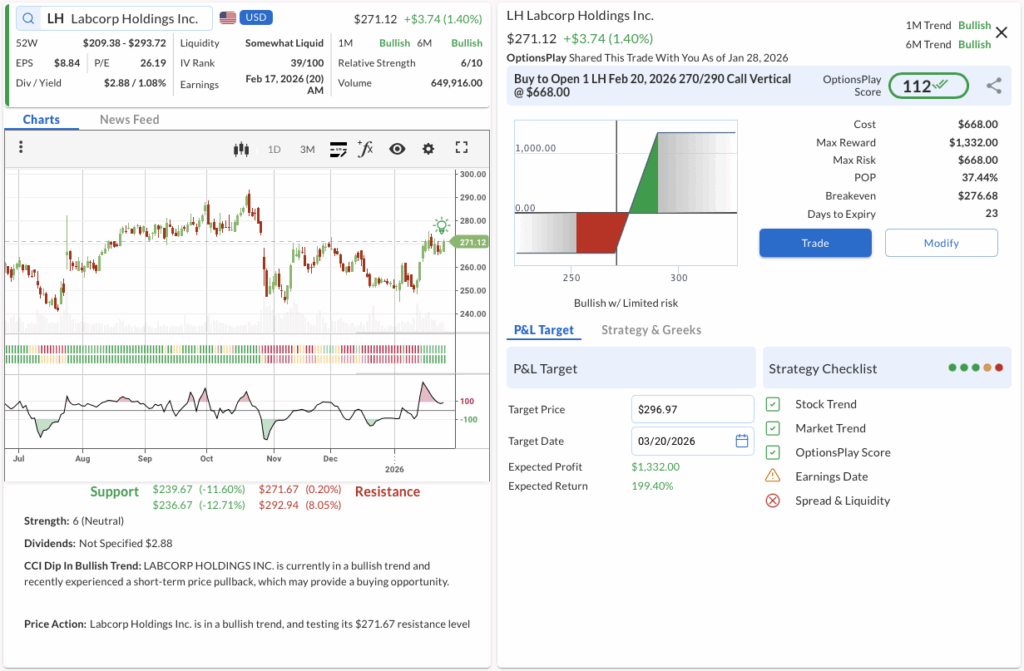
- The Trade:BUY TO OPEN the LH Feb 20, 2026 270/290 Call Vertical @ $6.68 Debit.
- 🟢 BUY TO OPEN Feb 20, 2026 270 Call
- 🔴 SELL TO OPEN Feb 20, 2026 290 Call
- Trade Metrics: POP: 37.44% | Pay $668 per contract vs. a Max Reward of $1,332 (2.0:1).
- The Why: Labcorp is positioned for growth as demand for diagnostic testing and drug development support stabilizes; we are using a vertical spread to capture upside while capping capital exposure.
- The Technicals: LH exhibits a strong bullish trend on both the 1M and 6M horizons, recently breaking above the $271.67 resistance level with improving relative strength.
- Management:
- Stop Loss: Sell to Close the trade at $3.34 (50% loss).
- Take Profit: Sell to Close the trade at $11.69 (75% gain).
3. ITA ($237.02) – The Defense Sector Hedge
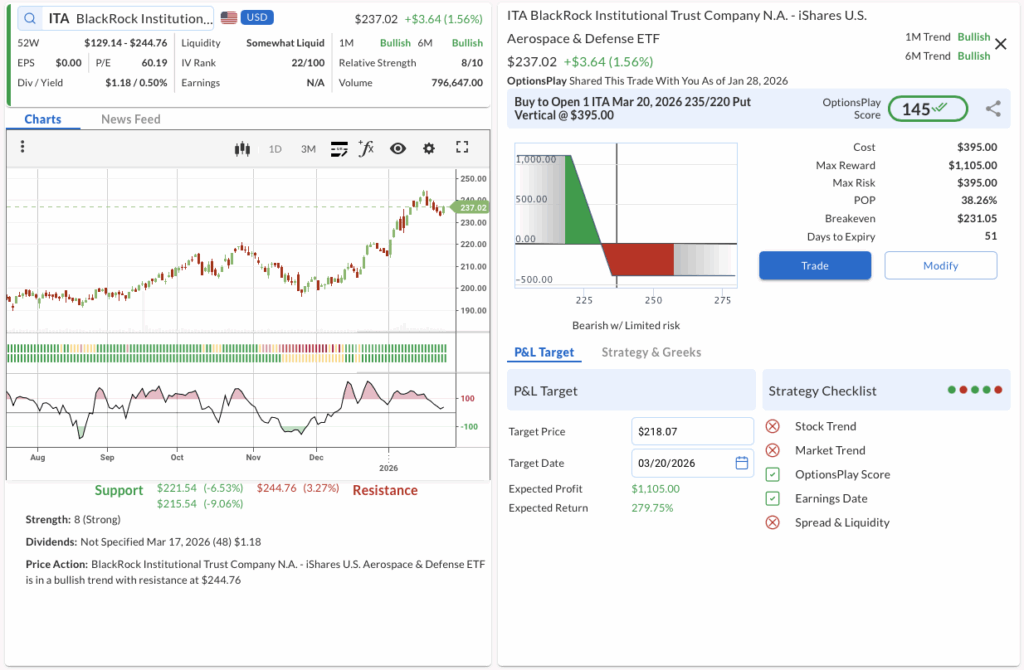
- The Trade:BUY TO OPEN the ITA Mar 20, 2026 235/220 Put Vertical @ $3.95 Debit.
- 🟢 BUY TO OPEN Mar 20, 2026 235 Put @ $6.90
- 🔴 SELL TO OPEN Mar 20, 2026 220 Put @ $2.95
- Trade Metrics: POP: 38.26% | Pay $395 per contract vs. a Max Reward of $1,105 (2.8:1).
- The Why: While the defense sector has run up, we are placing a tactical hedge to protect against valuation compression or profit-taking in major aerospace components.
- The Technicals: Although the primary trend is bullish, the price is testing resistance at $244.76, making this a high-reward counter-trend opportunity if the stock reverts toward the $220 range.
- Management:
- Stop Loss: Sell to Close the trade at $1.98 (50% loss).
- Take Profit: Sell to Close the trade at $6.91 (75% gain).
GILD, LIN, HUM
OptionsPlay DailyPlay Ideas Menu – Jan 27th, 2026
💰 The Income Generators (High Probability, Cash Flow)
- GILD: Bull Put Spread – Strong HIV franchise stability and oncology growth support a defensive income play.
- LIN: Bull Put Spread – Pricing power in industrial gases offers a high-probability floor for income generation.
🚀 The Growth Seekers (Higher Risk, Max Reward)
- HUM: Bull Call Spread – Medicare Advantage rate stabilization provides a tactical entry point following the recent pullback.
1. GILD ($137.78) – Bio-Pharma Defensive Income
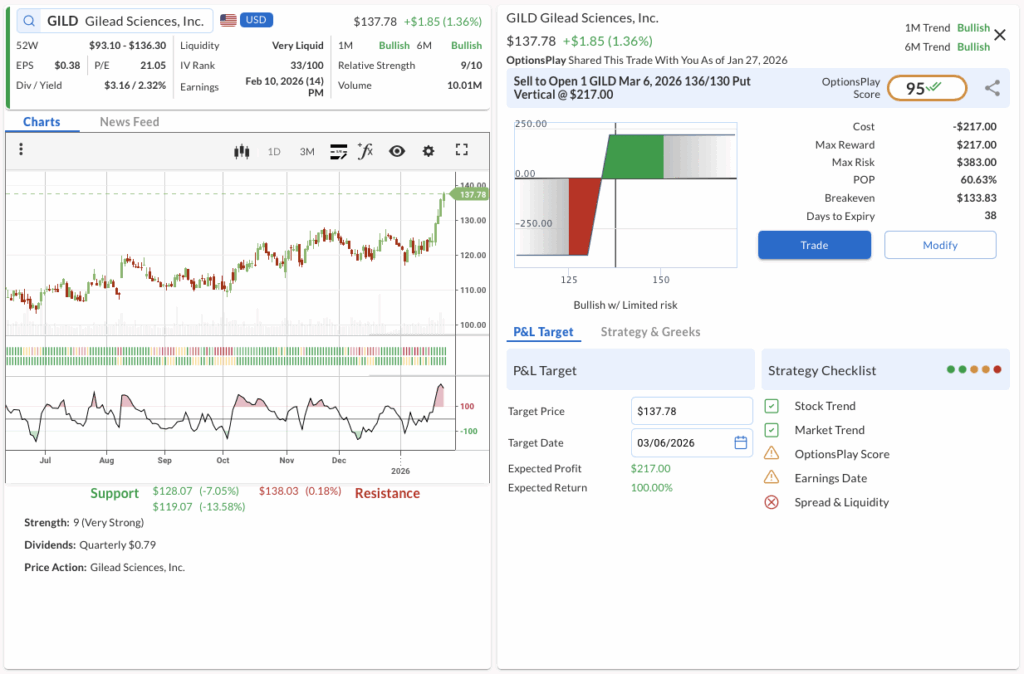
- The Trade:Sell to Open the GILD Mar 6 2026 136/130 Put Vertical @ $2.17 Credit.
- 🔴 SELL TO OPEN Mar 06 2026 136 Put @ $4.38
- 🟢 BUY TO OPEN Mar 06 2026 130 Put @ $2.21
- Trade Metrics: POP: 60.63% | Collect $217 per contract vs. a Max Risk of $383 (1.76:1).
- The Why: Gilead remains a robust defensive play with consistent cash flows from its HIV portfolio and expanding opportunities in oncology, making this dip an attractive setup for income generation.
- The Technicals: GILD is in a confirmed bullish trend across both 1M and 6M timeframes, currently consolidating near the $137 level; holding this support zone opens the path toward the $138.03 resistance level.
- Management:⚠️ Warning: Earnings is scheduled for Feb 10, 2026, which may require active management.
- Stop Loss: Buy to Close the trade at $4.34 (100% of credit received).
- Take Profit: Buy to Close the trade at $1.09 (50% gain).
2. LIN ($455.03) – Industrial Resilience
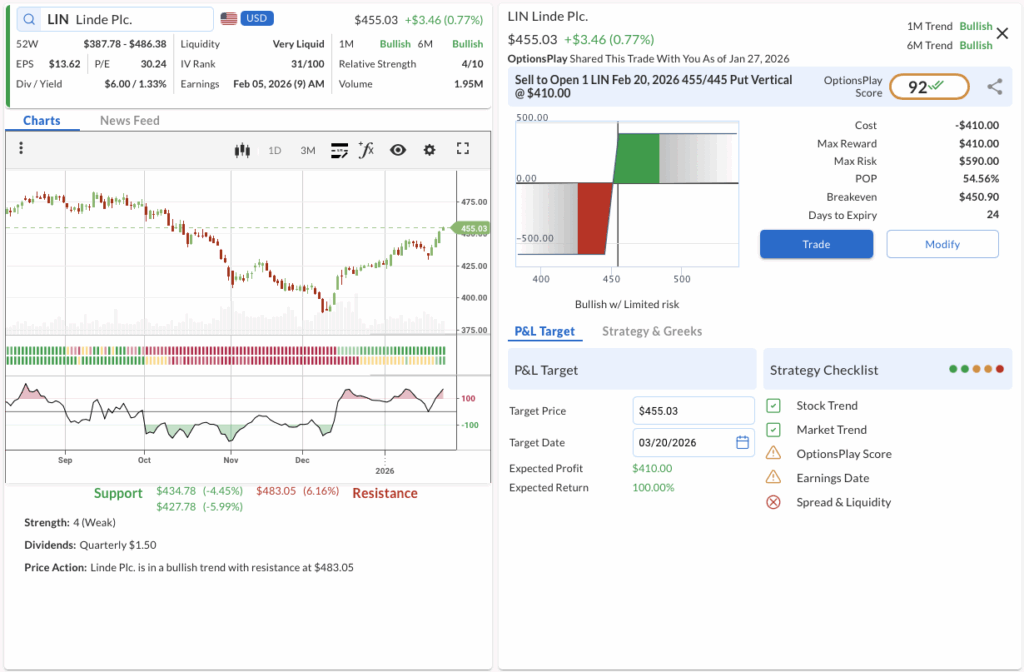
- The Trade:Sell to Open the LIN Feb 20 2026 455/445 Put Vertical @ $4.10 Credit.
- 🔴 SELL TO OPEN Feb 20 2026 455 Put @ $11.30
- 🟢 BUY TO OPEN Feb 20 2026 445 Put @ $7.20
- Trade Metrics: POP: 54.56% | Collect $410 per contract vs. a Max Risk of $590 (1.44:1).
- The Why: Linde’s dominant position in industrial gases allows it to pass through costs effectively, creating a stable fundamental backdrop that supports a high-probability credit strategy.
- The Technicals: The stock maintains a strong bullish trend and is currently hovering just above key support at $450; a successful defense of this level suggests a move back toward the $483 resistance.
- Management:⚠️ Warning: Earnings is scheduled for Feb 05, 2026, which may require active management.
- Stop Loss: Buy to Close the trade at $8.20 (100% of credit received).
- Take Profit: Buy to Close the trade at $2.05 (50% gain).
3. HUM ($263.63) – Trend Following Pullback
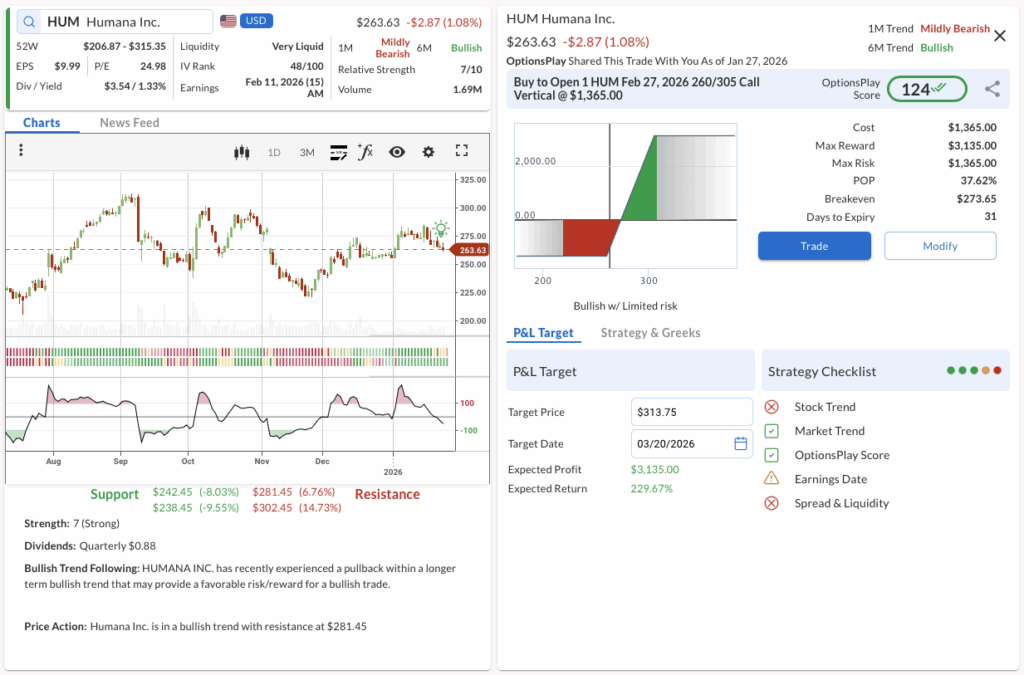
- The Trade:Buy to Open the HUM Feb 27 2026 260/305 Call Vertical @ $13.65 Debit.
- 🟢 BUY TO OPEN Feb 27 2026 260 Call @ $19.95
- 🔴 SELL TO OPEN Feb 27 2026 305 Call @ $6.30
- Trade Metrics: POP: 37.62% | Pay $1,365 per contract vs. a Max Reward of $3,135 (2.3:1).
- The Why: While the sector faces regulatory noise, the fundamental long-term thesis for managed care remains intact, and the current valuation compression offers a favorable risk/reward for a recovery rally.
- The Technicals: Despite a recent mildly bearish 1M trend, the 6M trend remains bullish; the “Bullish Trend Following” signal identifies the current pullback to the $260 support zone as a prime buying opportunity.
- Management:⚠️ Warning: Earnings is scheduled for Feb 11, 2026, which may require active management.
- Stop Loss: Sell to Close the trade at $6.83 (50% loss).
- Take Profit: Sell to Close the trade at $23.89 (75% gain).
AKAM, AMGN, BUD
OptionsPlay DailyPlay Ideas Menu – Jan 26th, 2026
💰 The Income Generators (High Probability, Cash Flow)
- AKAM: Bull Put Spread – Superior profitability suggests upside embedded in discounted valuation.
🚀 The Growth Seekers (Higher Risk, Max Reward)
- AMGN: Bull Call Spread – Robust pipeline and defensive characteristics support continued momentum.
🛡️ The Portfolio Protectors (Hedges & Bearish Bets)
- BUD: Bear Put Spread – Valuation headwinds and technical exhaustion point to a mean-reversion pullback.
1. AKAM ($95.08) – Discounted Valuation Play
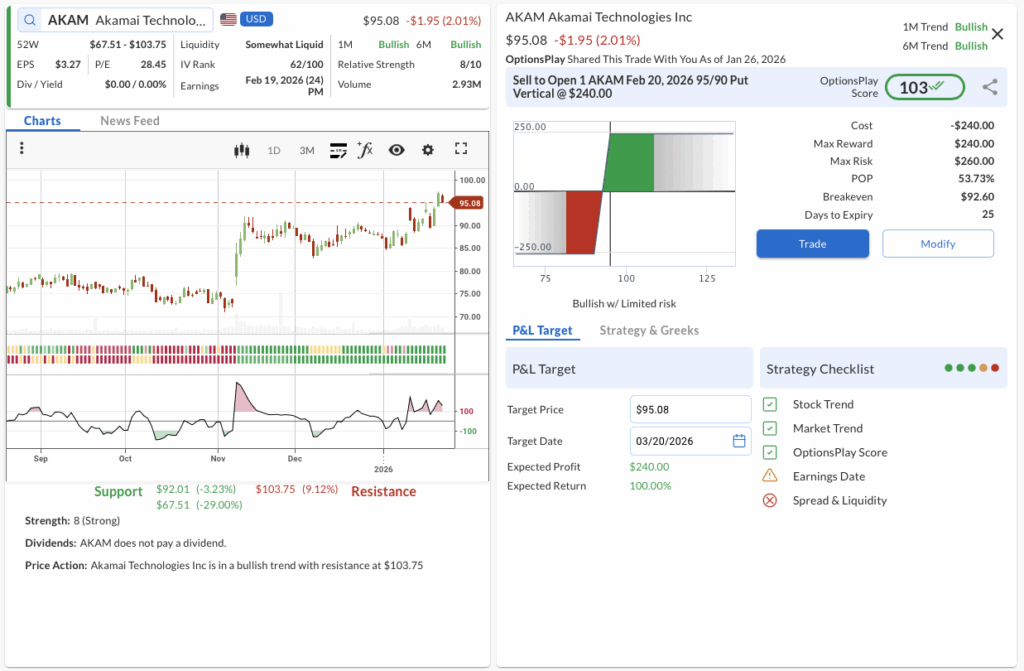
- The Trade:Sell to Open the AKAM Feb 20 2026 95/90 Put Vertical @ $2.40 Credit.
- 🔴 SELL TO OPEN Feb 20 2026 95 Put @ $5.45
- 🟢 BUY TO OPEN Feb 20 2026 90 Put @ $3.05
- Trade Metrics: POP: 54% | Collect $240 per contract vs. a Max Risk of $260 (1.08:1).
- The Why: While AKAM is not expected to grow as fast as its peers, its superior profitability suggests that there remains significant upside embedded in its discounted valuation.
- The Technicals: AKAM recently broke out above its $85 resistance level while outperforming the S&P 500, and its recent behavior confirms this level as support, providing a foundation for a move toward the $102 target.
- Management:⚠️ Warning: Earnings is scheduled for Feb 19, 2026, which may require active management.
- Stop Loss: Buy to Close the trade at $4.80 (200% of credit received).
- Take Profit: Buy to Close the trade at $1.20 (50% gain).
2. AMGN ($344.75) – Defensive Growth Breakout
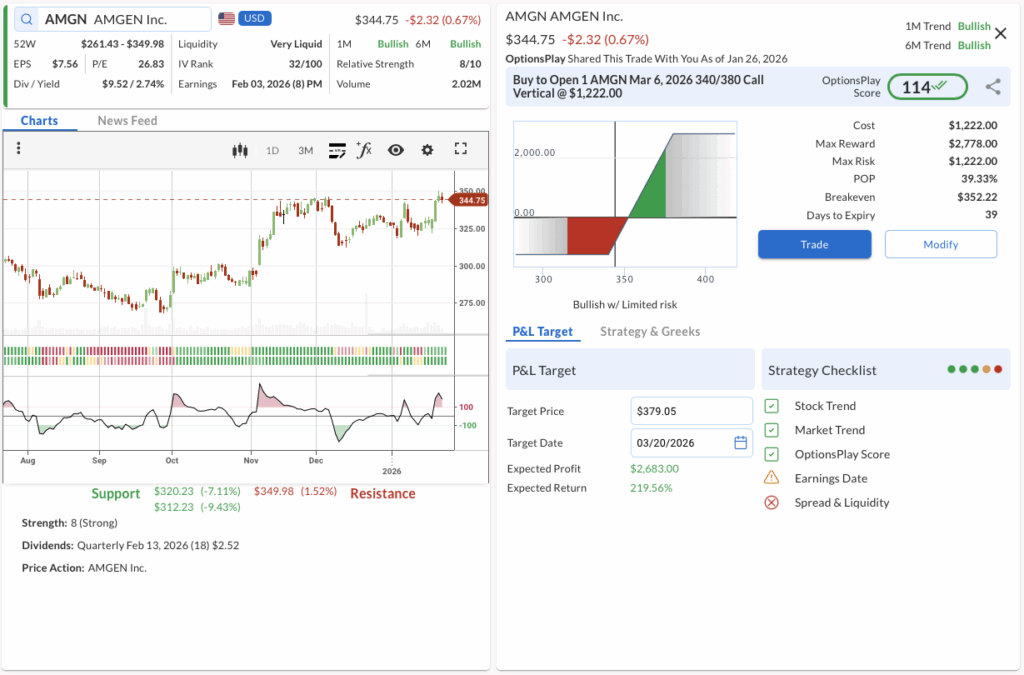
- The Trade:Buy to Open the AMGN Mar 6 2026 340/380 Call Vertical @ $12.22 Debit.
- 🟢 BUY TO OPEN Mar 06 2026 340 Call @ $14.48
- 🔴 SELL TO OPEN Mar 06 2026 380 Call @ $2.26
- Trade Metrics: POP: 39% | Pay $1,222 per contract vs. a Max Reward of $2,778 (2.27:1).
- The Why: With a robust pipeline and strong cash flows, Amgen remains a defensive growth favorite, offering resilience and upside potential in the current market environment.
- The Technicals: The stock has established a strong uptrend, breaking above the $325 level and holding support, with the price action consolidating near highs ($344.75), signaling potential for a continuation run toward the $380 strike.
- Management:⚠️ Warning: Earnings is scheduled for Feb 03, 2026, which may require active management.
- Stop Loss: Sell to Close the trade at $6.11 (50% loss).
- Take Profit: Sell to Close the trade at $21.39 (175% gain).
3. BUD ($69.85) – Bearish Counter-Trend Reversal
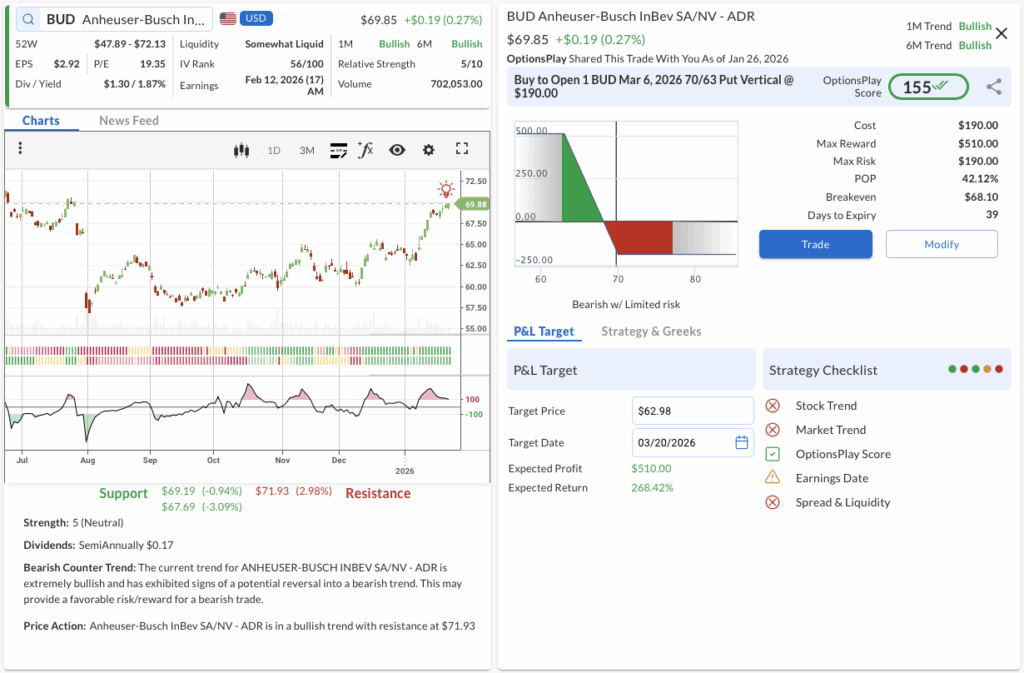
- The Trade:Buy to Open the BUD Mar 6 2026 70/63 Put Vertical @ $1.90 Debit.
- 🟢 BUY TO OPEN Mar 06 2026 70 Put @ $2.60
- 🔴 SELL TO OPEN Mar 06 2026 63 Put @ $0.70
- Trade Metrics: POP: 42% | Pay $190 per contract vs. a Max Reward of $510 (2.68:1).
- The Why: Valuation headwinds and slowing volume growth suggest the recent rally is overextended, creating a compelling fundamental setup for a mean-reversion trade.
- The Technicals: BUD price action is stalling near the $71.93 resistance level, and with the “Bearish Counter Trend” signal active, the failure to break higher suggests a likely pullback toward the $63 support zone.
- Management:⚠️ Warning: Earnings is scheduled for Feb 12, 2026, which may require active management.
- Stop Loss: Sell to Close the trade at $0.95 (50% loss).
- Take Profit: Sell to Close the trade at $3.33 (175% gain).
C, NFLX
OptionsPlay DailyPlay Ideas Menu – Jan 23rd, 2026
💰 The Income Generators (High Probability, Cash Flow)
- C: Bullish Put Spread capitalizing on a pullback to support as Citigroup’s restructuring efforts continue to drive efficiency gains.
🚀 The Growth Seekers (Higher Risk, Max Reward)
- NFLX: Long Call betting on a contrarian reversal as the stock stabilizes at deep value levels following a prolonged downtrend.
1. C ($115.66) – Buying the Dip on Transformation
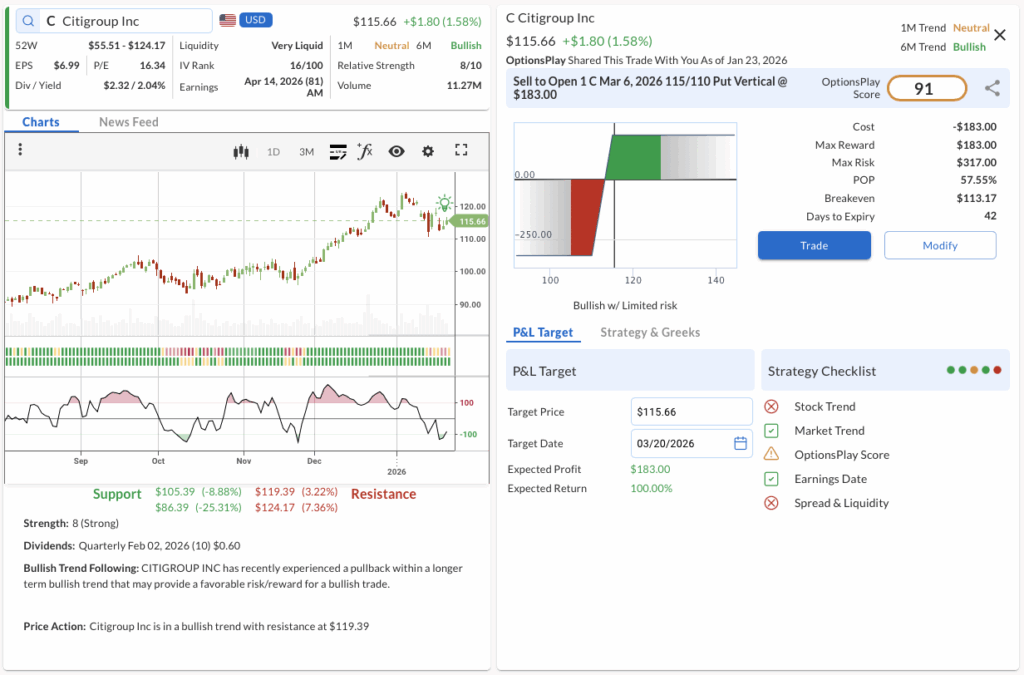
- The Trade: Sell to Open the C Mar 06, 2026 115/110 Put Vertical @ $183.00 Credit.
- 🔴 SELL TO OPEN Mar 06, 2026 115 Put @ $4.14
- 🟢 BUY TO OPEN Mar 06, 2026 110 Put @ $2.31
- Trade Metrics: POP: 57.55% | Collect $183.00 per contract vs. a Max Risk of $317.00 (1.7:1).
- The Why: Citigroup’s ongoing “strategic reset” and organizational simplification are expected to unlock tangible book value, making the current pullback a compelling entry point for income generation.
- The Technicals: The stock remains in a long-term Bullish Trend (6M) despite a Neutral 1M trend; price action shows a constructive pullback testing support near $105-$110, while resistance looms overhead at $119.39.
- Management:
- Stop Loss: Buy back the spread at $3.66 (100% of credit received).
- Take Profit: Buy back the spread at $0.92 (50% of max gain).
2. NFLX ($83.54) – A Contrarian Reversal Play
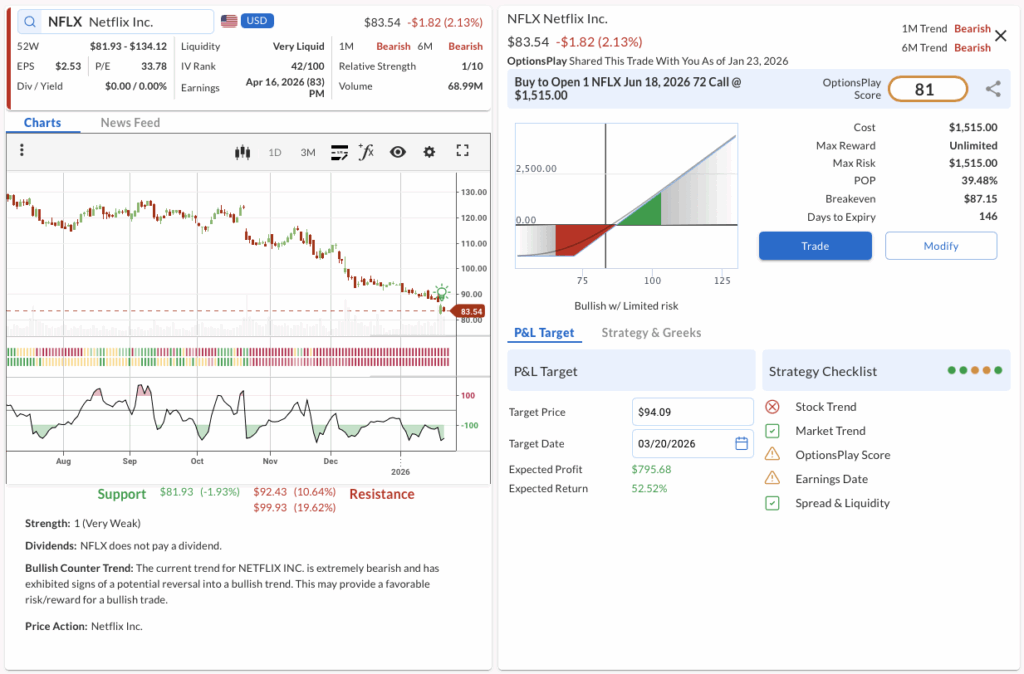
- The Trade: Buy to Open the NFLX Jun 18, 2026 72 Call @ $1,515.00 Debit.
- 🟢 BUY TO OPEN Jun 18, 2026 72 Call @ $15.15
- Trade Metrics: POP: 39.48% | Pay $1,515.00 per contract vs. a Max Reward of Unlimited.
- The Why: Despite negative sentiment, Netflix’s valuation has reset to attractive levels, and we view the stabilization near $80 as a potential floor ahead of renewed ad-tier monetization growth.
- The Technicals: While the trend remains Bearish (1M & 6M), the stock is showing signs of a “Bullish Counter Trend” potential, stabilizing near $82 support with indicators suggesting an oversold bounce is due.
- Management:
⚠️ Warning: Earnings is scheduled for Apr 16, which may require active management.- Stop Loss: Sell the call at $7.58 (50% loss on premium).
- Take Profit: Sell the call at $26.51 (75% gain on premium).
DECK, RJF
OptionsPlay DailyPlay Ideas Menu – Jan 22nd, 2026
💰 The Income Generators (High Probability, Cash Flow)
- DECK: Bullish Put Vertical – HOKA’s continued momentum in the running category and UGG’s brand resilience drive strong direct-to-consumer growth, supporting premium valuations.
🚀 The Growth Seekers (Higher Risk, Max Reward)
- RJF: Bullish Call Vertical – Strong client asset retention and growth in the Capital Markets division position the firm to capitalize on improving investment banking activity.
1. DECK Deckers Outdoor Corp. ($101.94) – HOKA & UGG Brand Momentum
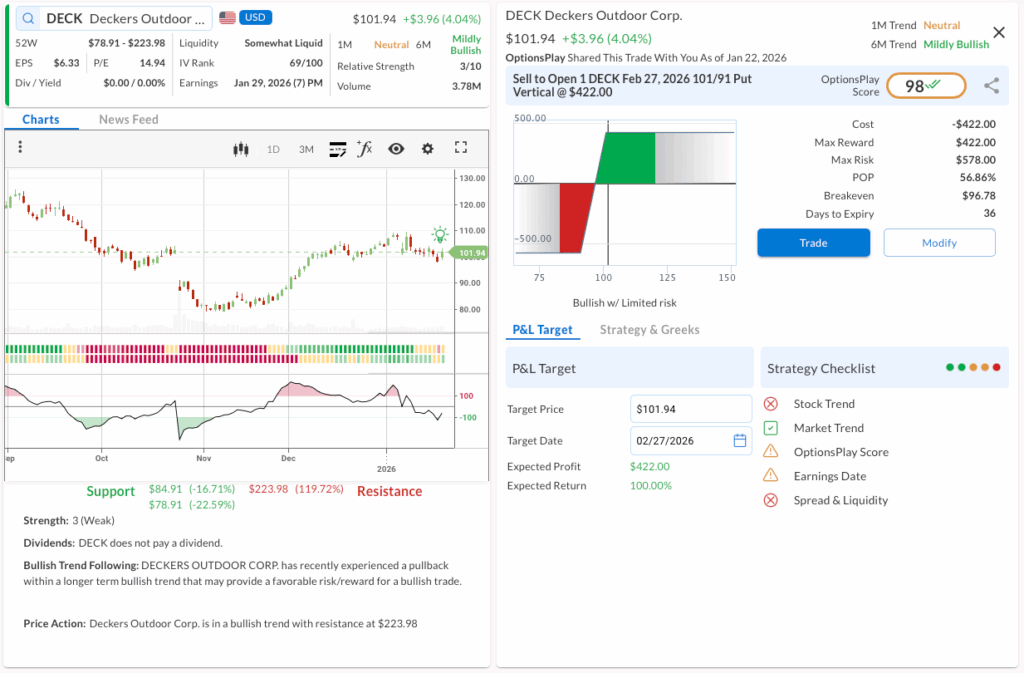
- The Trade:Sell to Open the DECK Feb 27, 2026 101/91 Put Vertical @ $4.22 Credit.
- SELL TO OPEN Feb 27, 2026 101 Put @ $7.50
- BUY TO OPEN Feb 27, 2026 91 Put @ $3.28
- Trade Metrics: 56.86% POP | Collect $422.00 per contract with Max Risk of $578.00 | [Reward/Risk: 0.7 to 1].
- The Why: HOKA’s continued momentum in the running category and UGG’s brand resilience drive strong direct-to-consumer growth, supporting premium valuations.
- The Technicals: The stock is in a Neutral 1M Trend but has a Mildly Bullish 6M Trend with a Relative Strength of 3/10. It is currently testing Support at $84.91, while major Resistance sits at $223.98.
- Management:
- ⚠️ Warning: Earnings is scheduled for Jan 29, 2026, which may require active management.
- Stop Loss: Buy to Close at $8.44 (100% of credit received).
- Take Profit: Buy to Close at $2.11 (50% of max gain).
2. RJF Raymond James Financial, Inc. ($170.06) – Capital Markets Recovery

- The Trade:Buy to Open the RJF Feb 20, 2026 170/180 Call Vertical @ $3.90 Debit.
- BUY TO OPEN Feb 20, 2026 170 Call @ $5.65
- SELL TO OPEN Feb 20, 2026 180 Call @ $1.75
- Trade Metrics: 37.66% POP | Pay $390.00 per contract with Max Reward of $610.00 | Reward/Risk: 1.56].
- The Why: Strong client asset retention and growth in the Capital Markets division position the firm to capitalize on improving investment banking activity.
- The Technicals: The stock is in a Bullish 1M Trend and retains a Bullish 6M Trend with a Relative Strength of 6/10. It is currently testing Support at $153.95, while major Resistance sits at $176.55.
- Management:
- ⚠️ Warning: Earnings is scheduled for Jan 28, 2026, which may require active management.
- Stop Loss: Sell to Close at $1.95 (50% loss on premium).
- Take Profit: Sell to Close at $6.83 (75% gain on premium).
DELL, XYZ, UBER
OptionsPlay DailyPlay Ideas Menu – Jan 21st, 2026
💰 The Income Generators (High Probability, Cash Flow)
- DELL: Bear Call Spread hedging against margin compression fears as the enterprise hardware refresh cycle shows signs of peaking.
🚀 The Growth Seekers (Higher Risk, Max Reward)
- XYZ: Debit Call Spread betting on a profitability inflection point as Cash App engagement drives a renewed growth narrative.
🛡️ The Portfolio Protectors (Hedges & Bearish Bets)
- UBER: Bear Put Spread hedging against regulatory headwinds and signs of consumer fatigue in high-frequency rideshare usage.
1. DELL ($111.08) – Fading the Hardware Cycle
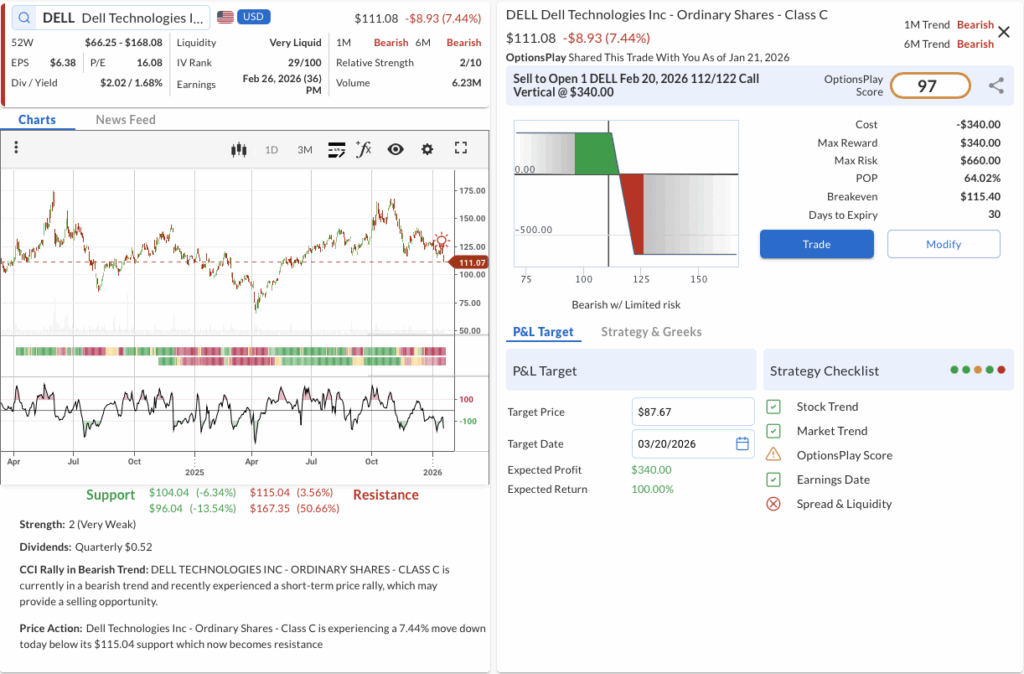
- The Trade: Sell to Open the DELL Feb 20, 2026 112/122 Call Vertical @ $3.40 Credit.
SELL TO OPEN Feb 20, 2026 $112 Call @ $5.60
BUY TO OPEN Feb 20, 2026 $122 Call @ $2.20 - Trade Metrics: POP: 64.02% | Collect $340.00 per contract vs. a Max Risk of $660.00 (1.9:1).
- The Why: While Dell remains a key AI infrastructure player, recent channel checks suggest the PC refresh cycle is plateauing, and analysts are becoming cautious on near-term margin expansion capabilities.
- The Technicals: The stock is in a confirmed Bearish Trend (1M & 6M) with a Relative Strength of 2/10. It is currently testing Resistance at $115.04, while major Support sits at $104.04.
- Management:
- Stop Loss: Buy back the spread at $6.80 (100% of credit received).
- Take Profit: Buy back the spread at $1.70 (50% of max gain).
2. XYZ ($62.63) – The FinTech Pivot
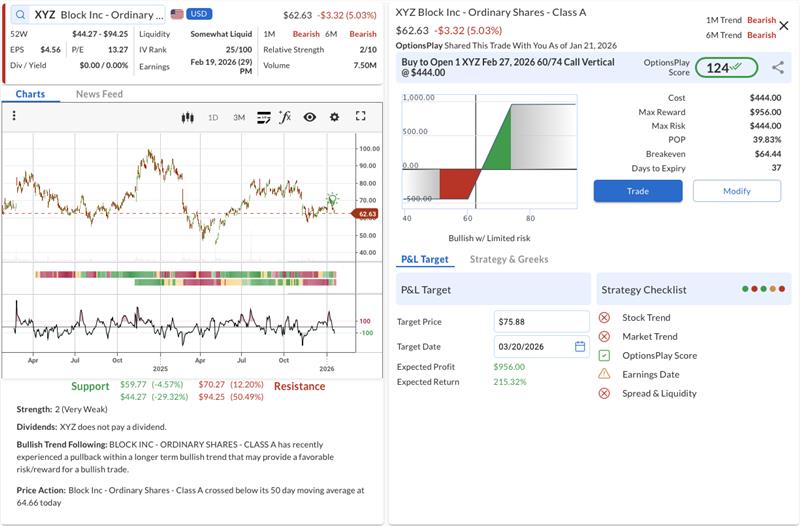
- The Trade: Buy to Open the XYZ Feb 27, 2026 60/74 Call Vertical @ $4.44 Debit.
BUY TO OPEN Feb 27, 2026 $60 Call @ $5.90
SELL TO OPEN Feb 27, 2026 $74 Call @ $1.46 - Trade Metrics: POP: 39.83% | Pay $444.00 per contract vs. a Max Reward of $956.00 (2.2:1).
- The Why: Block Inc is successfully executing its “Bank of the Future” strategy with Cash App monetization improving; we view the recent pullback as a disconnection from its improving fundamental profitability profile.
- The Technicals: The stock is in a Bearish Trend (1M & 6M) with a Relative Strength of 2/10. It is currently testing Support at $59.77, while major Resistance sits at $70.27.
- Management:⚠️ Warning: Earnings is scheduled for Feb 19, which may require active management.
- Stop Loss: Sell the spread at $2.22 (50% loss on premium).
- Take Profit: Sell the spread at $7.77 (75% gain on premium).
3. UBER ($83.73) – Regulatory Roadblocks
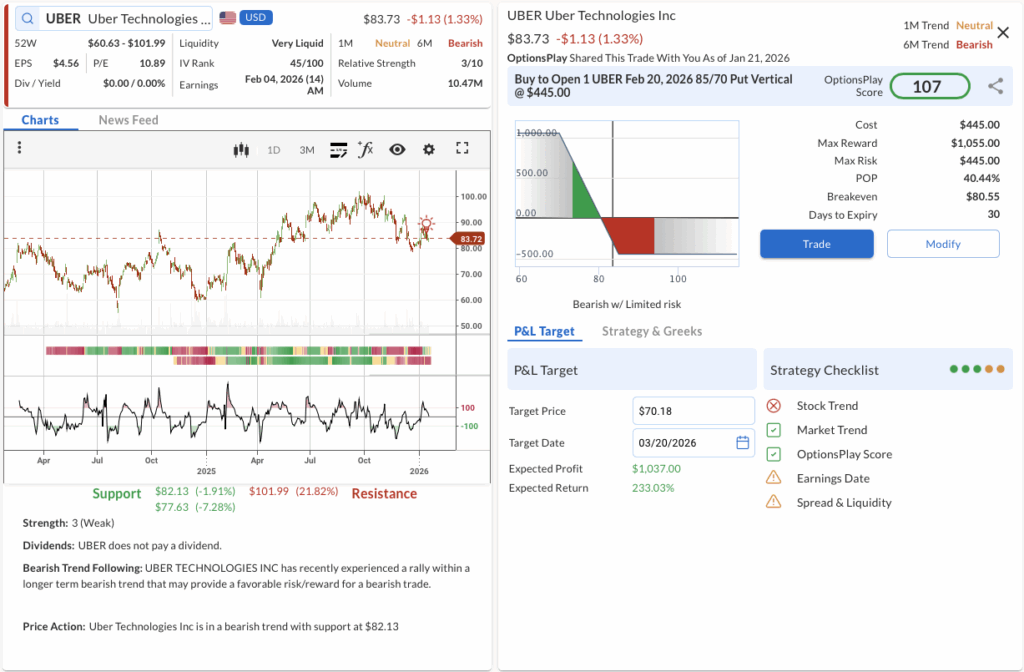
- The Trade: Buy to Open the UBER Feb 20, 2026 85/70 Put Vertical @ $4.45 Debit.
BUY TO OPEN Feb 20, 2026 $85 Put @ $4.95
SELL TO OPEN Feb 20, 2026 $70 Put @ $0.50 - Trade Metrics: POP: 40.44% | Pay $445.00 per contract vs. a Max Reward of $1,055.00 (2.4:1).
- The Why: Increasing scrutiny on gig-worker classification combined with softer consumer discretionary spending data presents a tangible risk to Uber’s booking volumes in the coming quarter.
- The Technicals: The stock is in a Neutral Trend (1M) but a Bearish Trend (6M) with a Relative Strength of 3/10. It is currently testing Support at $82.13, while major Resistance sits at $101.99.
- Management:⚠️ Warning: Earnings is scheduled for Feb 04, which may require active management.
- Stop Loss: Sell the spread at $2.23 (50% loss on premium).
- Take Profit: Sell the spread at $7.79 (75% gain on premium).
PM, AFRM, RKLB
OptionsPlay DailyPlay Ideas Menu – Jan 20th, 2026
💰 The Income Generators (High Probability, Cash Flow)
- PM: Bear Call Spread capitalizing on overextended technicals and resistance near $175.
🚀 The Growth Seekers (Higher Risk, Max Reward)
- AFRM: Debit Call Spread betting on continued momentum in the Buy Now, Pay Later sector as volumes surge.
🛡️ The Portfolio Protectors (Hedges & Bearish Bets)
- RKLB: Covered Call generating income to hedge against potential volatility after a massive 6% daily move.
1. PM ($173.62) – Fading the Highs

- The Trade: Sell to Open the PM Feb 20, 2026 175/185 Call Vertical @ $3.60 Credit. SELL TO OPEN Feb 20, 2026 $175 Call @ $6.00 BUY TO OPEN Feb 20, 2026 $185 Call @ $2.40
- Trade Metrics: POP: 63.64% | Collect $360.00 per contract vs. a Max Risk of $640.00 (1.8:1).
- The Why: Philip Morris is trading at historic highs; we are selling call premium against major resistance at $175 to generate income as momentum slows.
- The Technicals: The stock is in a confirmed Bullish Trend (1M & 6M) with a Relative Strength of 5/10. It is currently testing Resistance at $181.91, while major Support sits at $172.05.
- Management:⚠️ Warning: Earnings is scheduled for Feb 06, which may require active management.
- Stop Loss: Buy back the spread at $7.20 (100% of credit received).
- Take Profit: Buy back the spread at $1.80 (50% of max gain).
2. AFRM ($74.76) – BNPL Breakout
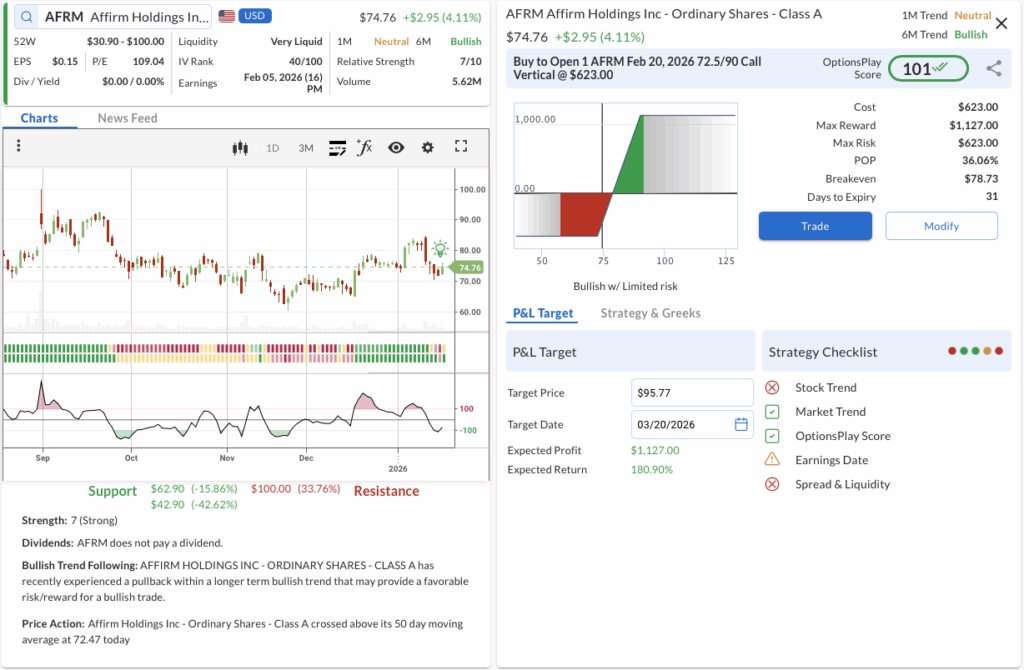
- The Trade: Buy to Open the AFRM Feb 20, 2026 72.5/90 Call Vertical @ $6.23 Debit. BUY TO OPEN Feb 20, 2026 $72.5 Call @ $8.40 SELL TO OPEN Feb 20, 2026 $90 Call @ $2.17
- Trade Metrics: POP: 36.06% | Pay $623.00 per contract vs. a Max Reward of $1,127.00 (1.8:1).
- The Why: Affirm is showing renewed strength in the payments sector; we are positioning for a continued rally towards $90 ahead of the next earnings cycle.
- The Technicals: The stock is in a Neutral Trend (1M) but a Bullish Trend (6M) with a Relative Strength of 7/10. It is currently testing Support at $62.90, while major Resistance sits at $100.00.
- Management:⚠️ Warning: Earnings is scheduled for Feb 05, which may require active management.
- Stop Loss: Sell the spread at $3.12 (50% loss on premium).
- Take Profit: Sell the spread at $10.90 (75% gain on premium).
3. RKLB ($96.30) – Locking in Launch Gains
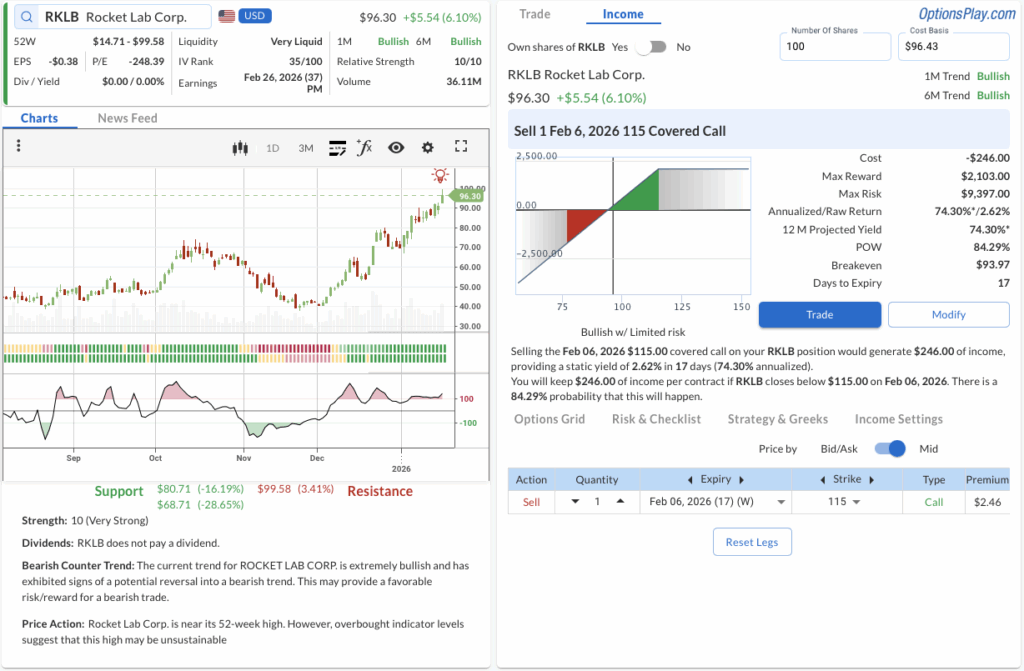
- The Trade: Sell 1 Feb 6, 2026 115 Covered Call @ $2.46 Credit.
- Trade Metrics: POW: 84.29% | Collect $246.00 per contract (74.30% Annualized Yield or 2.62% in 17 Days).
- The Why: After a parabolic move, Rocket Lab’s implied volatility is extremely high; selling upside calls allows us to capture rich premiums while retaining significant upside potential to $115.
- The Technicals: The stock is in a confirmed Bullish Trend (1M & 6M) with a Relative Strength of 10/10. It is currently testing Resistance at $99.58, while major Support sits at $80.71.
- Management:Note: These management rules are optional. You may choose to hold to expiration if you are comfortable with the obligation to sell shares at the strike price.
- Stop Loss: Buy back the call at $4.92 (100% of credit received).
- Take Profit: Buy back the call at $1.23 (50% of max gain).
LULU, ABNB, TGT
OptionsPlay DailyPlay Ideas Menu – Jan 16th, 2026
💰 The Income Generators (High Probability, Cash Flow)
- LULU: Credit Put Spread capitalizing on the pullback to major support as international growth starts to accelerate.
🚀 The Growth Seekers (Higher Risk, Max Reward)
- ABNB: Debit Call Spread betting on a valuation rebound as travel demand stabilizes and margins expand.
🛡️ The Portfolio Protectors (Hedges & Bearish Bets)
- TGT: Covered Call generating income to hedge against lingering consumer discretionary headwinds after a strong rally.
1. LULU ($205.01) – The International Growth Play
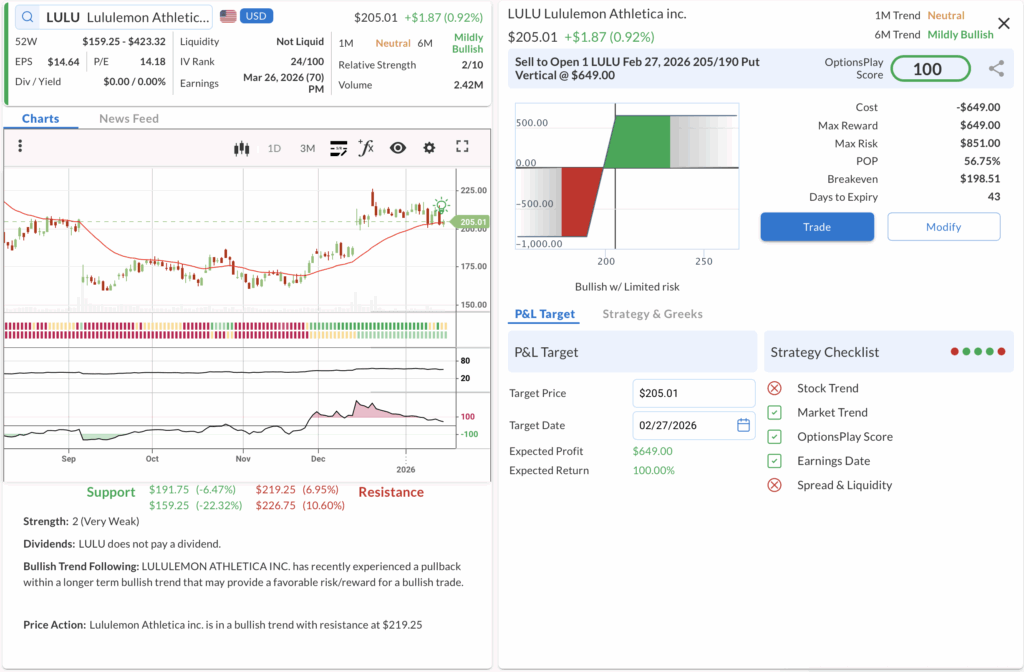
- The Trade: Sell to Open the LULU Feb 27, 2026 205/190 Put Vertical @ $6.49 Credit.
- BUY TO OPEN Feb 27, 2026 $190 Put @ $4.04
- SELL TO OPEN Feb 27, 2026 $205 Put @ $10.53
- Trade Metrics: POP: 56.75% | Collect $649.00 per contract vs. a Max Risk of $851.00 (1.3:1).
- The Why: Despite recent U.S. softness, Lululemon’s holiday sales beat and international momentum suggest the pullback to the $200 level is an attractive entry point.
- The Technicals: The stock is in a Neutral Trend (1M) but retains a Mildly Bullish Trend (6M) with a Relative Strength of 2/10. It is currently testing Support at $192, while major Resistance sits at $219.
- Management:
- Stop Loss: Buy back the spread at $12.98 (100% of credit received).
- Take Profit: Buy back the spread at $3.25 (50% of max gain).
2. ABNB ($132.60) – The Travel Rebound
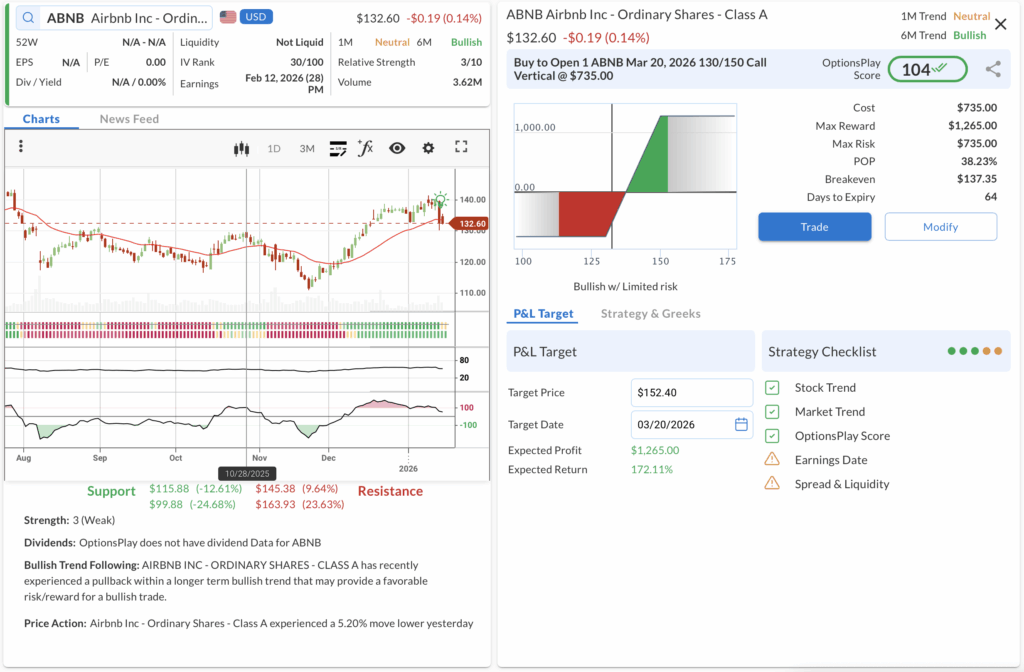
- The Trade: Buy to Open the ABNB Mar 20, 2026 130/150 Call Vertical @ $7.35 Debit.
- BUY TO OPEN Mar 20, 2026 $130 Call @ $9.73
- SELL TO OPEN Mar 20, 2026 $150 Call @ $2.38
- Trade Metrics: POP: 38.23% | Pay $735.00 per contract vs. a Max Reward of $1,265.00 (1.7:1).
- The Why: With valuation resetting and margins expanding from AI efficiencies, Airbnb is positioned for a recovery as it rolls out new inventory types to capture demand.
- The Technicals: The stock is in a Neutral Trend (1M) but a Bullish Trend (6M) with a Relative Strength of 3/10. It is currently testing Support at $116, while major Resistance sits at $145.
- Management:
- ⚠️ Warning: Earnings is scheduled for Feb 12, which may require active management.
- Stop Loss: Sell the spread at $3.68 (50% loss on premium).
- Take Profit: Sell the spread at $12.86 (75% gain on premium).
3. TGT ($111.13) – Hedging the Rally

- The Trade: Sell to Open the TGT Feb 27, 2026 121 Covered Call @ $1.81 Credit.
- Trade Metrics: POW: 77.76% | Collect $180.50 per contract (14.91% Annualized Yield or 1.65% in 43 Days).
- The Why: Target is stabilizing after a 22% rally, but we are using covered calls to hedge against lingering consumer discretionary headwinds and weak foot traffic.
- The Technicals: The stock is in a confirmed Bullish Trend (1M & 6M) with a Relative Strength of 8/10. It is currently testing Resistance at $121, while major Support sits at $107.
- Management:
- Note: These management rules are optional. You may choose to hold to expiration if you are comfortable with the obligation to sell shares at the strike price.
- Stop Loss: Buy back the call at $3.62 (100% of credit received).
- Take Profit: Buy back the call at $0.91 (50% of max gain).