
GOOGL

DailyPlay – Closing Trade (GOOGL) – June 27, 2025
- GOOGL – 64% gain: Buy to Close 4 Contracts (or 100% of your Contracts) July 18 $165/$157.5 Put Vertical Spreads @ $0.88 Debit. DailyPlay Portfolio: By Closing 4 Contracts, we will be paying $352. We initially opened these 4 contracts on June 24 @ $2.43 Credit. Our gain, therefore, is $620.
AAPL

DailyPlay – Adjusting Trade (AAPL) – June 26, 2025
AAPL Bearish Trade Adjustment Signal
Investment Rationale
Adjustment Rationale:
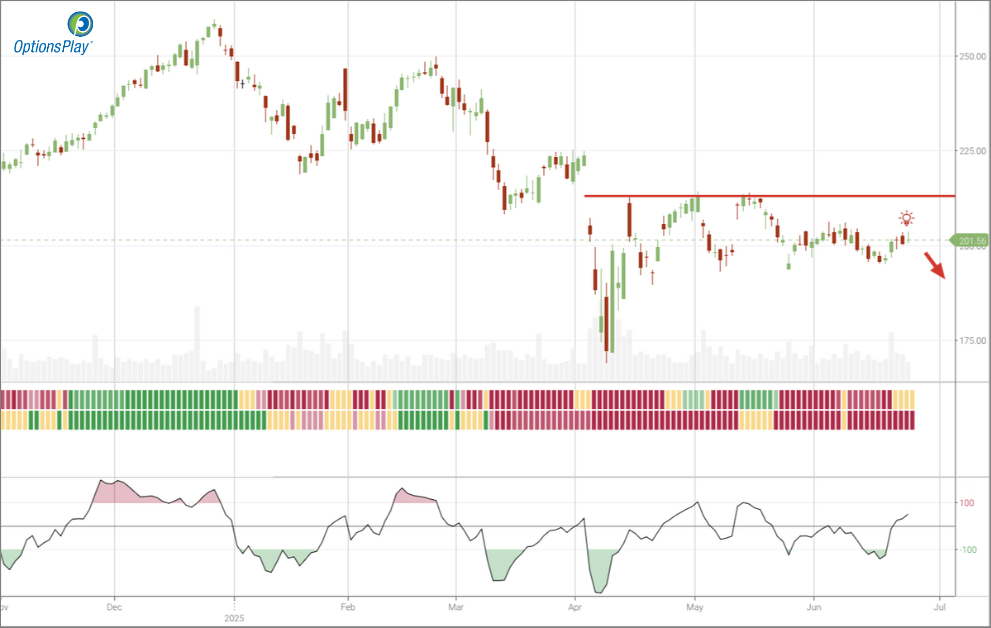
Our bearish stance on Apple, Inc. (AAPL) remains intact, and we are holding 3 AAPL Jul 18, 2025 205/180 Bear Put Vertical Spreads within the Daily Play portfolio. Apple’s valuation continues to outpace peers, while unresolved trade and tariff risks persist. With the initial trade now at the halfway point to expiration, we’re managing risk by rolling the short 180 put up to the 195 strike, same expiration, for a net credit. Closing the position is also a viable alternative, but the roll effectively keeps the bearish idea in play and reduces the max risk of the position.
Adjustment Trade
Days to Expiration (DTE): 22
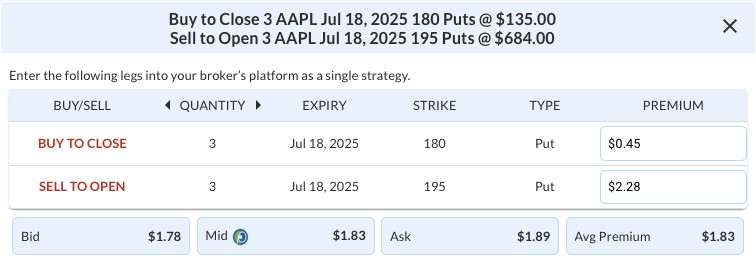
Buy to Close: 3 AAPL Jul 18, 2025 180 Puts @ $0.45
Sell to Open: 3 AAPL Jul 18, 2025 195 Puts @ $2.28
Mid: $1.83
Average Premium Received: $1.83 net credit
or $549 (300 x $1.83) for the adjustment trade
AAPL – Daily
Trade Details
Strategy Details
Strategy: Rolling a Short Put option up in strike
Direction: Resulting in a new Bearish Debit Spread
Details: Buy to Close 3 AAPL July 18 $180 Puts and Sell to Open 3 AAPL July 18 $195 Puts @ $1.83
Total Risk: The resulting position has a maximum risk of $1701 (2250 – 549), calculated as the initial cost basis of the 3 spreads purchased ($2250) minus the premium received from the adjustment ($549).
Trend Continuation Signal: This is a bearish trade on a stock that is expected to continue lower off a recent area of resistance.
1M/6M Trends: Neutral/Bearish
Relative Strength: 2/10
Stop Loss: @ $2.84(50% loss of premium)
Entering the Trade
Use the following details to enter the trade on your trading platform. Please note that whenever there is a multi-leg option strategy, it should be entered as a single trade.
PLEASE NOTE that these prices are based on Wednesday’s closing prices. Should the underlying move significantly during the pre-market hours, we will likely adjust the strikes and prices to reflect a more accurate trade entry.
MU

DailyPlay – Opening Trade (MU) – June 25, 2025
MU Bullish Opening Trade Signal
Investment Rationale
Investment Thesis
Micron Technology (MU) presents a high-conviction bullish setup heading into its earnings report today, Wednesday June 25th, with the options market pricing an 8.11% expected move. Micron is mentioned in the earnings navigator section at the end of this week’s trade ideas research report, reflecting its prominence as a top earnings catalyst this week. The stock is benefitting from a powerful convergence of secular tailwinds and earnings momentum, particularly tied to the AI-driven demand for high-performance memory. As one of the best-positioned plays in the DRAM and NAND recovery cycle, MU stands to outperform in the second half of 2025. A strong earnings beat and guide could drive further institutional accumulation, especially given its deep relative valuation discount and surging growth profile. The setup is attractive both as a short-term catalyst trade and a longer-term structural long.
Technical Analysis:
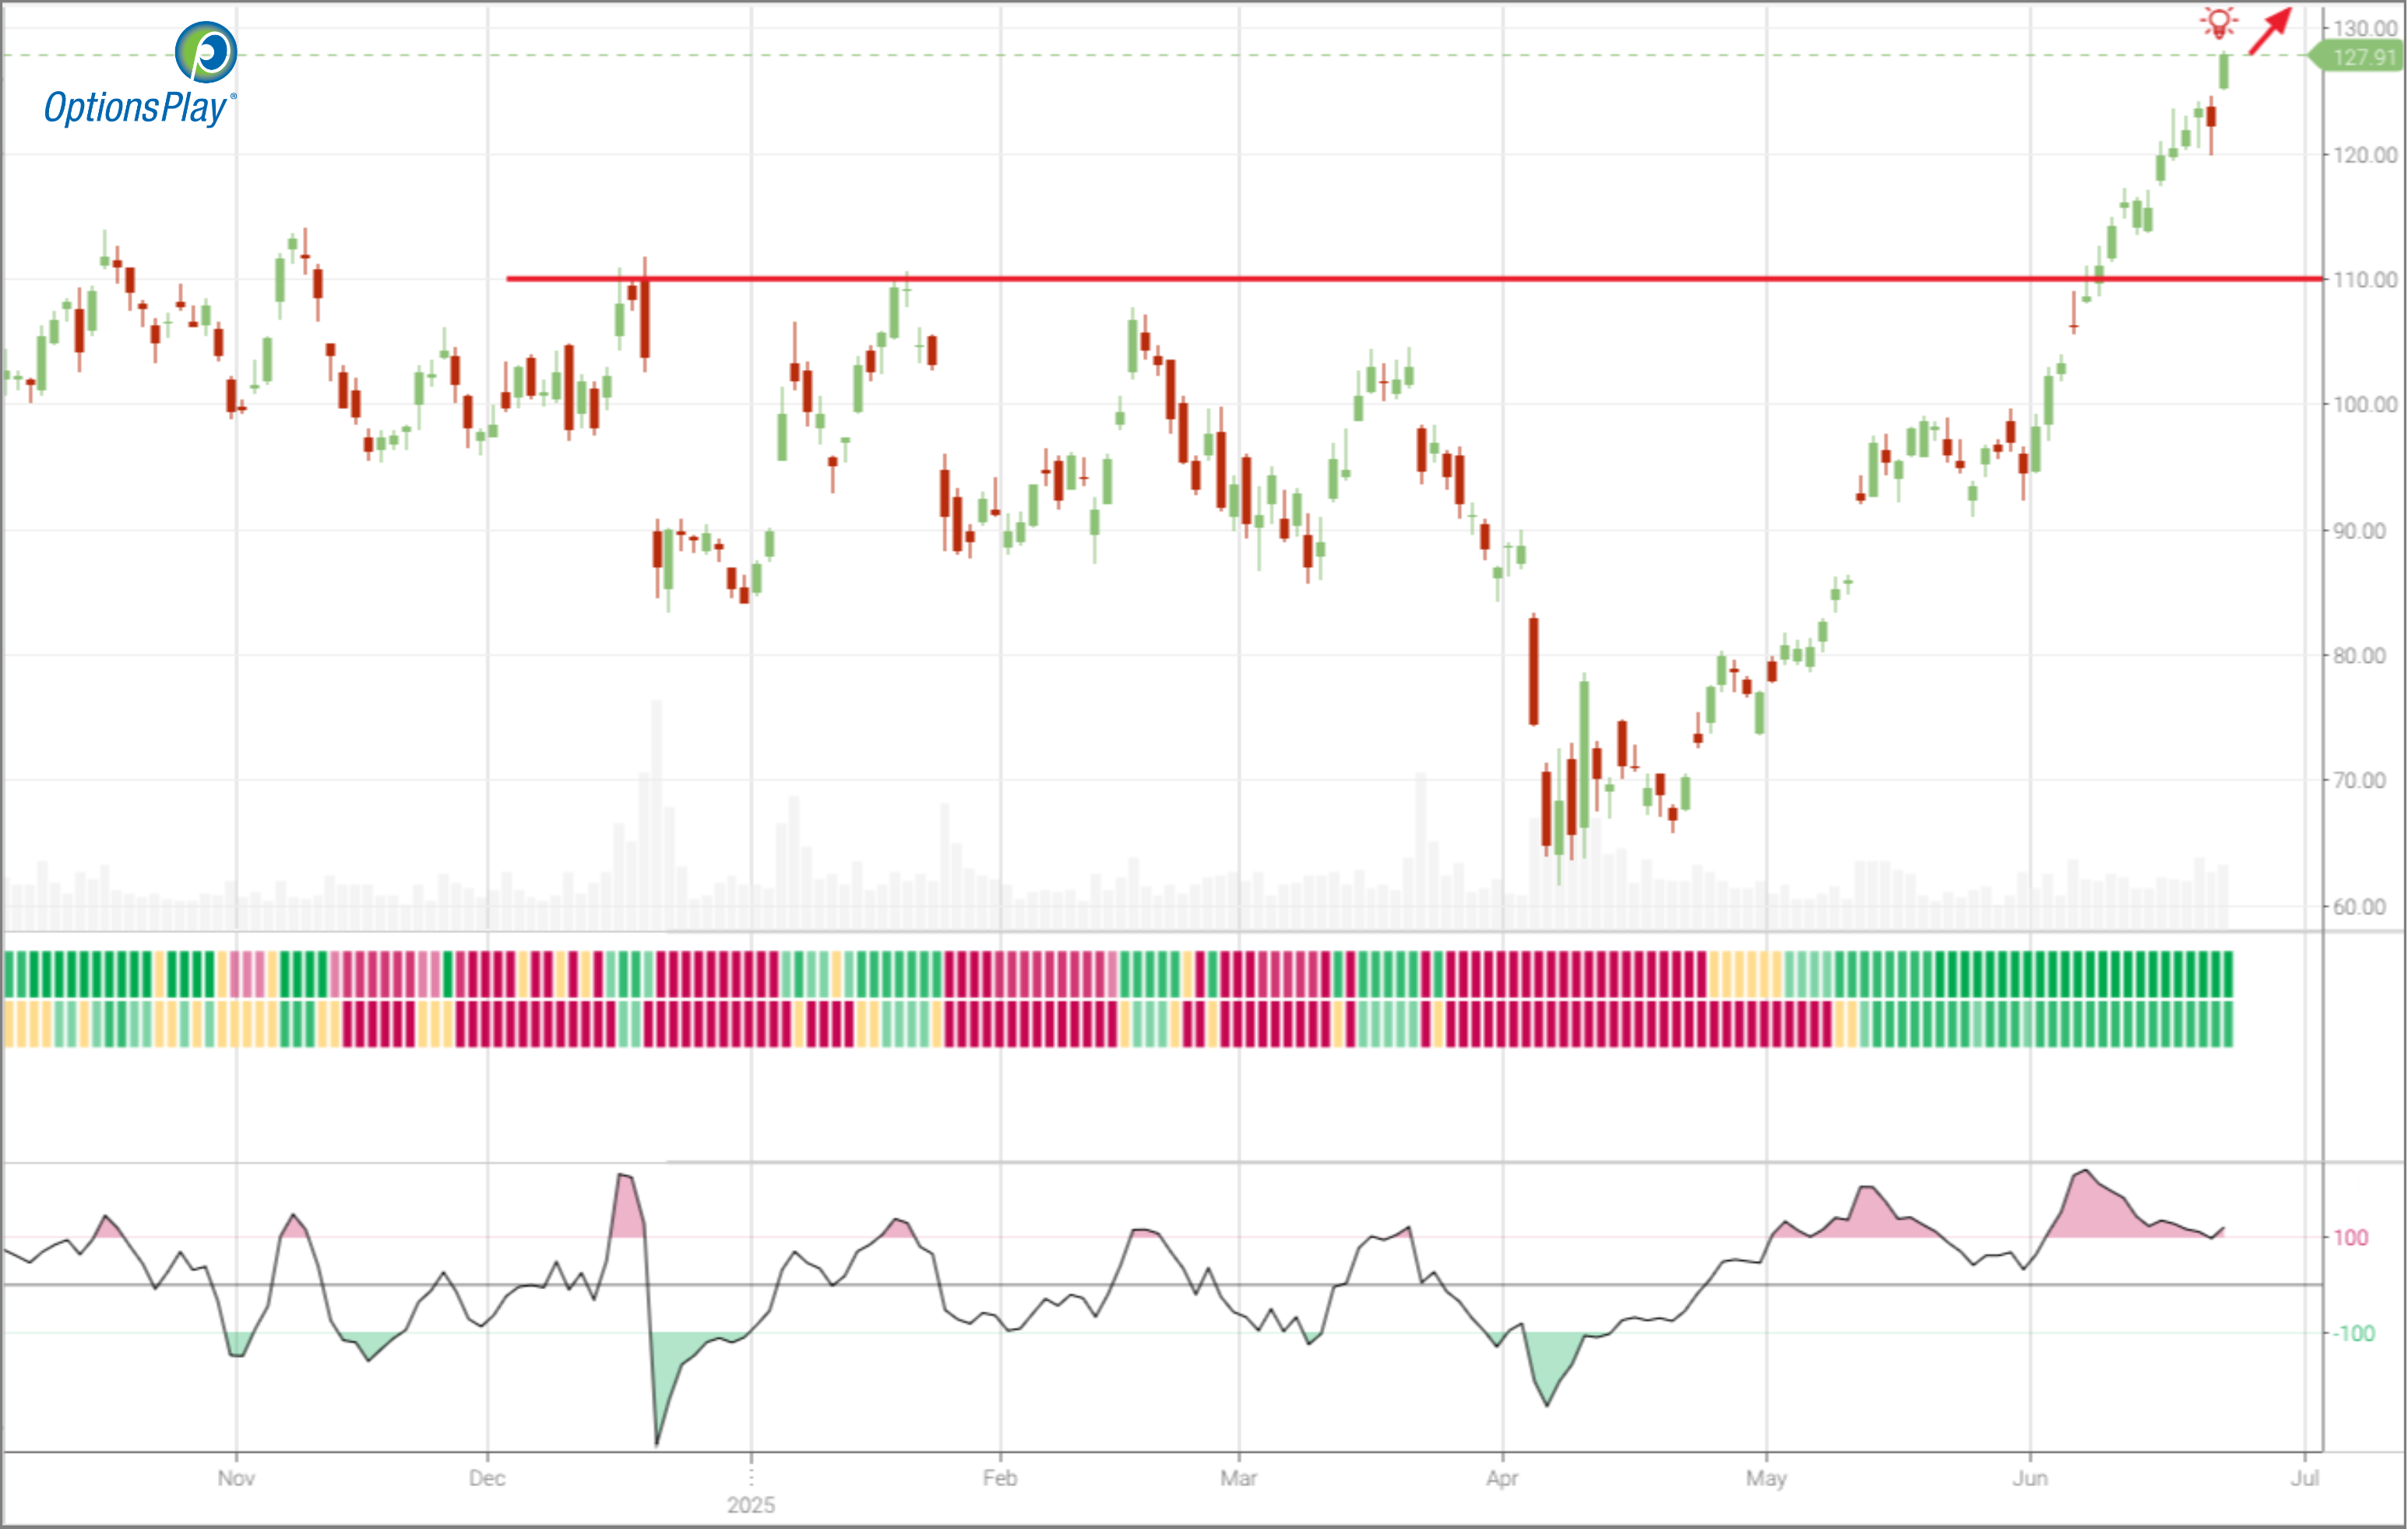
MU has decisively broken out above the $110 resistance zone and is now trading at multi-year highs, closing at $127.91. Price action remains bullish, supported by a steepening trendline that has developed since April. The stock is trading well above its 20-, 50-, and 200-day moving averages, all of which are trending higher. Volume trends also indicate accumulation, adding conviction to the breakout ahead of earnings. One potential concern is the RSI, which has reached 83, suggesting the stock may be approaching overbought territory. However, there is still some opportunity for further upside if the earnings report is perceived positively by the market, with our upside target at $135.
Fundamental Analysis:
Micron remains one of the most attractive names in the semiconductor space on a valuation-adjusted growth basis, with AI tailwinds accelerating demand for next-gen memory products. Industry dynamics are improving, and Micron is expected to deliver a notable earnings inflection as pricing recovers.
- Forward PE Ratio: 11.73x vs. Industry Median 22.84x
- Expected EPS Growth: 99.92% vs. Industry Median 16.50%
- Expected Revenue Growth: 22.73% vs. Industry Median 10.46%
- Net Margins: 14.92% vs. Industry Median 10.43%
Options Trade:
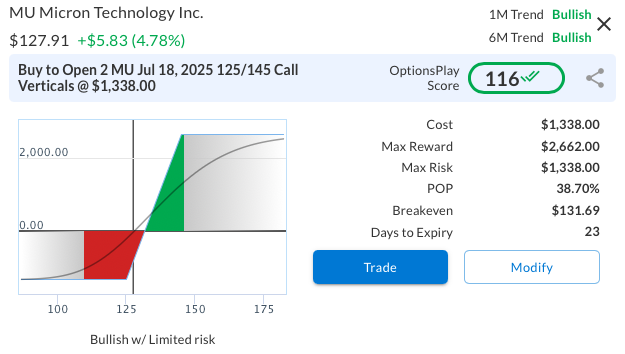
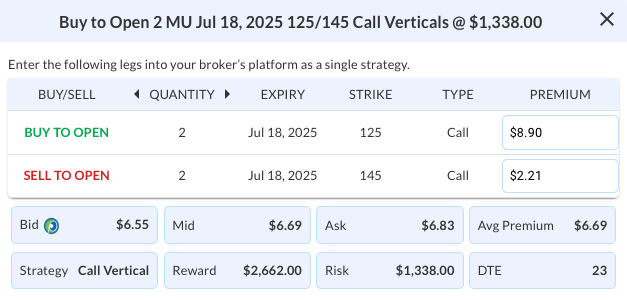
A bullish call vertical is favored into earnings: Buy the MU Jul 18, 2025 125/145 Call Spread for $6.69. This trade risks $669 to potentially make $1,331 (2.0x reward-to-risk ratio) if MU closes above $145 by expiration. With 24 days to expiry, this structure captures the earnings event while capping downside versus outright calls. The 125 strike sits just in-the-money, while the 145 target aligns with a post-earnings extension consistent with the implied move and current momentum. This trade expresses a directional bullish view while maintaining defined risk.
MU – Daily
Trade Details
Strategy Details
Strategy: Long Call Vertical Spread
Direction: Bullish Debit Spread
Details: Buy to Open 2 MU July 18 $125/$145 Call Vertical Spreads @ $6.69 Debit per Contract.
Total Risk: This trade has a max risk of $1,338 (2 Contracts x $669) based on a hypothetical $100k portfolio risking 2%. We suggest risking only 2% of the value of your portfolio and divide it by $669 to select the # contracts for your portfolio.
Trend Continuation Signal: This is a bullish trade on a stock that is expected to continue higher over the duration of this trade.
1M/6M Trends: Bullish/Bullish
Relative Strength: 10/10
OptionsPlay Score: 116
Stop Loss: @ $3.35 (50% loss of premium)
View MU Trade
Entering the Trade
Use the following details to enter the trade on your trading platform. Please note that whenever there is a multi-leg option strategy, it should be entered as a single trade.
PLEASE NOTE that these prices are based on Tuesday’s closing prices. Should the underlying move significantly during the pre-market hours, we will likely adjust the strikes and prices to reflect a more accurate trade entry.
View MU Trade
GOOGL
DailyPlay – Opening Trade (GOOGL) & Closing Trade (MU) – June 24, 2025
Closing Trade
- MU – 50% gain: Sell to Close 5 Contracts (or 100% of your Contracts) July 11 $117/$130 Call Vertical Spreads @ $5.95 Credit. DailyPlay Portfolio: By Closing 5 Contracts, we will be collecting $2,975. Our cost basis on the trade was $1,995 Debit. Our gain, therefore, is $980.
GOOGL Bullish Opening Trade Signal
Investment Rationale
Investment Thesis:
Alphabet Inc. (GOOGL) presents an attractive bullish setup driven by a combination of technical resilience, compelling valuation, and strong business fundamentals. As one of the core pillars of digital advertising, AI infrastructure, and cloud computing, Alphabet remains well-positioned to benefit from ongoing secular trends in digital transformation and enterprise AI adoption. With earnings scheduled for July 22, we seek to capitalize on short-term price stability and potential upside while avoiding the volatility premium typically associated with earnings events. Our focus is on capturing this opportunity through a defined-risk put spread that expires before the report.
Technical Analysis:
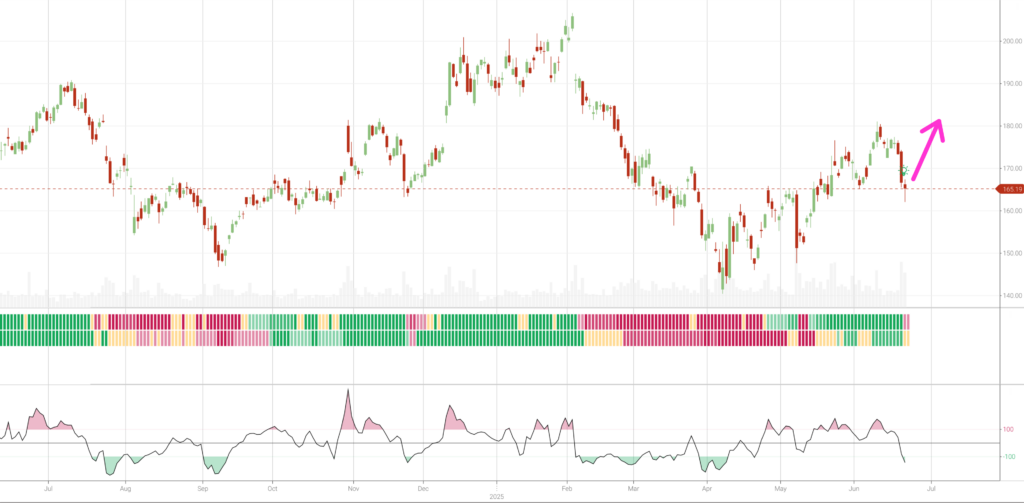
GOOGL is undergoing a constructive pullback within a well-established bullish trend, offering a favorable setup for trend-following traders. The stock recently broke out of a multi-month consolidation and has now pulled back to retest key support near $165, which aligns with prior resistance and marks a critical retracement zone. Price action is beginning to stabilize, and GOOGL continues to hold above its rising 50-day moving average, reinforcing the strength of the longer-term uptrend. This pullback presents a compelling risk/reward opportunity, with a successful defense of the $165 level likely to set the stage for a move back toward the $175–$185 resistance range and our $185 upside target.
Fundamental Analysis:
GOOGL continues to trade at a relative discount despite its strong profitability and growth outlook, reinforcing its status as a high-quality compounder. Margins remain well above peers, driven by the efficiency of its advertising engine and growing contribution from higher-margin businesses like Google Cloud and YouTube.
- Forward PE Ratio: 17.39x vs. Industry Median 19.15x
- Expected EPS Growth: 12.80% vs. Industry Median 12.58%
- Expected Revenue Growth: 10.46% vs. Industry Median 11.73%
- Net Margins: 30.86% vs. Industry Median 6.28%
Options Trade:
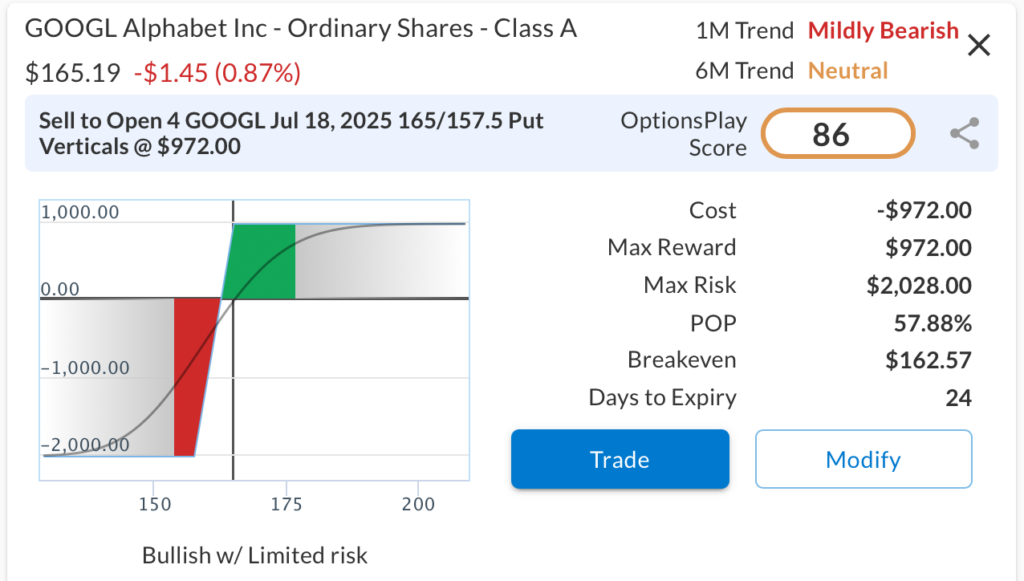
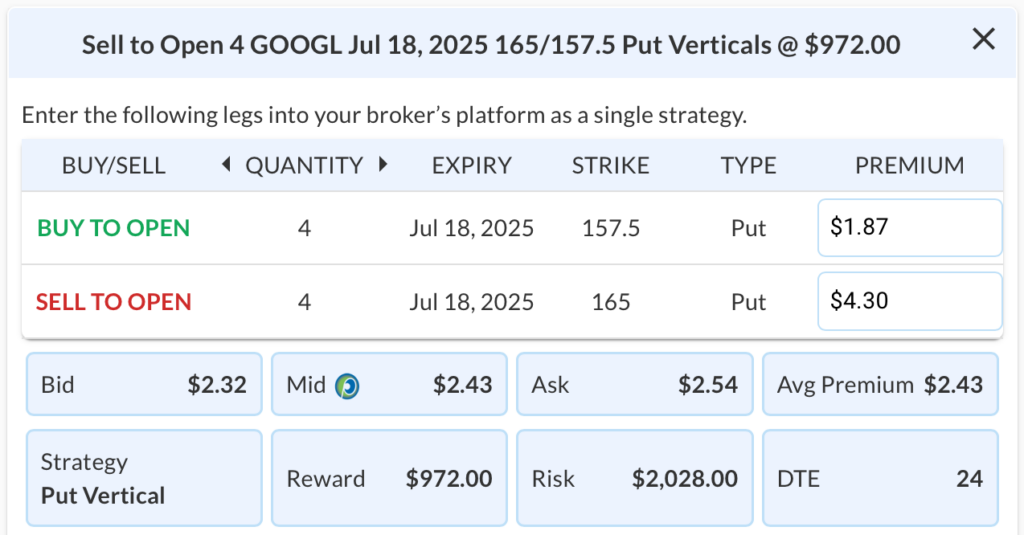
To express this bullish thesis while avoiding pre-earnings volatility expansion, we suggest selling the GOOGL Jul 18, 2025 $165/$157.50 Put Vertical for a $2.43 credit. This defined-risk trade collects premium by selling the $165 put and buying the $157.50 put. Max profit is earned if GOOGL stays at or above $165. Max loss occurs below $157.50. With a solid 2 to 1 risk-reward ratio, this setup benefits from time decay and supports our view that GOOGL holds firm or trends higher in the near term.
GOOGL – Daily
Trade Details
Strategy Details
Strategy: Short Put Vertical Spread
Direction: Bullish Credit Spread
Details: Sell to Open 4 GOOGL July 18 $165/$157.50 Put Verticals @ $2.43 Credit per Contract.
Total Risk: This trade has a max risk of $2,028 (4 Contracts x $507) based on a hypothetical $100k portfolio risking 2%. We suggest risking only 2% of the value of your portfolio and divide it by $507 to select the # contracts for your portfolio.
Trend Continuation Signal: This is a bullish trade on a stock that is expected to continue higher over the duration of this trade.
1M/6M Trends: Mildly Bearish/Neutral
Relative Strength: 2/10
OptionsPlay Score: 86
Stop Loss: @ $4.86 Debit (100% loss to value of premium)
View GOOGL Trade
Entering the Trade
Use the following details to enter the trade on your trading platform. Please note that whenever there is a multi-leg option strategy, it should be entered as a single trade.
PLEASE NOTE that these prices are based on Monday’s closing prices. Should the underlying move significantly during the pre-market hours, we will likely adjust the strikes and prices to reflect a more accurate trade entry.
View GOOGL Trade

DailyPlay – Portfolio Review – June 23, 2025
DailyPlay Portfolio Review
Our Trades
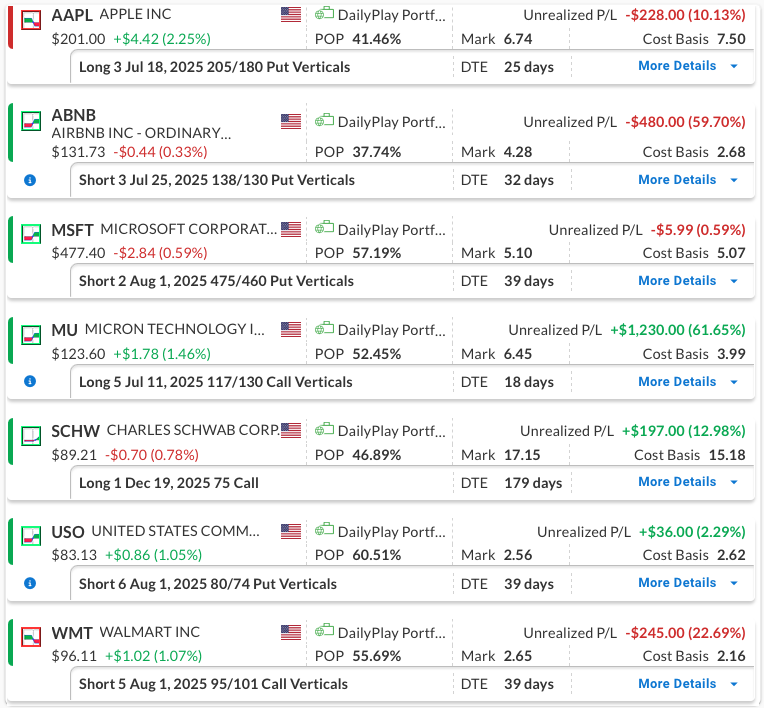
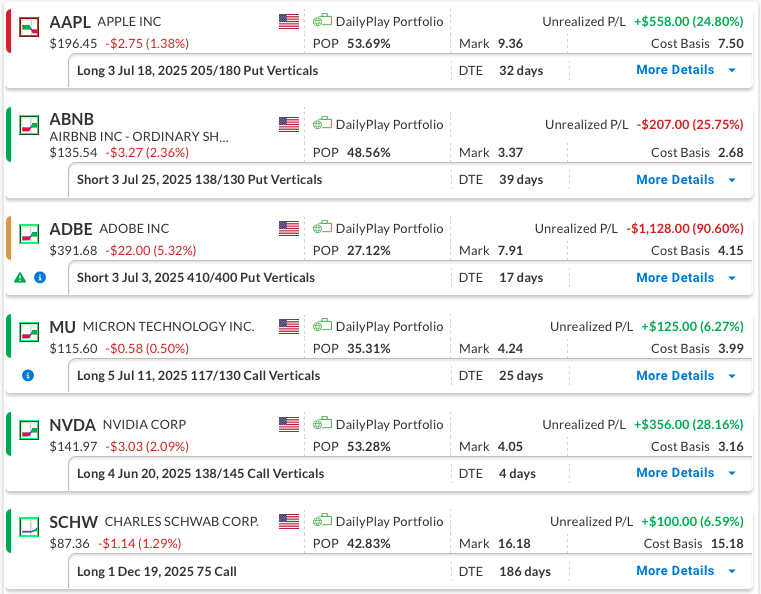
AAPL – 25 DTE
This trade has hovered around breakeven, fluctuating between modest gains and losses. Apple remains priced at a premium compared to its peers and continues to deal with unresolved concerns around the trade war and tariffs. With ample time left until expiration, we will continue to hold the position.
ABNB – 32 DTE
Bullish Credit Spread – Airbnb Inc. (ABNB) – We recently entered this position. The stock was down this week with the general direction of the market and we plan to hold our course at this time.
MSFT – 39 DTE
Bullish Credit Spread – Microsoft Corporation (MSFT) – The stock built some strong upside momentum last week. We have a solid gain and plan to stay the course for now.
MU – 18 DTE
Bullish Credit Spread – Micron Technology, Inc. (MU) – We have a solid gain in this position. MU had a strong week, with upside momentum continuing. The company is scheduled to report earnings on Wednesday, June 25th, after the market close. If the gain continues, we may look to close the position to capture profits without taking on the risk of the earnings report. We will be watching this position closely early in the week.
SCHW – 179 DTE
Bullish Long Call – Charles Schwab Corp. (SCHW) – Our outlook remains positive, supported by strong company fundamentals and continued strength in both SCHW and the broader financial sector.
USO – 39 DTE
Bullish Credit Spread – United States Oil Fund, LP (USO) – We recently established this position, and considering the geopolitical events that occurred over the weekend, we plan to stay the course for now.
WMT – 39 DTE
Bearish Credit Spread – Walmart Inc. (WMT) – We recently established this position and currently have a small gain. For now, we plan to stay the course.
USO
DailyPlay – Opening Trade (USO) – June 20, 2025
USO Bullish Opening Trade Signal
Investment Rationale
Investment Thesis
Rising geopolitical tensions in the Middle East are injecting a renewed risk premium into global oil markets, lifting the appeal of crude oil-linked ETFs such as the United States Oil Fund (USO). With the Strait of Hormuz under threat and oil futures reacting swiftly to headlines, USO stands to benefit as traders seek liquid instruments to express bullish crude views. While oil markets have at times decoupled from geopolitical events, the scale and persistence of current threats argue for sustained upward pressure on prices. Against this backdrop, USO offers a compelling vehicle to position for continued strength in oil.
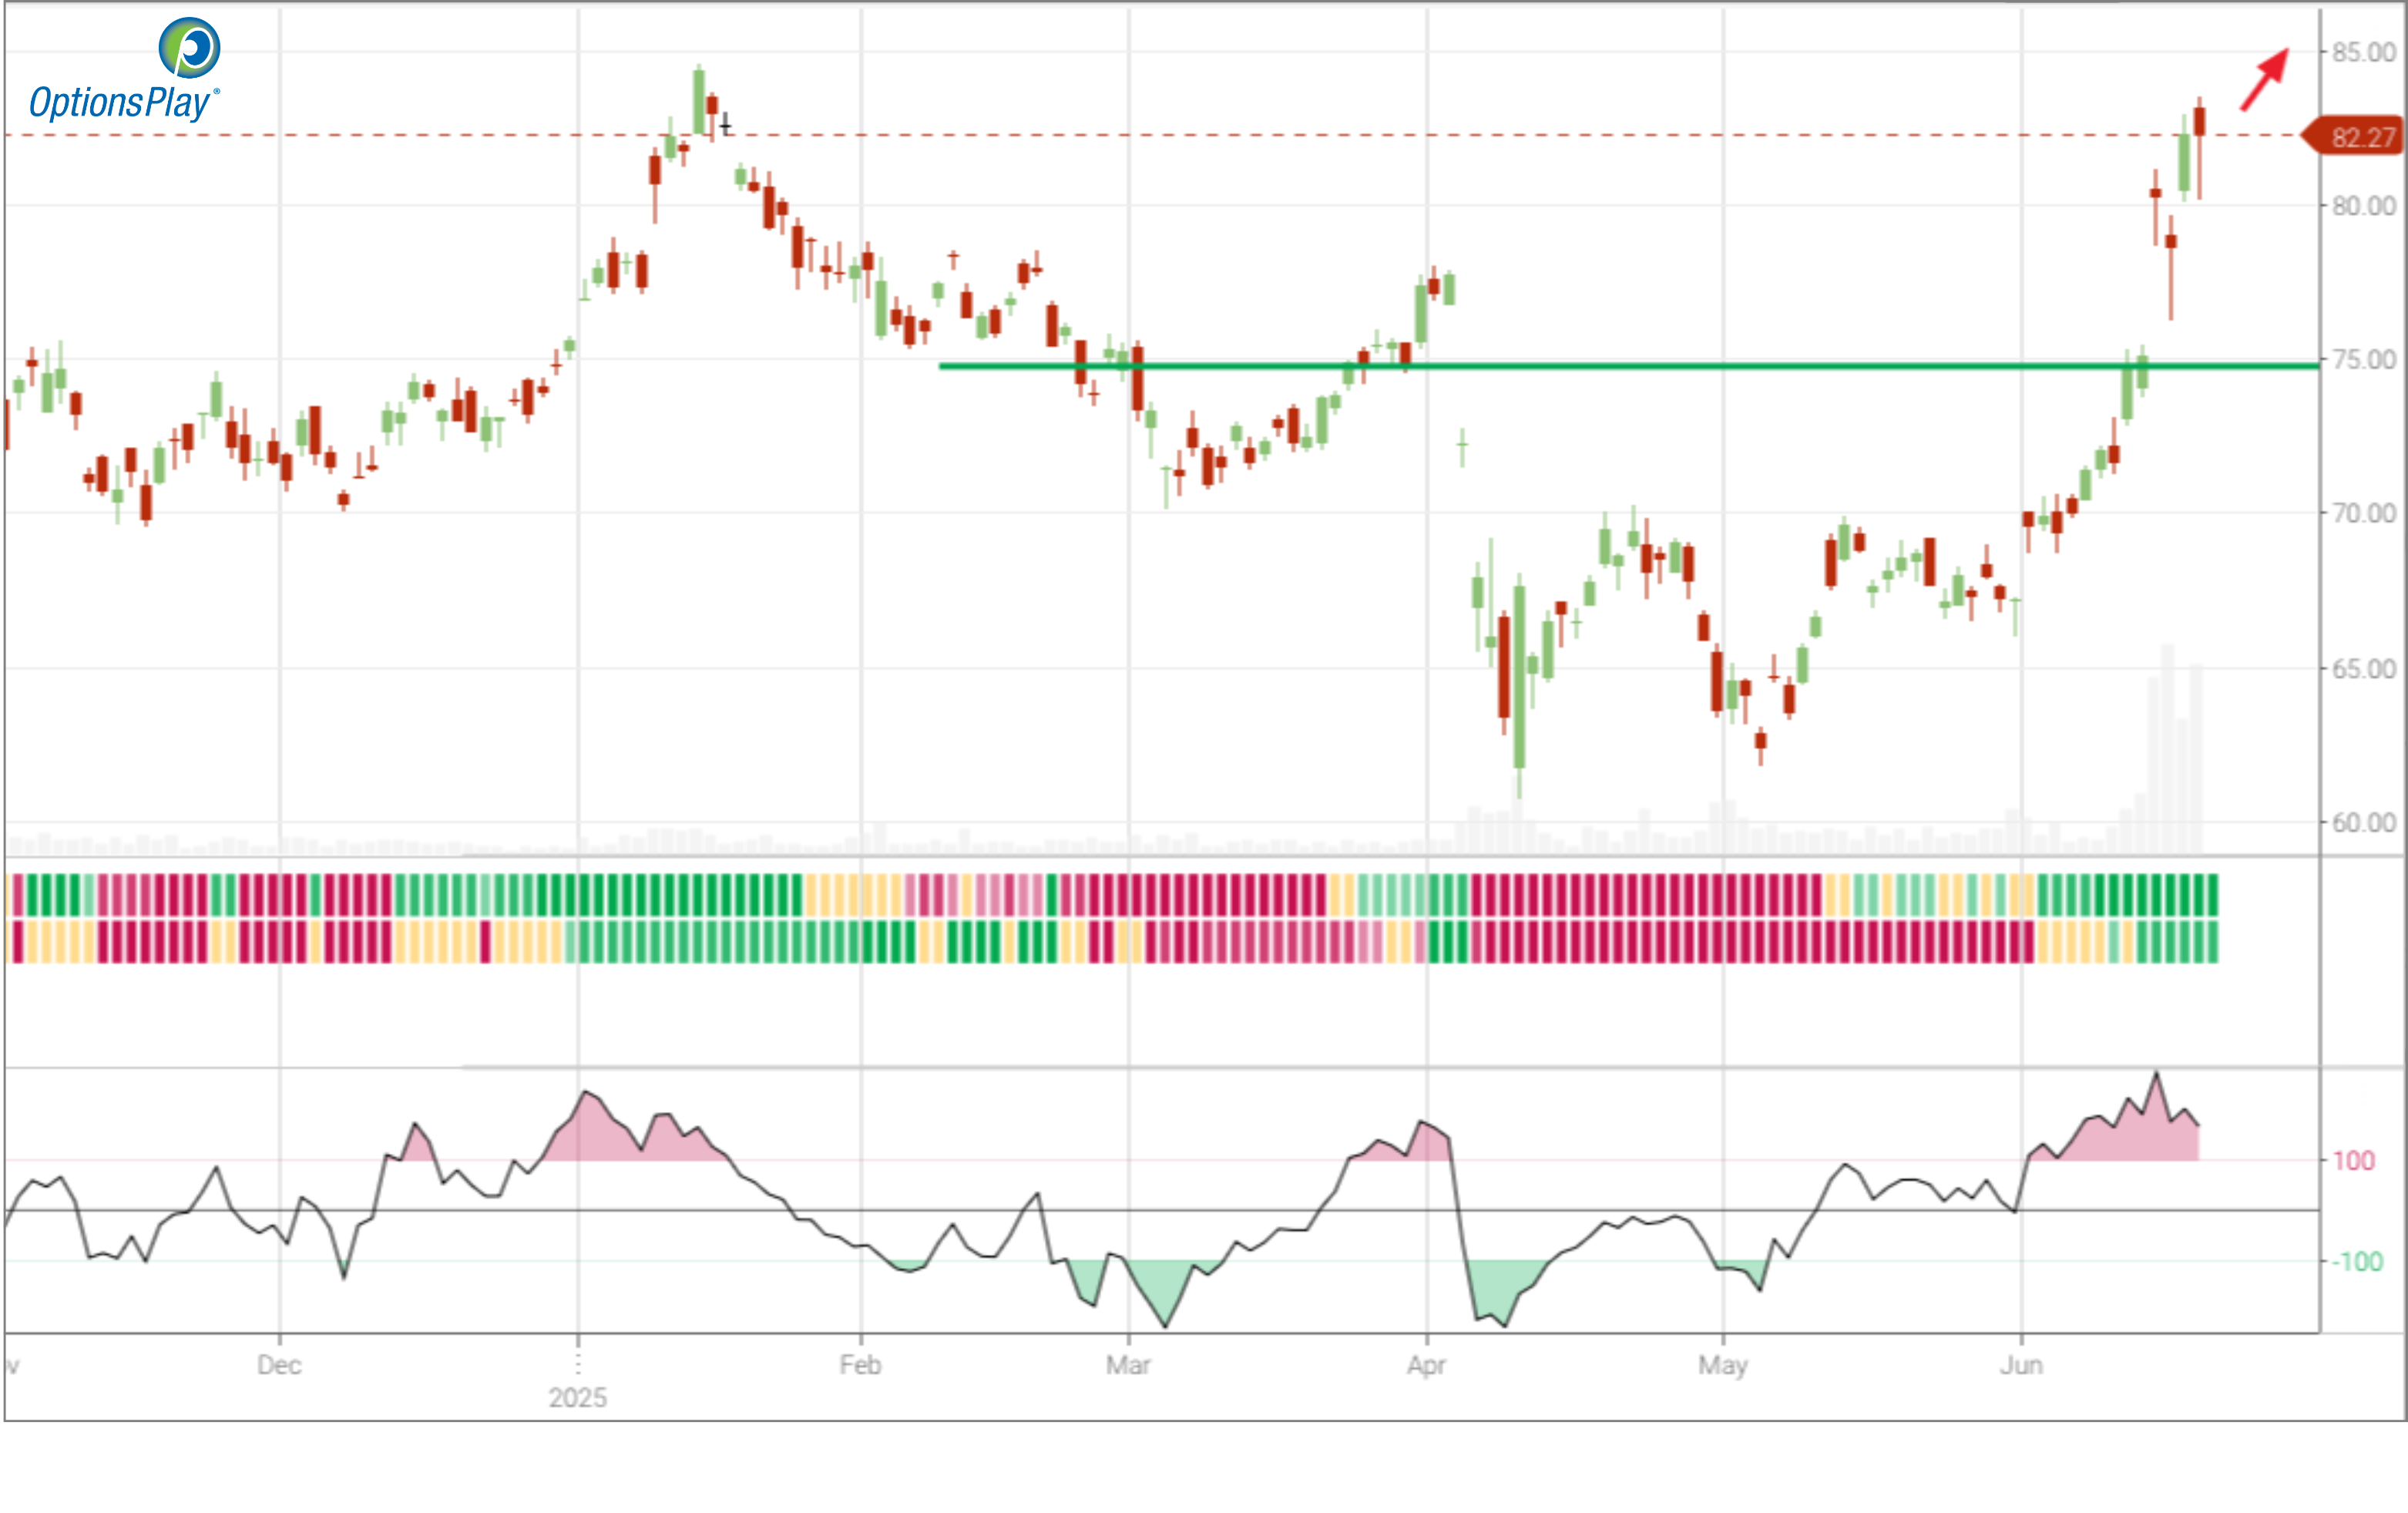
Technical Analysis
USO has recently broken above its 50-day and 20-day moving averages, reclaiming the $82 level with strong volume confirmation. The ETF shows renewed upside momentum after a prolonged consolidation between $67 and $75, with RSI turning higher but not yet overbought—suggesting additional room to run. The next technical resistance lies around $85, while the $75 area now serves as initial support. The reclaim of the 200-day moving average earlier this quarter reinforces a bullish trend reversal and validates bullish exposure with defined risk.
Commodity Analysis
Oil prices remain sensitive to geopolitical developments, and USO’s value is closely tied to the front-month WTI crude futures it holds. As global supply risks intensify, especially via the Strait of Hormuz, traders are re-pricing crude oil with a heightened premium. USO benefits directly from this repricing dynamic as a proxy for crude.
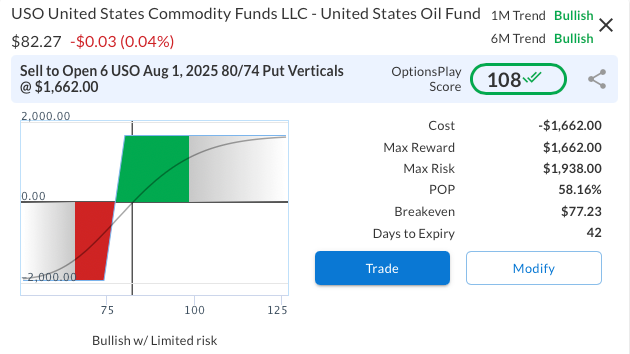
Options Trade
The trade is a bull put vertical spread, selling the USO Aug 1, 2025 $80 put and buying the $74 put for a net credit. If USO is above $80 at expiration, the maximum reward is achieved. This setup allows traders to express a bullish view without requiring a further rally—USO merely needs to hold above the short strike. The $80 level is well above technical support and reflects confidence in elevated oil prices persisting short-term due to global instability. The risk-reward ratio is 0.86, meaning for every dollar at risk, we aim to make 86 cents. A favorable volatility skew enhances the appeal of this particular trade.
USO – Daily
Trade Details
Strategy Details
Strategy: Short Put Vertical Spread
Direction: Bullish Credit Spread
Details: Sell to Open 6 USO Aug 01 $80/$74 Put Verticals @ $2.77 Credit per Contract.
Total Risk: This trade has a max risk of $1,938 (6 Contracts x $323) based on a hypothetical $100k portfolio risking 2%. We suggest risking only 2% of the value of your portfolio and divide it by $323 to select the # contracts for your portfolio.
Trend Continuation Signal: This is a bullish trade on a stock that is expected to continue higher over the duration of this trade.
1M/6M Trends: Bullish/Bullish
Relative Strength: 9/10
OptionsPlay Score: 108
Stop Loss: @ $5.54 (100% loss to value of premium)
View USO Trade
Entering the Trade
Use the following details to enter the trade on your trading platform. Please note that whenever there is a multi-leg option strategy, it should be entered as a single trade.
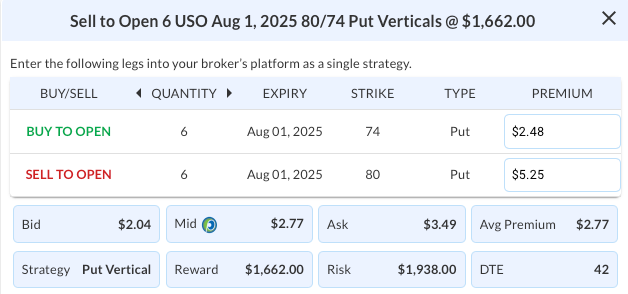
PLEASE NOTE that these prices are based on Wednesday’s closing prices. Should the underlying move significantly during the pre-market hours, we will likely adjust the strikes and prices to reflect a more accurate trade entry.
View USO Trade
WMT
DailyPlay – Opening Trade (WMT) & Closing Trade (ADBE) – June 18, 2025
Closing Trade
- ADBE – 112% loss: Buy to Close 3 Contracts (or 100% of your Contracts) July 03 $410/$400 Put Vertical Spreads @ $8.80 Debit.
DailyPlay Portfolio: By Closing 3 Contracts, we will be paying $2,640. We initially opened these 3 contracts on June 04 @ $4.15 Credit. Our loss, therefore, is $465 per contract.
WMT Bearish Opening Trade Signal
Investment Rationale
Investment Thesis:
Walmart (WMT) appears increasingly vulnerable to downside pressure following a rejection at key technical resistance and signs of overvaluation relative to its industry peers. While the retail giant continues to benefit from its defensive profile, current valuation levels and modest growth metrics do not support the prevailing premium. In a market environment increasingly sensitive to valuation and earnings quality, WMT may underperform as investors reassess risk-adjusted expectations heading into Q3. With weakening momentum and limited upside catalysts, a bearish stance is justified as the stock struggles to hold key support.
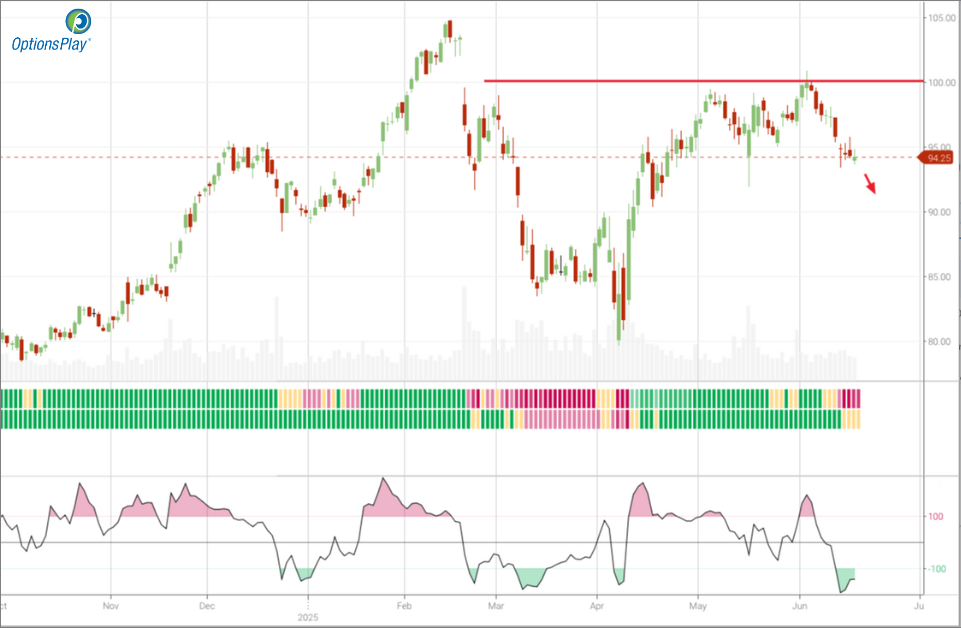
Technical Analysis:
WMT was recently rejected at the $100 level, a significant area of resistance that has capped price rallies since late 2024. The stock has since broken below its 20-day moving average and is hovering just above the 50-day, with price action showing a potential transition from consolidation to a new downtrend. The RSI sits around neutral territory, but the lack of strong buying support on recent pullbacks suggests diminishing bullish conviction. A breakdown below $91 would likely accelerate downside momentum toward its longer-term moving averages and volume support levels.
Fundamental Analysis:
Walmart trades at a meaningful valuation premium despite performance metrics that are largely in line with industry averages. This disconnect highlights the risk of multiple compression should market sentiment deteriorate or growth expectations reset lower.
- Forward PE Ratio: 36.23x vs. Industry Median 17.96x
- Expected EPS Growth: 8.99% vs. Industry Median 9.02%
- Expected Revenue Growth: 4.19% vs. Industry Median 4.98%
- Net Margins: 2.75% vs. Industry Median 2.36%
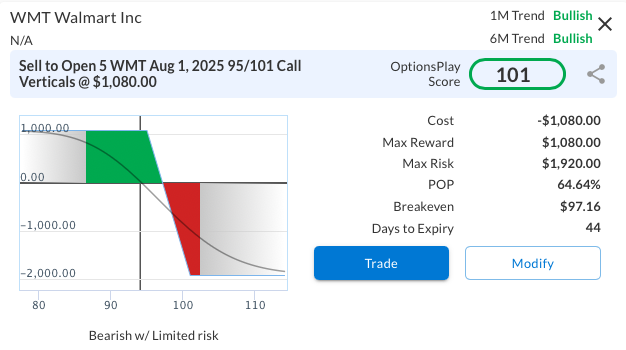
Options Trade:
Sell the WMT Aug 1, 2025, 95/101 bear call vertical spread for a net credit. This bearish position reaches maximum profit if WMT closes below $95 at expiration. The structure presents an attractive 0.56 risk/reward profile and benefits from both time decay and bearish price action. With shares currently near $94.25, the spread is strategically placed just above resistance, offering a high-probability setup if WMT continues to stall or weaken.
WMT – Daily
Trade Details
Strategy Details
Strategy: Short Call Vertical Spread
Direction: Bearish Credit Spread
Details: Sell to Open 5 WMT Aug 01 $95/$101 Call Vertical Spreads @ $2.16 Credit per Contract.
Total Risk: This trade has a max risk of $1,920 (5 Contracts x $384) based on a hypothetical $100k portfolio risking 2%. We suggest risking only 2% of the value of your portfolio and divide it by $384 to select the # contracts for your portfolio.
Trend Continuation Signal: This is a bearish trade on a stock that is expected to continue lower over the duration of this trade.
1M/6M Trends: Bearish/Neutral
Relative Strength: 4/10
OptionsPlay Score: 101
Stop Loss: @ $4.32 (100% loss to value of premium)
View WMT Trade
Entering the Trade
Use the following details to enter the trade on your trading platform. Please note that whenever there is a multi-leg option strategy, it should be entered as a single trade.
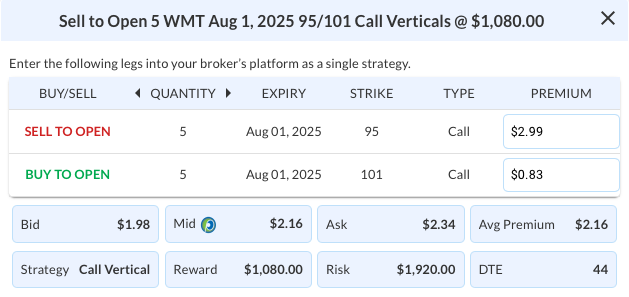
PLEASE NOTE that these prices are based on Tuesday’s closing prices. Should the underlying move significantly during the pre-market hours, we will likely adjust the strikes and prices to reflect a more accurate trade entry.
View WMT Trade
MSFT
DailyPlay – Opening Trade (MSFT) & Closing Trade (NVDA) – June 17, 2025
Closing Trade
- NVDA – 60% gain: Sell to Close 4 Contracts (or 100% of your Contracts) June 20 $138/$145 Call Vertical Spreads @ $5.39 Credit. DailyPlay Portfolio: By Closing 4 Contracts, we will be collecting $2,156. We adjusted the 4 short calls June 03 reducing our cost basis to $1,348 Debit. Our gain, therefore, is $808.
MSFT Bullish Opening Trade Signal
Investment Rationale
Investment Thesis
Microsoft stands out as both offense and defense among mega-cap tech stocks. Its core enterprise business is highly resilient, shielding it from consumer-driven macro headwinds and making it a stable defensive play amid market volatility. On offense, Azure remains the fastest-growing hyperscaler, with 35 percent revenue growth and a significant AI contribution, well ahead of AWS and Google Cloud. Microsoft’s deep AI integration, powered by OpenAI, positions it squarely at the forefront of the next technology wave. With a dominant footprint across cloud, productivity, and developer ecosystems, MSFT is well positioned to deliver durable long-term growth while providing downside protection.
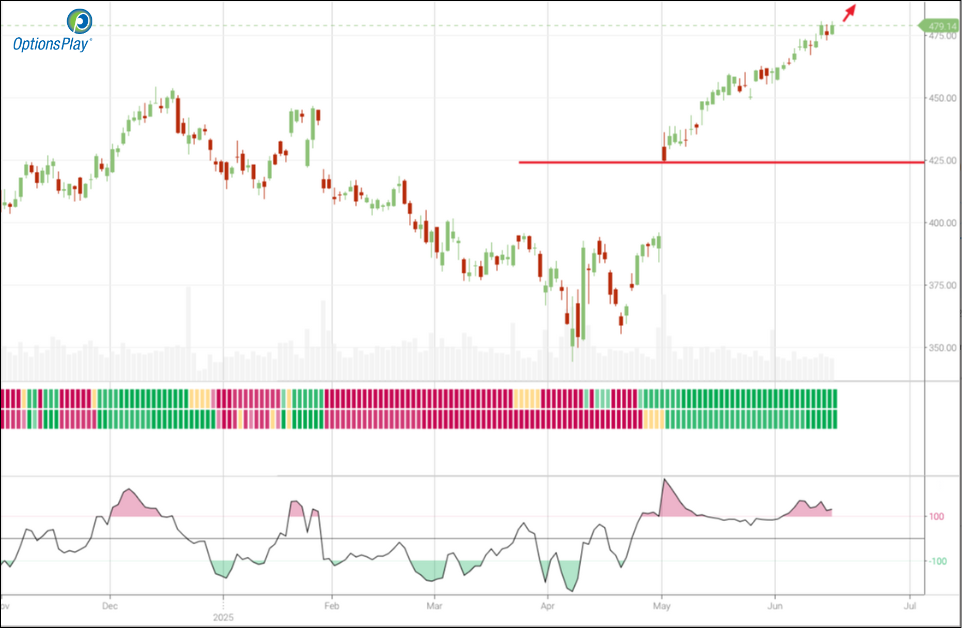
Technical Analysis
MSFT recently broke out cleanly above 420 resistance and has since accelerated to new all-time highs near 480, maintaining a strong, orderly uptrend. Price is firmly above all major moving averages, with the 20-day EMA providing steady support. While RSI is extended, it is not diverging, indicating ongoing trend strength rather than exhaustion. Relative strength ranks high at 9 out of 10, and volume confirms conviction behind the move. With strong momentum in place, MSFT looks poised to push toward the 520 area in the near term.
Fundamental Analysis
Microsoft’s premium valuation is supported by best-in-class fundamentals and strategic leadership in AI and cloud infrastructure. Its scale, fortress balance sheet, and high-margin software model uniquely combine growth and defensiveness.
- Forward PE Ratio: 31.48x vs. Industry Median 27.72x
- Expected EPS Growth: 14.24% vs. Industry Median 11.48%
- Expected Revenue Growth: 13.87% vs. Industry Median 9.36%
- Net Margins: 35.79% vs. Industry Median 9.80%
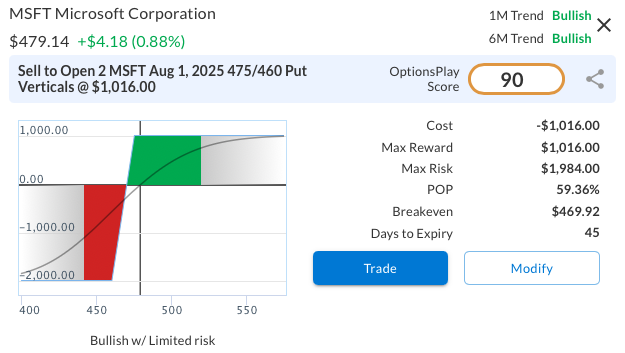
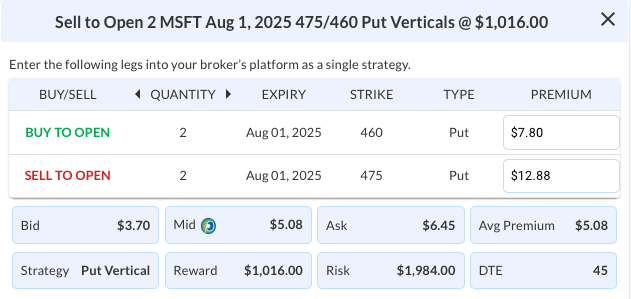
Options Trade
To establish a bullish position with defined risk, sell the MSFT Aug 1, 2025, 475/460 put vertical spread for a net credit. This bull put vertical spread achieves maximum profit if MSFT closes above $475 at expiration, offering a high-probability, risk-controlled strategy. With a risk/reward ratio of 0.51, this trade aims to earn $0.51 for every $1.00 risked, making it an attractive option for bullish investors seeking a high-probability strategy to complement their optimistic outlook on MSFT.
MSFT – Daily
Trade Details
Strategy Details
Strategy: Short Put Vertical Spread
Direction: Bullish Credit Spread
Details: Sell to Open 2 MSFT Aug 01 $475/$460 Put Verticals @ $5.08 Credit per Contract.
Total Risk: This trade has a max risk of $1,984 (2 Contracts x $992) based on a hypothetical $100k portfolio risking 2%. We suggest risking only 2% of the value of your portfolio and divide it by $992 to select the # contracts for your portfolio.
Trend Continuation Signal: This is a bullish trade on a stock that is expected to continue higher over the duration of this trade.
1M/6M Trends: Bullish/Bullish
Relative Strength: 9/10
OptionsPlay Score: 90
Stop Loss: @ $10.16 (100% loss to value of premium)
View MSFT Trade
Entering the Trade
Use the following details to enter the trade on your trading platform. Please note that whenever there is a multi-leg option strategy, it should be entered as a single trade.
PLEASE NOTE that these prices are based on Monday’s closing prices. Should the underlying move significantly during the pre-market hours, we will likely adjust the strikes and prices to reflect a more accurate trade entry.
View MSFT Trade
DailyPlay – Portfolio Review – June 16, 2025
DailyPlay Portfolio Review
Our Trades
AAPL – 32 DTE
Bearish Debit Spread – Apple Inc. (AAPL) – Apple’s stock showed weakness last week, with signs of modest downside pressure emerging. AAPL still trades at a premium to its peers, and ongoing concerns about tariffs and trade dynamics remain a factor. With sufficient time until expiration, we are holding the position to allow the trade thesis to continue to play out.
ABNB – 39 DTE
Bullish Credit Spread – Airbnb Inc. (ABNB) – We recently entered this position. The stock was down this week with the general direction of the market and we plan to hold our course at this time.
ADBE – 17 DTE
Bullish Credit Spread – Adobe Inc. (ADBE) – Adobe’s Q2 results met expectations with a modest beat and upward guidance revision. However, investor sentiment turned cautious, sending the stock down 5.32% post-announcement, bringing it close to our max loss. We believe the underlying fundamentals remain favorable and are maintaining the trade following earnings. While the stock’s reaction warrants attention, we continue to see enough strength to justify holding the position, though we’ll monitor the trend closely.
MU – 25 DTE
Bullish Credit Spread – Micron Technology, Inc. (MU) – We recently entered this position. The stock had a solid week despite a challenging overall market, and we plan to hold our course at this time. The company is set to report earnings on Wednesday, June 25th, after market close.
NVDA – 4 DTE
Bullish Debit Spread – Nvidia Corp. (NVDA) – Since the earnings announcement, this trade has hovered near breakeven, fluctuating between small gains and losses. With NVDA showing some weakness last week and expiration approaching quickly, we’re likely to close the position early this week to manage risk effectively.
SCHW – 186 DTE
Bullish Long Call – Charles Schwab Corp. (SCHW) – Our outlook remains positive, supported by strong company fundamentals and continued strength in both SCHW and the broader financial sector.
ABNB
DailyPlay – Opening Trade (ABNB) & Closing Trade (TMUS) – June 13, 2025
Closing Trade
- TMUS – 82% gain: Buy to Close 3 Contracts (or 100% of your Contracts) July 18 $250/$260 Call Vertical Spreads @ $0.69 Debit. DailyPlay Portfolio: By Closing 3 Contracts, we will be paying $207. We initially opened these 3 contracts on June 06 @ $3.74 Credit. Our gain, therefore, is $915.
ABNB Bullish Opening Trade Signal
Investment Rationale
Investment Thesis
Airbnb Inc. (ABNB) remains a standout in the Travel & Leisure sector, leveraging its capital-light model, global brand recognition, and operational efficiency to drive consistent growth. As the platform transitions from early-stage volatility into sustained profitability, it benefits from durable secular trends in alternative lodging and post-pandemic travel normalization. With a business model that scales efficiently and a healthy balance of margin expansion and top-line growth, ABNB is well-positioned to command a valuation premium. This backdrop supports a constructive outlook and justifies bullish positioning into the summer travel season.
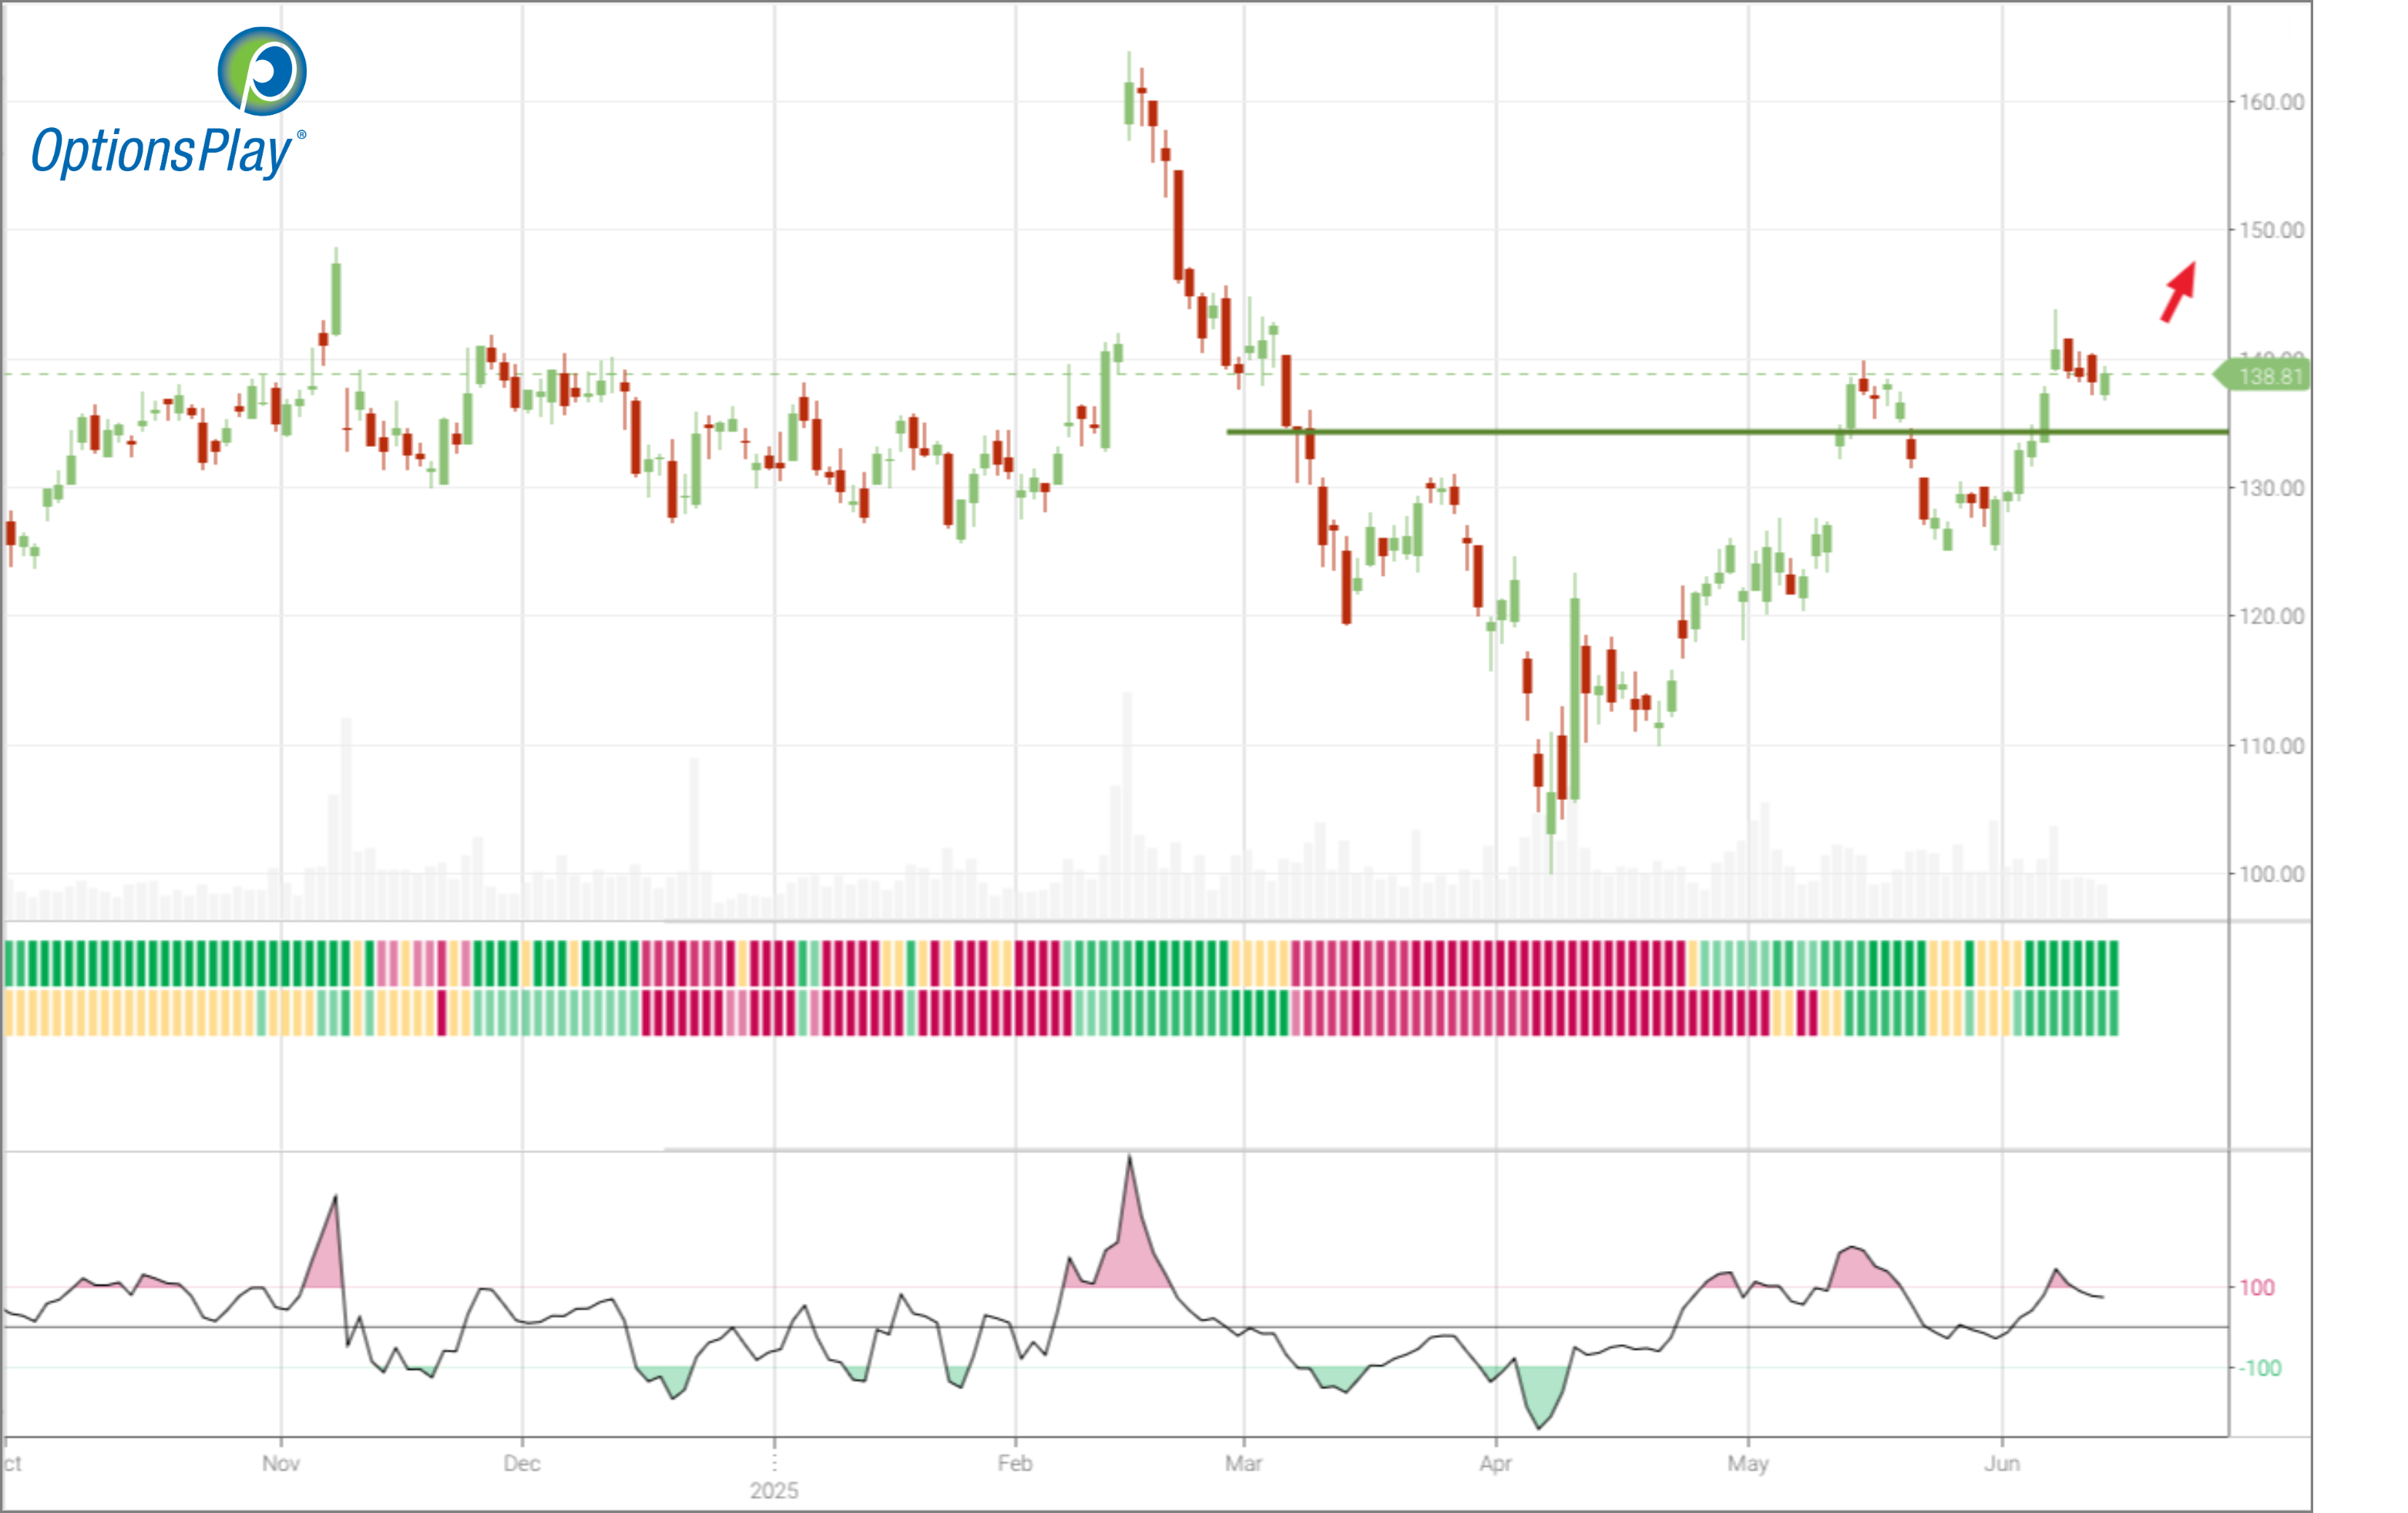
Technical Analysis
ABNB has reasserted its bullish posture following a clean breakout above its 200-day moving average at $134.76, now acting as firm support. The recent advance to $138.81, accompanied by a +0.75% gain on strong volume, reflects renewed momentum and buyer conviction. The 50-day moving average continues to trend higher, reinforcing a structurally sound uptrend. With an RSI of 41.01, the stock is far from overbought, suggesting ample room for upside extension. These technical signals collectively point to a favorable risk/reward setup for bullish exposure above the $138 level.
Fundamental Analysis
ABNB continues to outpace industry peers on key financial metrics, reinforcing the quality of its growth profile:
- Forward PE Ratio: 33.01x vs. Industry Median 17.30x
- Expected EPS Growth: 11.25% vs. Industry Median 10.91%
- Expected Revenue Growth: 9.24% vs. Industry Median 5.11%
- Net Margins: 22.60% vs. Industry Median 9.90%
Options Trade
To capitalize on the bullish setup, consider selling the Jul 25, 2025 $138/$130 put vertical for a net credit. offering a risk/reward ratio just under 1:2. The position profits if ABNB remains above $138 through expiration, which aligns with technical support and ongoing fundamental strength. With 43 days to expiry, this spread provides an efficient way to express a bullish thesis while maintaining downside protection in a well-structured risk envelope.
ABNB – Daily
Trade Details
Strategy Details
Strategy: Short Put Vertical Spread
Direction: Bullish Credit Spread
Details: Sell to Open 3 ABNB Jul 25 138/130 Put Verticals @ $2.68 Credit per Contract.
Total Risk: This trade has a max risk of $1,596 (3 Contracts x $532) based on a hypothetical $100k portfolio risking 2%. We suggest risking only 2% of the value of your portfolio and divide it by $532 to select the # contracts for your portfolio.
Trend Continuation Signal: This is a bullish trade on a stock that is expected to continue higher over the duration of this trade.
1M/6M Trends: Bullish/Bullish
Relative Strength: 5/10
OptionsPlay Score: 86
Stop Loss: @ $5.36 (100% loss to value of premium)
View ABNB Trade

Entering the Trade
Use the following details to enter the trade on your trading platform. Please note that whenever there is a multi-leg option strategy, it should be entered as a single trade.

PLEASE NOTE that these prices are based on Thursday’s closing prices. Should the underlying move significantly during the pre-market hours, we will likely adjust the strikes and prices to reflect a more accurate trade entry.