

GS

DailyPlay – Adjusting Trade (GS) – September 12, 2025

GS Bullish Trade Adjustment Signal
Investment Rationale
Adjustment Rationale:
Goldman Sachs Group, Inc. (GS) – Our outlook remains bullish over the long term. A strengthening macroeconomic environment is expected to fuel growth in deal-making, lending, and trading activity, while potential changes in M&A regulation could reduce costs and accelerate approvals. Together, these factors support GS’s potential to generate solid returns as we head into the new year.
Adjustment Trade:
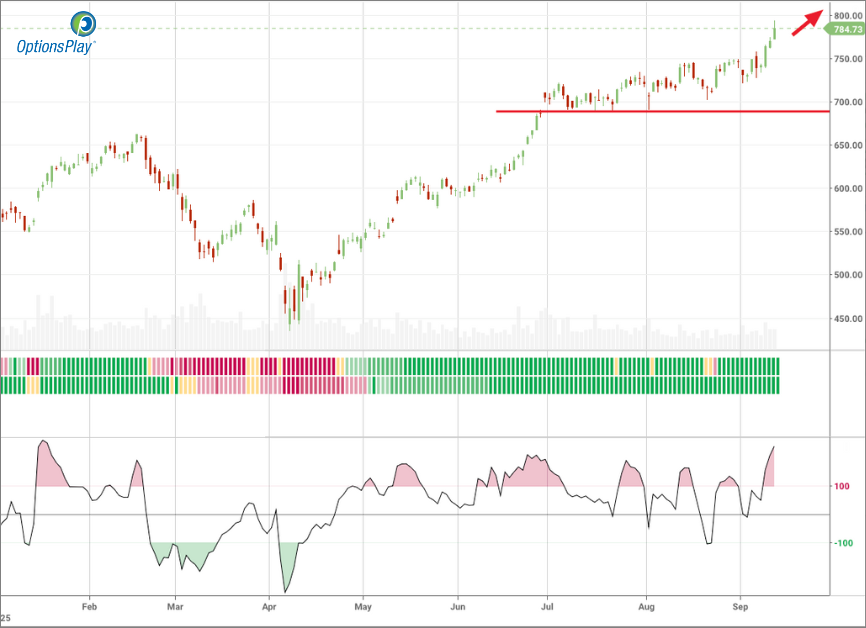
GS @ $784.73
Days to Expiration (DTE): 21
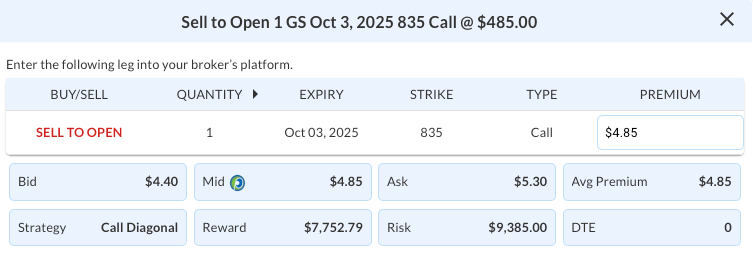
Sell to Open 1 Oct 3, 2025 835 Call @ $4.85
Mid: $4.85
Premium Received: $485.00 per call option sold
or $485 total adjustment in the cost basis for the position.
The total risk for the new position is $9,870 (original cost basis) minus $485 (net credit from the adjustment), resulting in a revised cost basis of $9,385.
Resulting Position:
Long 1 GS Jan 16, 2026 675 Call
Short 1 GS Oct 3, 2025 835 Call
New Cost Basis and total risk of $9,385
GS – Daily
Trade Details
Strategy Details
Strategy: Short Call
Direction: Resulting in a new Bullish Diagonal Spread
Details: Sell to Open 1 GS Oct 3 $835 Call @ $4.85 Credit.
Total Risk: The resulting position has a maximum risk of $9,385 (9,870-485), calculated as the initial cost basis of the long call ($9,870) minus the premium received from the adjustment ($485).
Trend Continuation Signal: This is a bullish trade on a stock that is expected to continue higher over the duration of the trade.
1M/6M Trends: Bullish/Bullish
Relative Strength: 9/10
Stop Loss: @ $46.93 (50% loss of premium)
Entering the Trade
Use the following details to enter the trade on your trading platform. Please note that whenever there is a multi-leg option strategy, it should be entered as a single trade.
PLEASE NOTE that these prices are based on Thursday’s closing prices. Should the underlying move significantly during the pre-market hours, we will likely adjust the strikes and prices to reflect a more accurate trade entry.
SPOT

DailyPlay – Opening Trade (SPOT) & Closing Trade (GILD, SNPS) – September 11, 2025
Closing Trade
- GILD – 41% gain: Buy to Close 5 Contracts (or 100% of your Contracts) Oct 10 $110/$105 Put Vertical Spreads @ $0.89 Debit. DailyPlay Portfolio: By Closing 5 Contracts, we will be paying $445. We initially opened these 5 contracts on August 29 @ $1.50 Credit. Our gain, therefore, is $305.
- SNPS – 92% loss: Sell to Close 1 Contract (or 100% of your Contracts) Oct 24 $610/$670 Call Vertical Spreads @ $1.67 Credit. DailyPlay Portfolio: By Closing 1 Contract, we will be collecting $167. We initially opened this contract on September 09 @ $20.70 Debit. Our loss, therefore, is $1,903 per contract.
SPOT Bearish Opening Trade Signal
Investment Rationale
Investment Thesis
Spotify Technology (SPOT) has come under pressure following a disappointing Q2 2025 earnings report that underscored cracks in its growth execution and cost management. The stock, now trading near $704, sits meaningfully below its $785 peak, reflecting diminished investor confidence. While the company continues to benefit from strong brand recognition and a leading position in streaming, its premium valuation and weaker-than-expected profitability make it vulnerable to further downside. With revenue growth under scrutiny and cost efficiency challenges weighing on margins, risk/reward skews bearish at current levels.
Technical Analysis
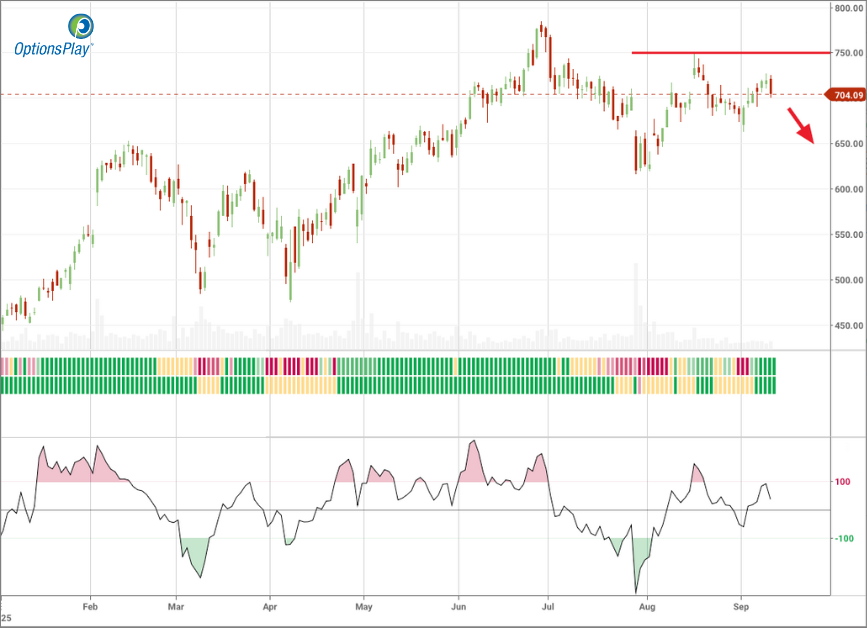
SPOT’s price action shows clear rejection at the $750 resistance area, with subsequent selling pressure pushing shares back toward the 50- and 20-day moving averages. The stock is currently trading tightly around these levels, reflecting indecision but with a downside bias given the recent failure at the highs. It appears to be in a consolidation phase near the moving averages, and a break below the recently established $663 low could accelerate selling momentum, potentially driving the stock back toward the 200-day moving average.
Fundamental Analysis
Despite its strong market position, Spotify trades at a valuation that looks stretched relative to peers. Elevated expectations for growth have not been fully met, as evidenced by recent revenue and operating income misses. This raises questions about sustainability in a competitive landscape. Key valuation and profitability metrics include:
- Forward PE Ratio: 51.59x vs. Industry Median 21.29x
- Expected EPS Growth: 45.57% vs. Industry Median 13.75%
- Expected Revenue Growth: 17.59% vs. Industry Median 13.01%
- Net Margins: 4.72% vs. Industry Median 3.98%
Options Trade
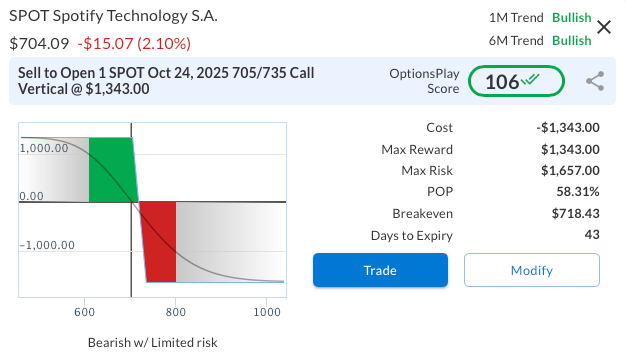
A defined-risk bearish strategy can be structured through a bear call vertical spread. Specifically, selling the SPOT October 24, 2025, 705/735 call vertical at $13.43 offers a maximum profit of $1,343 against a maximum risk of $1,657, equating to a risk/reward ratio of roughly 1.23:1. This setup benefits if SPOT remains below $705 at expiry. The trade provides a balanced profile, where the limited upside risk is manageable relative to the potential return, while time decay steadily works in favor of the short premium. Overall, this spread provides an efficient and disciplined way to express a bearish view.
SPOT – Daily
Trade Details
Strategy Details
Strategy: Short Call Vertical Spread
Direction: Bearish Credit Spread
Details: Sell to Open 1 SPOT Oct 24 $705/$735 Call Vertical Spreads @ $13.43 Credit per Contract.
Total Risk: This trade has a max risk of $1,657 (1 Contract x $1,657) based on a hypothetical $100k portfolio risking 2%. We suggest risking only 2% of the value of your portfolio and divide it by $1,657 to select the # contracts for your portfolio.
Counter-Trend Signal: This is a bearish trade on a stock that is expected to continue lower over the duration of this trade.
1M/6M Trends: Bullish/Bullish
Relative Strength: 9/10
OptionsPlay Score: 106
Stop Loss: @ $26.86 (100% loss to value of premium)
View SPOT Trade
Entering the Trade
Use the following details to enter the trade on your trading platform. Please note that whenever there is a multi-leg option strategy, it should be entered as a single trade.
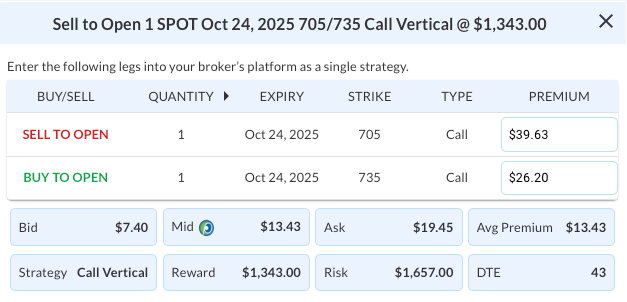
PLEASE NOTE that these prices are based on Wednesday’s closing prices. Should the underlying move significantly during the pre-market hours, we will likely adjust the strikes and prices to reflect a more accurate trade entry.
View SPOT Trade
$SBUX

DailyPlay – Closing Trade (SBUX) – September 10, 2025
Closing Trade
- SBUX – 50% gain: Buy to Close 5 Contracts (or 100% of your Contracts) Oct 17 $90/$95 Call Vertical Spreads @ $0.70 Debit. DailyPlay Portfolio: By Closing 5 Contracts, we will be paying $350. We initially opened these 5 contracts on September 04 @ $1.41 Credit. Our gain, therefore, is $355.
SNPS
DailyPlay – Opening Trade (SNPS) & Closing Trade (TTWO) – September 09, 2025
Closing Trade
- TTWO – 115% loss: Buy to Close 3 Contracts (or 100% of your Contracts) Oct 03 $235/$245 Call Vertical Spreads @ $7.25 Debit. DailyPlay Portfolio: By Closing 3 Contracts, we will be paying $2,175. We initially opened these 3 contracts on August 26 @ $3.37 Credit. Our loss, therefore, is $388 per contract.
SNPS Bullish Opening Trade Signal
Investment Rationale
Investment Thesis
Synopsys, Inc. (SNPS) is well positioned for continued outperformance as it approaches earnings, supported by both strong structural demand in software-driven semiconductor design and resilient earnings growth expectations. The company has consistently demonstrated pricing power and scale advantages that allow it to outperform peers, and with industry adoption of AI-driven workflows accelerating, SNPS is expected to benefit from increased design complexity and recurring revenue streams. Heading into the earnings release tonight after the close, the stock’s recent consolidation provides an attractive setup for a potential upside move.
Technical Analysis
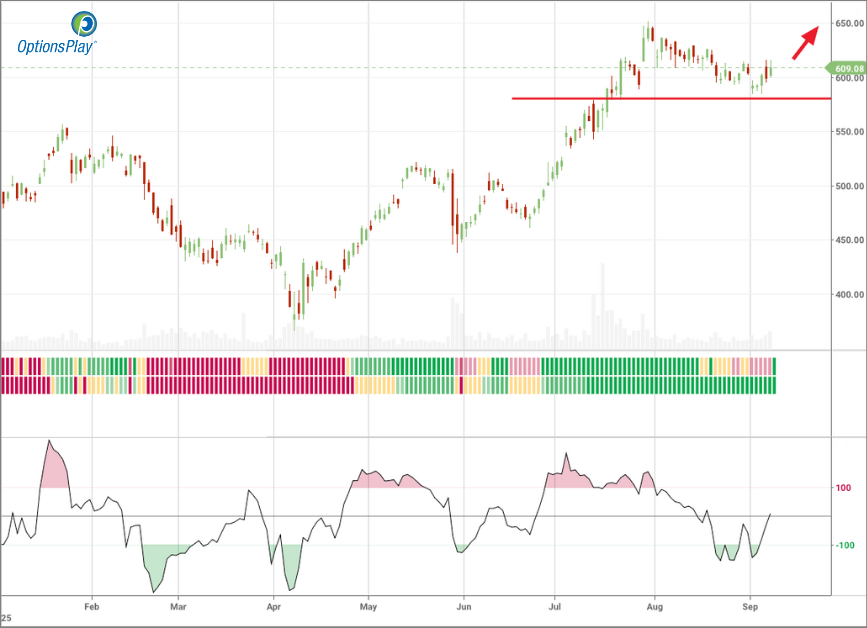
Inside the OptionsPlay platform, a Bullish Trend Following Alert was generated when Synopsys, Inc. showed a modest pullback within its broader uptrend, presenting an appealing risk/reward setup for traders seeking a bullish position. When the stock broke above the $580 resistance level, set a new all-time high of $651.73, and has since retraced, consolidating around the 20-day and 50-day moving averages while remaining solidly above the 200-day moving average. With the RSI steady at 53, conditions remain favorable for further upside, with $650 as our target. The earnings report could provide the catalyst to break the stock out of this consolidation pattern.
Fundamental Analysis
Synopsys trades at a valuation premium relative to industry averages, but this is underpinned by superior growth and profitability metrics. The company’s margins and forward growth expectations outpace peers, justifying the elevated multiple and highlighting further potential for earnings-driven upside.
- Forward PE Ratio: 35.72x vs. Industry Median 24.02x
- Expected EPS Growth: 14.01% vs. Industry Median 12.38%
- Expected Revenue Growth: 15.63% vs. Industry Median 9.43%
- Net Margins: 34.77% vs. Industry Median 9.10%
Options Trade
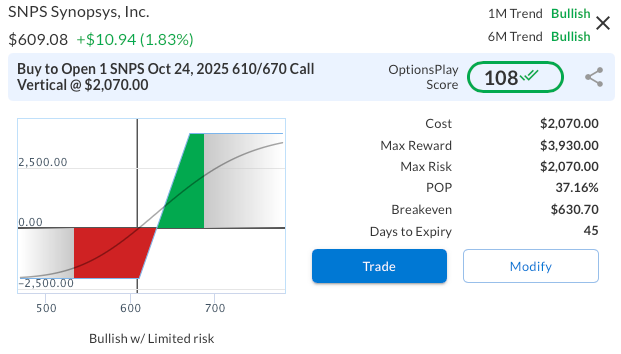
The proposed strategy is a bullish call vertical on Synopsys (SNPS), using the October 24th expiration. The trade involves buying the 610 strike call and selling the 670 strike call for a net debit of $20.70, or $2,070 per spread. This defines risk at $2,070, with a maximum reward potential of $3,930 if SNPS closes above $670 at expiration. The structure is efficient, as it lowers the upfront cost compared to outright calls while maintaining strong upside leverage. With 46 days until expiration, the trade allows time for momentum to follow through, and the risk/reward skew of nearly 2:1 makes it a favorable way to position for continued strength in the stock.
SNPS – Daily
Trade Details
Strategy Details
Strategy: Long Call Vertical Spread
Direction: Bullish Debit Spread
Details: Buy to Open 1 SNPS Oct 24 $610/$670 Call Vertical Spreads @ $20.70 Debit per Contract.
Total Risk: This trade has a max risk of $20,70 (1 Contract x $2,070) based on a hypothetical $100k portfolio risking 2%. We suggest risking only 2% of the value of your portfolio and divide it by $2,070 to select the # contracts for your portfolio.
Trend Continuation Signal: This is a bullish trade on a stock that is expected to continue higher over the duration of this trade.
1M/6M Trends: Bullish/Bullish
Relative Strength: 9/10
OptionsPlay Score: 108
Stop Loss: @ $10.35 (50% loss of premium)
View SNPS Trade
Entering the Trade
Use the following details to enter the trade on your trading platform. Please note that whenever there is a multi-leg option strategy, it should be entered as a single trade.
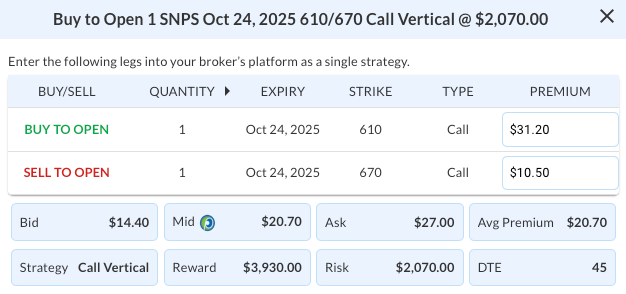
PLEASE NOTE that these prices are based on Monday’s closing prices. Should the underlying move significantly during the pre-market hours, we will likely adjust the strikes and prices to reflect a more accurate trade entry.
View SNPS Trade

DailyPlay – Portfolio Review – September 08, 2025
DailyPlay Portfolio Review
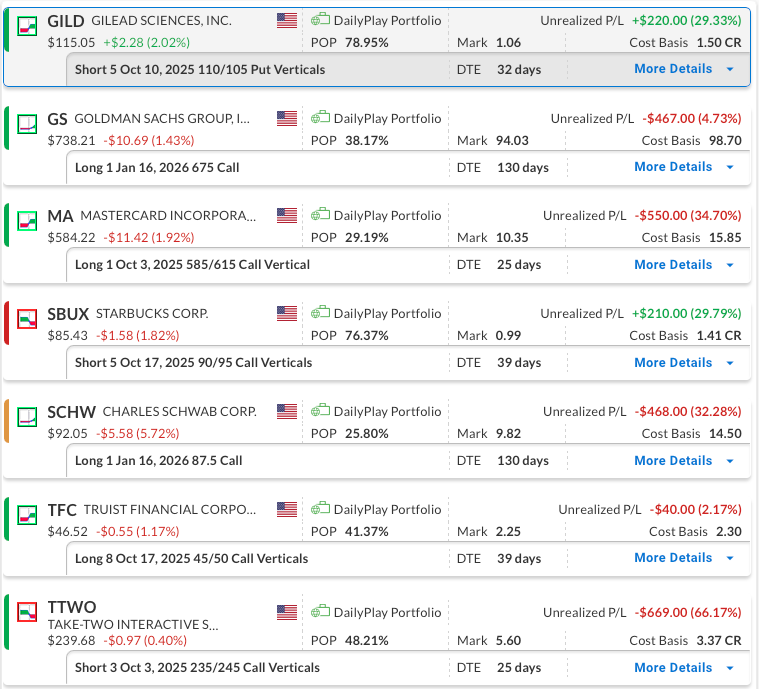
Our Trades
GILD – 32 DTE
Bullish Credit Spread – Gilead Sciences (GILD) – The position is currently profitable. We established this position with the view that the bullish thesis remains intact as long as $110 support holds, and we plan to stay the course for now.
GS – 130 DTE
Bullish Long Call – Goldman Sachs Group, Inc. (GS) – Our outlook remains bullish over the longer term, and we intend to hold the position. A weaker-than-expected jobs report on Friday pressured shares of major banks and brokerages, including Goldman Sachs.
MA – 25 DTE
Bullish Debit Spread – Mastercard Incorporated (MA) – We initially entered this position with a straight long call due to the very low IV rank of 6/100, which made spreads less attractive. The position has moved lower with the financial sector, and with less than 30 days to expiration, we converted to a bull call spread last week by adding a short option to reduce risk while retaining meaningful upside. This adjustment limits potential gains on a sharp breakout but keeps the trade aligned with our bullish outlook.
SBUX – 39 DTE
Bearish Credit Spread – Starbucks Corporation (SBUX) – We recently established this position and we plan to stay the course for now.
SCHW – 130 DTE
Bullish Long Call – Charles Schwab Corp. (SCHW) – We maintain our bullish outlook on Schwab. After our initial long call reached a delta of 1.00, we captured the gain and rolled into a higher strike call with a 0.80 delta and later expiration. Shares of major banks and brokerages, including Schwab, moved lower on Friday after a weaker-than-expected jobs report raised concerns about a slowing economy, as financial institutions are sensitive to both inflationary pressures and economic slowdowns. We will continue to monitor the position and may sell calls to reduce risk if the timing is appropriate.
TFC – 39 DTE
Bullish Debit Spread – Truist Financial Corporation (TFC) – We recently established this position and we plan to stay the course for now.
TTWO – 25 DTE
Bearish Credit Spread – Take-Two Interactive Software, Inc. (TTWO) – TTWO faces short-term downside pressure as the \$240 level acts as near-term resistance and momentum shows signs of fading. The position is currently negative, but with time remaining, we plan to hold and monitor whether the resistance area holds in the short term.
MA
DailyPlay – Adjusting Trade (MA) & Closing Trade (AMZN) – September 05, 2025
Closing Trade
- AMZN – 50% gain: Buy to Close 2 Contracts (or 100% of your Contracts) Sep 19 $230/$220 Put Vertical Spreads @ $1.63 Debit. DailyPlay Portfolio: By Closing 2 Contracts, we will be paying $326. We initially opened these 2 contracts on August 15 @ $3.27 Credit. Our gain, therefore, is $328.
MA Bullish Trade Adjustment Signal
Investment Rationale
Adjustment Rationale:
Mastercard (MA) continues to lead the global payments space, driven by structural tailwinds including the growth of digital transactions, robust cross-border volumes, and the steady decline in cash usage. The company has consistently delivered strong profitability and cash flows, and despite its premium valuation, these fundamentals support the case for further upside. Recent price action has confirmed its strength relative to the broader market, reinforcing a bullish outlook with a medium-term target of $640.
Bullish Long Call – Mastercard Incorporated (MA) – We entered this position with a straight long call because the implied volatility (IV) rank was very low at 6/100, making spread strategies less favorable compared to buying the call outright. The position is currently close to flat, and with less than 30 days until option expiration, adding a short option to create a bull call vertical spread would reduce overall risk while still allowing for meaningful upside if the stock continues higher. Although this adjustment would limit some gains if Mastercard breaks out sharply, it keeps the trade aligned with the broader bullish thesis.
Adjustment Trade:
MA @ $595.64
Days to Expiration (DTE): 28
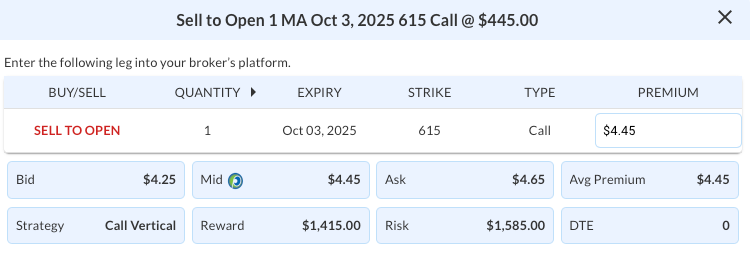
Sell to Open 1 MA Oct 3, 2025 615 Call @ $4.45
Mid: $4.45
Premium Received: $445.00 per call option sold
or $445 total adjustment in the cost basis for the position.
The total risk for the new position is $2,030 (original cost basis) minus $445 (net credit from the adjustment), resulting in a revised cost basis of $1,585.
Resulting Position:
Long 1 MA Oct 3, 2025 585 Call
Short 1 MA Oct 3, 2025 615 Call
New Cost Basis and total risk of $1585
MA – Daily
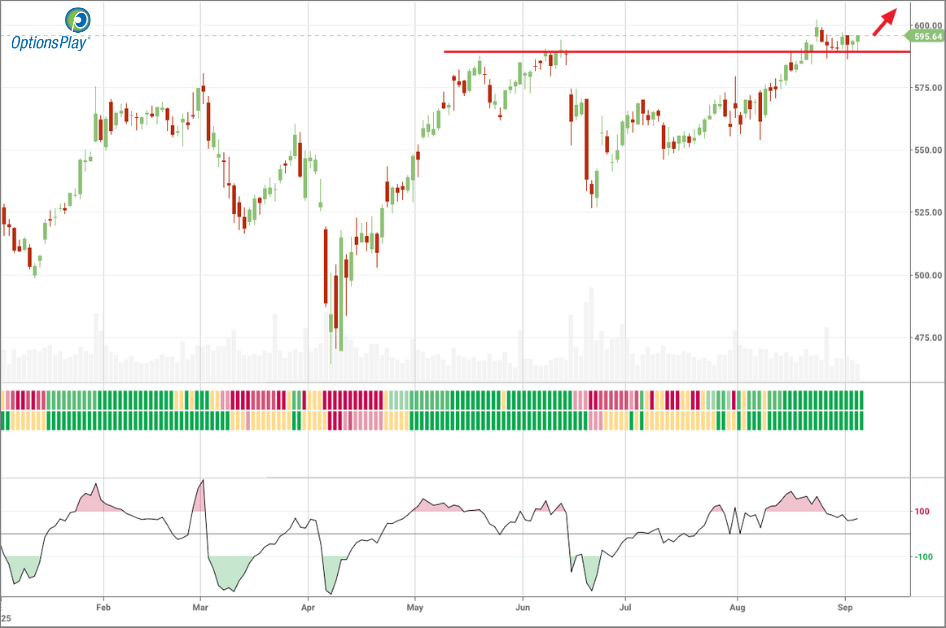
Trade Details
Strategy Details
Strategy: Short Call
Direction: Resulting in a new Bullish Debit Spread
Details: Sell to Open 1 MA Oct 3 $615 Call @ $4.45 Credit.
Total Risk: The resulting position has a maximum risk of $1,585 (2,030-445), calculated as the initial cost basis of the long call ($2,030) minus the premium received from the adjustment ($445).
Trend Continuation Signal: This is a bullish trade on a stock that is expected to continue higher over the duration of the trade.
1M/6M Trends: Bullish/Bullish
Relative Strength: 6/10
Stop Loss: @ $7.93 (50% loss of premium)
Entering the Trade
Use the following details to enter the trade on your trading platform. Please note that whenever there is a multi-leg option strategy, it should be entered as a single trade.
PLEASE NOTE that these prices are based on Thursday’s closing prices. Should the underlying move significantly during the pre-market hours, we will likely adjust the strikes and prices to reflect a more accurate trade entry.
SBUX
DailyPlay – Opening Trade (SBUX) – September 04, 2025
SBUX Bearish Opening Trade Signal
Investment Rationale
Investment Thesis
Starbucks Corporation (SBUX) remains under pressure as both technical and fundamental signals align to suggest limited upside in the near term. The stock has been unable to sustain momentum, with price action rolling over while valuation continues to screen rich against industry peers. Given weaker earnings growth expectations and operational headwinds, a defined-risk bearish options strategy is appropriate to capture potential downside while managing exposure.
Technical Analysis
Price action in SBUX has deteriorated, with shares slipping back below the 20- and 50-day moving averages, and momentum indicators pointing lower. The 200-day moving average around $95 remains a ceiling, and near-term rallies have been capped by declining trend resistance. Notably, inside the options play platform yesterday a “CCI Rally in Bearish Trend” alert was generated, highlighting that while the stock is currently in a bearish trend, it has recently experienced a short-term price rally that may provide an opportunity for a bearish trade setup. With relative strength readings subdued and volume confirming weakness, the technical backdrop supports a defensive view.
Fundamental Analysis
Starbucks is modestly overvalued compared to peers and continues to underperform across key profitability and growth metrics. The combination of slower EPS growth, margin compression, and higher valuation multiples reinforces downside risks:
- Forward PE Ratio: 32.57x vs. Industry Median 26.64x
- Expected EPS Growth: 0% vs. Industry Median 9.18%
- Expected Revenue Growth: 5.55% vs. Industry Median 6.56%
- Net Margins: 7.18% vs. Industry Median 12.49%
Options Trade
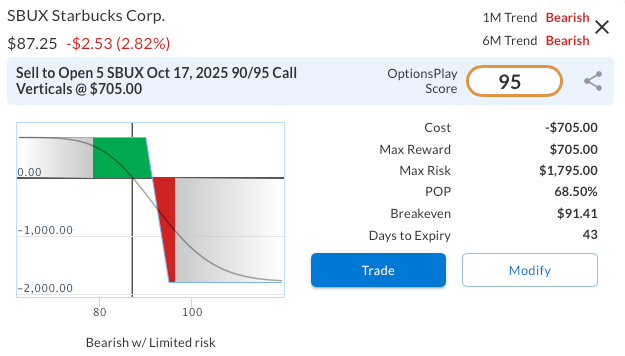
A defined-risk bearish stance can be expressed with the Oct 17, 2025 $90/$95 bear call vertical spread, which brings in a net credit of $1.41. The setup offers a maximum reward of $141 versus a maximum risk of $359, giving a reward-to-risk ratio of about 1:2.5. The trade works best if SBUX stays below $90, where the 20-day moving average has been acting as short-term overhead resistance, while the spread structure caps losses in the event of a breakout.
SBUX – Daily
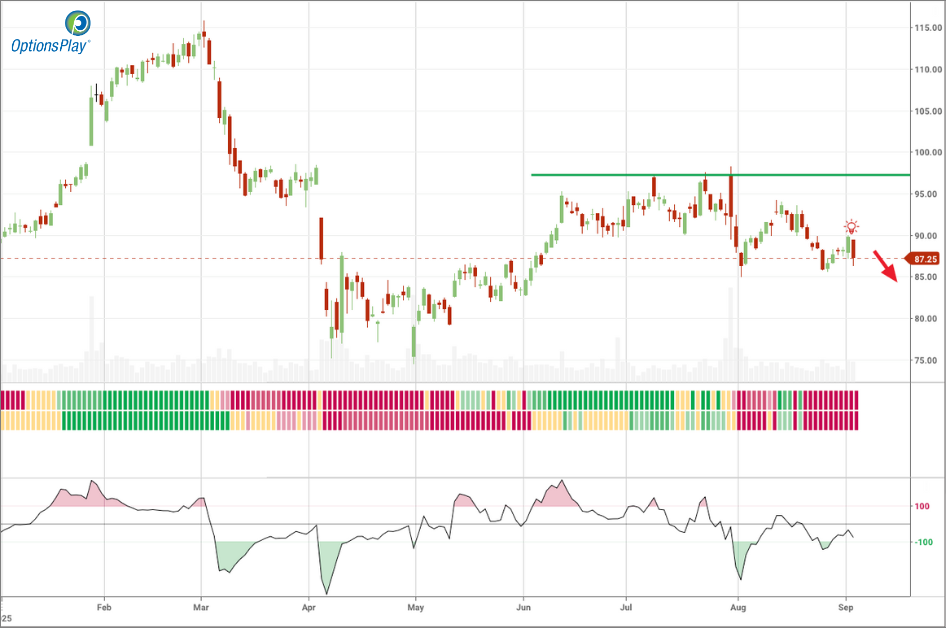
Trade Details
Strategy Details
Strategy: Short Call Vertical Spread
Direction: Bearish Credit Spread
Details: Sell to Open 5 SBUX Oct 17 $90/$95 Call Vertical Spreads @ $1.41 Credit per Contract.
Total Risk: This trade has a max risk of $1,795 (5 Contracts x $359) based on a hypothetical $100k portfolio risking 2%. We suggest risking only 2% of the value of your portfolio and divide it by $359 to select the # contracts for your portfolio.
Trend Continuation Signal: This is a bearish trade on a stock that is expected to continue lower over the duration of this trade.
1M/6M Trends: Bearish/Bearish
Relative Strength: 2/10
OptionsPlay Score: 95
Stop Loss: @ $2.82 (100% loss to value of premium)
View SBUX Trade
Entering the Trade
Use the following details to enter the trade on your trading platform. Please note that whenever there is a multi-leg option strategy, it should be entered as a single trade.
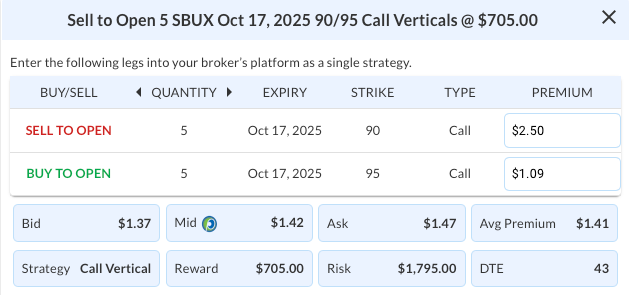
PLEASE NOTE that these prices are based on Wednesday’s closing prices. Should the underlying move significantly during the pre-market hours, we will likely adjust the strikes and prices to reflect a more accurate trade entry.
View SBUX Trade
TFC
DailyPlay – Opening Trade (TFC) – September 03, 2025
TFC Bullish Opening Trade Signal
Investment Rationale
Investment Thesis
Truist Financial Corp. (TFC) is showing renewed momentum as the regional banking sector stabilizes and investors regain confidence in dividend-paying financials. With the stock breaking through key resistance and trading at an attractive valuation relative to peers, the setup points to further near-term upside. The company’s strong capital position, steady dividend yield, and improving growth outlook provide a supportive backdrop for a bullish bias toward the $50 level.
Technical Analysis
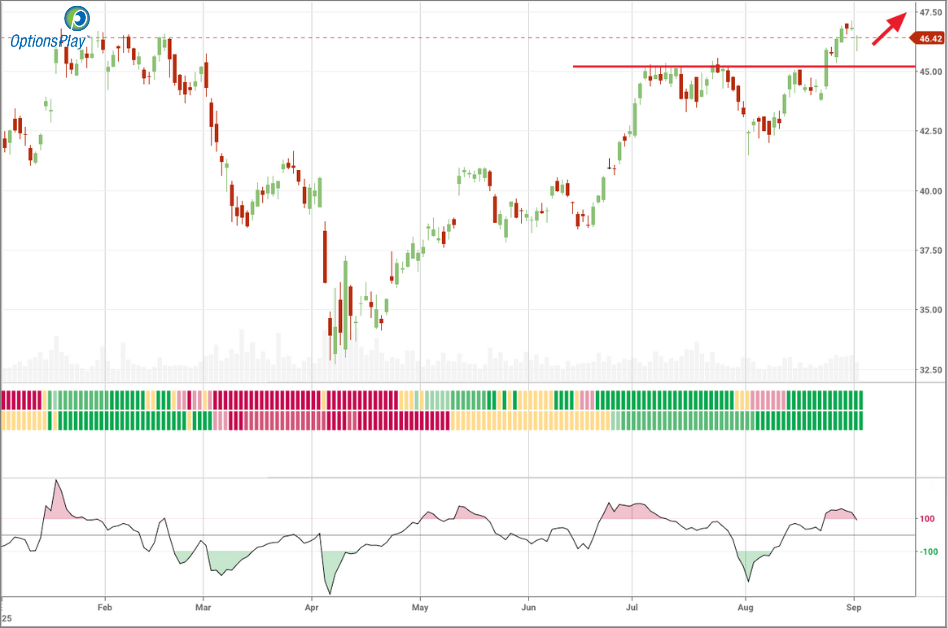
TFC recently cleared the $45 resistance level, confirming a breakout and signaling strength relative to both the S&P 500 and its sector peers. The stock is now trading above its 20-, 50-, and 200-day moving averages, which are trending higher and reinforcing the bullish momentum. Near-term support sits around $44, while the next key resistance is near $50, aligning with the upside target. With RSI in the mid-50s, the stock maintains room to extend gains without appearing overbought, suggesting a constructive risk/reward setup for bullish positioning.
Fundamental Analysis
TFC is modestly undervalued compared to peers while delivering competitive growth expectations and stable margins. The bank’s strong balance sheet and efficient operations enhance its ability to capitalize on sector tailwinds and rising loan growth opportunities. This combination of value and growth drivers supports further stock appreciation.
- PB Ratio: 1.02x vs. Industry Median 1.37x
- Expected EPS Growth: 11.45% vs. Industry Median 11.45%
- Expected Revenue Growth: 17.38% vs. Industry Median 5.73%
- Net Margins: 26.06% vs. Industry Median 26.86%
Options Trade
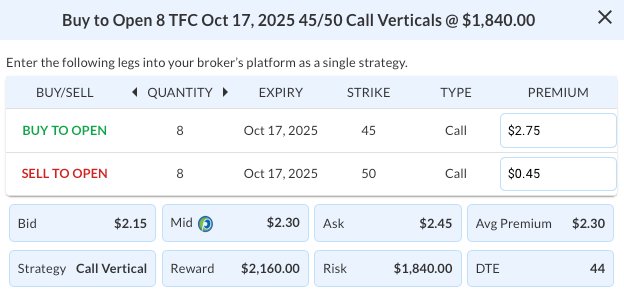
The proposed strategy is a bull call vertical spread in TFC, using the October 17, 2025 expiration. The trade involves buying the 45 strike call and simultaneously selling the 50 strike call for a net debit of $2.30 ($230 per spread). This structure caps risk at the premium paid, while also defining a maximum profit potential of $270 per spread if TFC closes at or above $50 by expiration. The spread offers a favorable risk/reward profile of roughly 1:1.2, providing leveraged upside exposure while mitigating downside losses to the initial outlay. This makes the trade an efficient way to express a moderately bullish view without overcommitting capital.
TFC – Daily
Trade Details
Strategy Details
Strategy: Long Call Vertical Spread
Direction: Bullish Debit Spread
Details: Buy to Open 8 TFC Oct 17 $45/$50 Call Vertical Spreads @ $2.30 Debit per Contract.
Total Risk: This trade has a max risk of $1,840 (8 Contracts x $230) based on a hypothetical $100k portfolio risking 2%. We suggest risking only 2% of the value of your portfolio and divide it by $230 to select the # contracts for your portfolio.
Trend Continuation Signal: This is a bullish trade on a stock that is expected to continue higher over the duration of this trade.
1M/6M Trends: Bullish/Bullish
Relative Strength: 7/10
OptionsPlay Score: 89
Stop Loss: @ $1.15 (50% loss of premium)
View TFC Trade
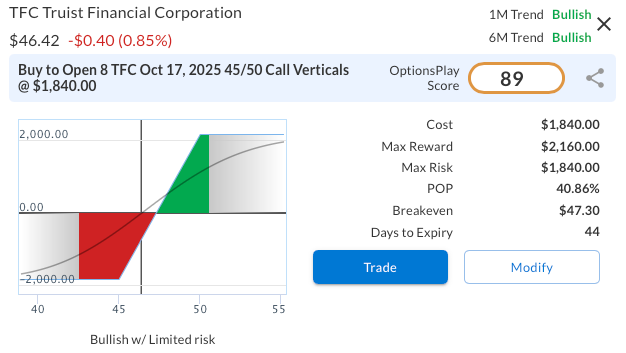
Entering the Trade
Use the following details to enter the trade on your trading platform. Please note that whenever there is a multi-leg option strategy, it should be entered as a single trade.
PLEASE NOTE that these prices are based on Tuesday’s closing prices. Should the underlying move significantly during the pre-market hours, we will likely adjust the strikes and prices to reflect a more accurate trade entry.
View TFC Trade
DailyPlay – Portfolio Review – September 02, 2025
DailyPlay Portfolio Review
Our Trades
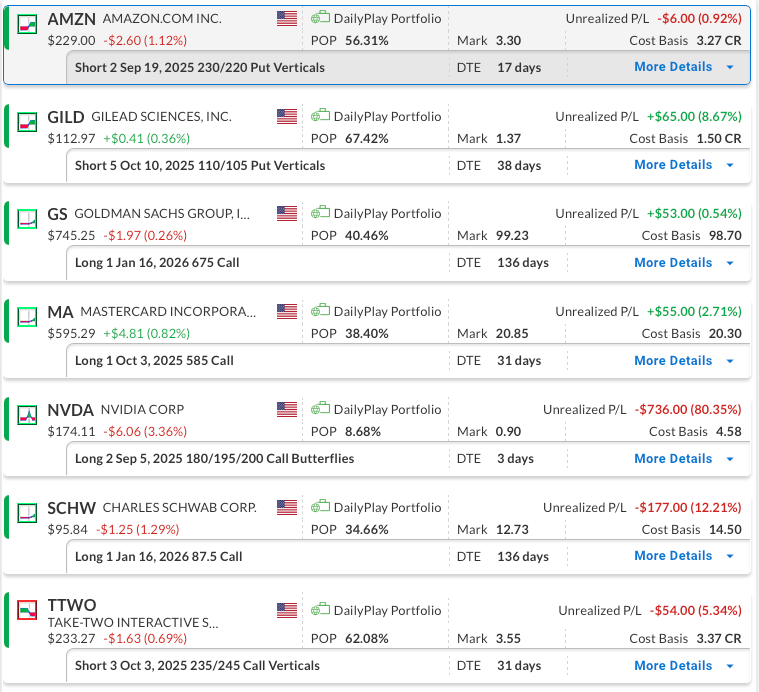
AMZN – 17 DTE
Bullish Credit Spread – Amazon.com, Inc. (AMZN) – The stock showed strength last week, pulled back from the recent high, and if it can break out above 236, the next resistance level is at 241. We plan to stay the course as the trade develops.
GILD – 38 DTE
Bullish Credit Spread – Gilead Sciences (GILD) – We recently established this position and we plan to stay the course for now.
GS – 136 DTE
Bullish Long Call – Goldman Sachs Group, Inc. (GS) – We recently initiated this position and intend to maintain it. Continued strength in the financial sector, driven by Powell’s dovish comments at Jackson Hole, remains supportive for GS.
MA – 31 DTE
Bullish Long Call – Mastercard Incorporated (MA) – We opened this position with a straight long call due to the implied volatility (IV) rank being very low at 6/100, which made spread strategies less attractive compared to buying the call outright. For now, we plan to hold the position.
NVDA – 3 DTE
Bullish Butterfly – NVIDIA Corporation (NVDA) – Following a solid earnings report where NVIDIA (NVDA) exceeded analyst expectations on both revenue and earnings, the company delivered another record quarter, driven largely by its Data Center business. Despite the strong results, the stock traded slightly lower after the announcement and then pulled back further with the broader market on Friday. Given the limited time left in the trade, we intend to exit at a modest loss if early-week price action turns bullish; otherwise, there will be nothing to salvage.
SCHW – 136 DTE
Bullish Long Call – Charles Schwab Corp. (SCHW) – We continue to see upside potential, supported by strong fundamentals and resilience in the financial sector. We closed our initial long call position once the option’s delta hit 1.00, then shifted into a higher strike call with a 0.80 delta and a later expiration. We plan to hold steady with this adjustment.
TTWO – 31 DTE
Bearish Credit Spread – Take-Two Interactive Software, Inc. (TTWO) – We recently established this position and we plan to stay the course for now.
GILD
DailyPlay – Opening Trade (GILD) – August 29, 2025
GILD Bullish Opening Trade Signal
Investment Rationale
Investment Thesis
Gilead Sciences (GILD) presents a constructive setup as the stock consolidates near recent highs with support levels intact. The company benefits from a diverse drug portfolio and consistent cash flows, while investors continue to reward its stable earnings profile and dividend yield. Although the stock trades at a modest premium to peers, Gilead’s stronger growth expectations and profitability metrics continue to support the case for upside. With technicals aligning constructively and fundamentals providing a solid foundation, GILD may be positioned to advance toward the $125 price target in the near term.
Technical Analysis
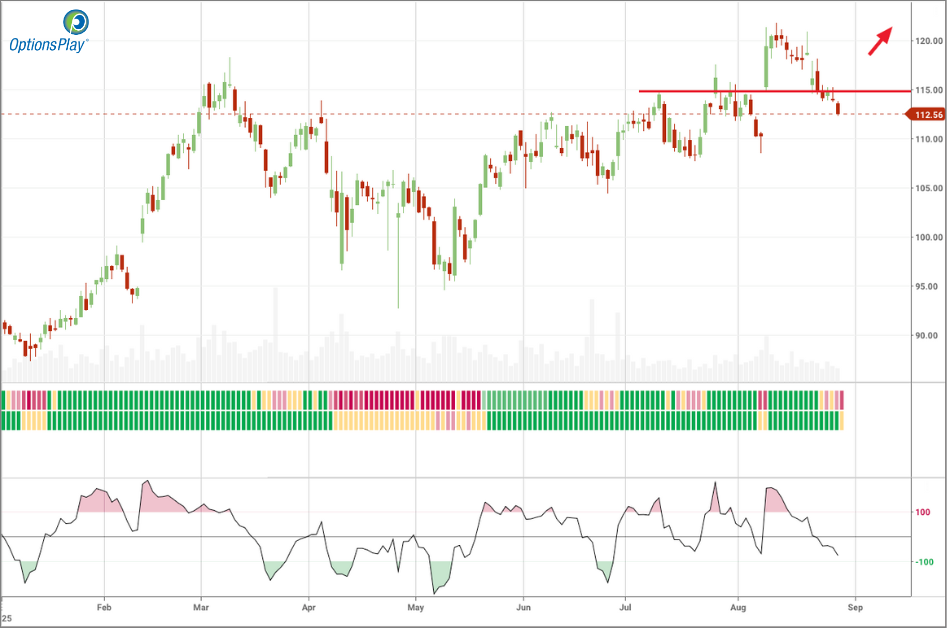
GILD recently broke above the $114 resistance level and has since pulled back to retest it as support, a constructive sign for the ongoing uptrend. The stock is trading above its 50-day moving average and remains comfortably above the 200-day, reinforcing a bullish longer-term structure. With RSI near 60, momentum is healthy without being extended, leaving room for further gains. The bullish thesis remains intact as long as $110 support holds.
Fundamental Analysis
From a fundamental standpoint, Gilead maintains a balanced profile of steady earnings, dividend support, and attractive growth relative to its sector. While its valuation is slightly above the industry median, growth and profitability metrics more than justify the premium. Key data points highlight the strength of its outlook:
- Forward PE Ratio: 14.07x vs. Industry Median 12.29x
- Expected EPS Growth: 24.15% vs. Industry Median 6.46%
- Expected Revenue Growth: 3.25% vs. Industry Median 3.61%
- Net Margins: 21.87% vs. Industry Median 16.08%
Options Trade
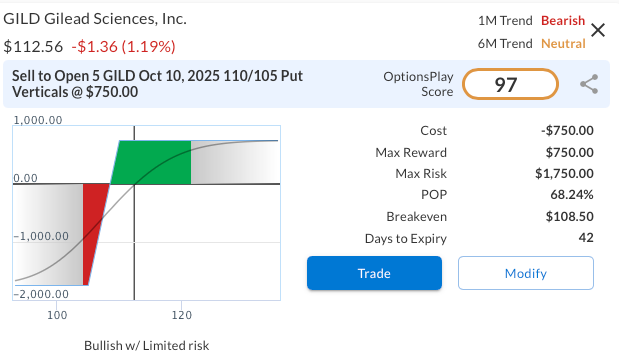
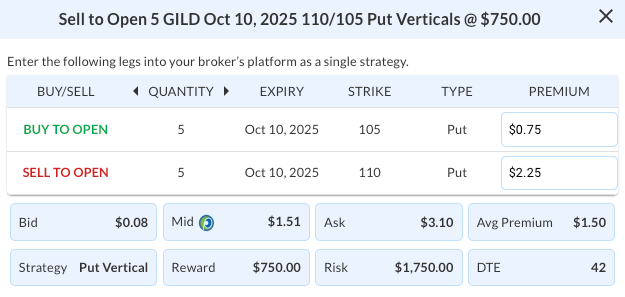
To express a bullish view with defined risk, consider selling the GILD October 10, 2025, $110/$105 put vertical for a $1.50 credit. This trade collects $150 in premium with a maximum risk of $350, resulting in a risk/reward ratio of roughly 2.3:1. The position profits if GILD stays above $110 through expiration, which aligns with the current technical support zone. If the stock finishes above $110 at expiration, the spread expires worthless and the strategy captures the full credit received. This structure provides an efficient way to capture upside while maintaining a favorable margin of safety.
GILD – Daily
Trade Details
Strategy Details
Strategy: Short Put Vertical Spread
Direction: Bullish Credit Spread
Details: Sell to Open 5 GILD Oct 10 $110/$105 Put Vertical Spreads @ $1.50 Credit per Contract.
Total Risk: This trade has a max risk of $1,750 (5 Contracts x $350) based on a hypothetical $100k portfolio risking 2%. We suggest risking only 2% of the value of your portfolio and divide it by $350 to select the # contracts for your portfolio.
Trend Continuation Signal: This is a bullish trade on a stock that is expected to continue higher over the duration of this trade.
1M/6M Trends: Bearish/Neutral
Relative Strength: 3/10
OptionsPlay Score: 97
Stop Loss: @ $3.00 (100% loss to value of premium)
View GILD Trade
Entering the Trade
Use the following details to enter the trade on your trading platform. Please note that whenever there is a multi-leg option strategy, it should be entered as a single trade.
PLEASE NOTE that these prices are based on Thursday’s closing prices. Should the underlying move significantly during the pre-market hours, we will likely adjust the strikes and prices to reflect a more accurate trade entry.