
$SHOP

DailyPlay – Closing Trade (SHOP) – October 9, 2024
Closing Trade
- SHOP – 43.05% gain: Sell to Close 7 Contracts (or 100% of your Contracts) Oct 18/Nov 15 $85 Call Calendars @ $4.22 Credit. DailyPlay Portfolio: By Closing all 7 Contracts, we will receive $2,954. We initially opened these 7 Contracts on September 23 @ $2.95 Debit. Our gain on this trade is therefore $889 which is almost 1% gain on our Portfolio.
$AAPL

DailyPlay – Closing Trades (AAPL, ALL) Rolling Trade (AAPL) – October 8, 2024
Closing Trades
- AAPL – 53.57% gain: Buy to Close 5 Contracts (or 100% of your Contracts) October 25st $235/$240 Call Vertical Spreads @ $0.43 Debit. DailyPlay Portfolio: By Closing all 5 Contracts, we will pay $215. We initially opened these 5 Contracts on October 3 @ $0.93 Credit. Our gain on this trade is therefore $250.
- ALL – 100% loss: Buy to Close 5 Contracts (or 100% of your Contracts) October 18st $185/$180 Put Vertical Spreads @ $2.50 Debit. DailyPlay Portfolio: By Closing all 5 Contracts, we will pay $1,250. We initially opened these 5 Contracts on September 26 @ $1.09 Credit. This trade, therefore, had a loss of $141 Debit per Contract.
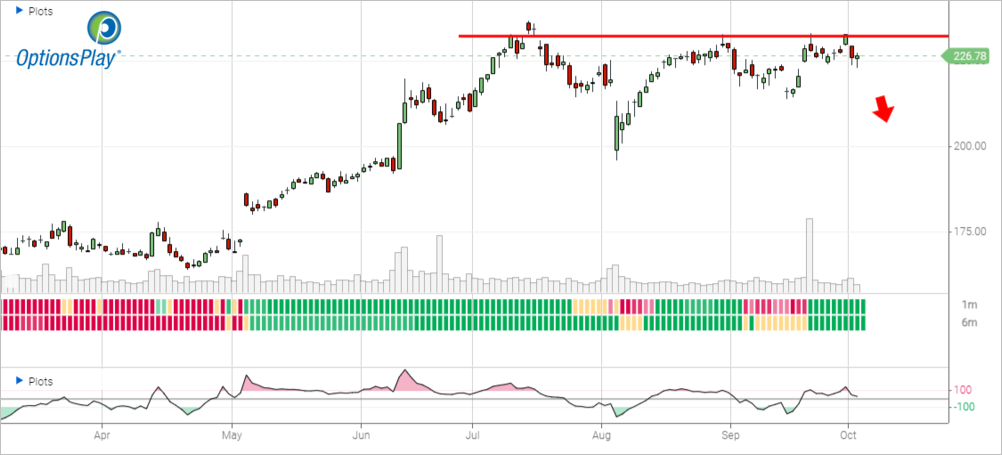
AAPL Bearish Opening Trade Signal/ Rolling Trade
Investment Rationale
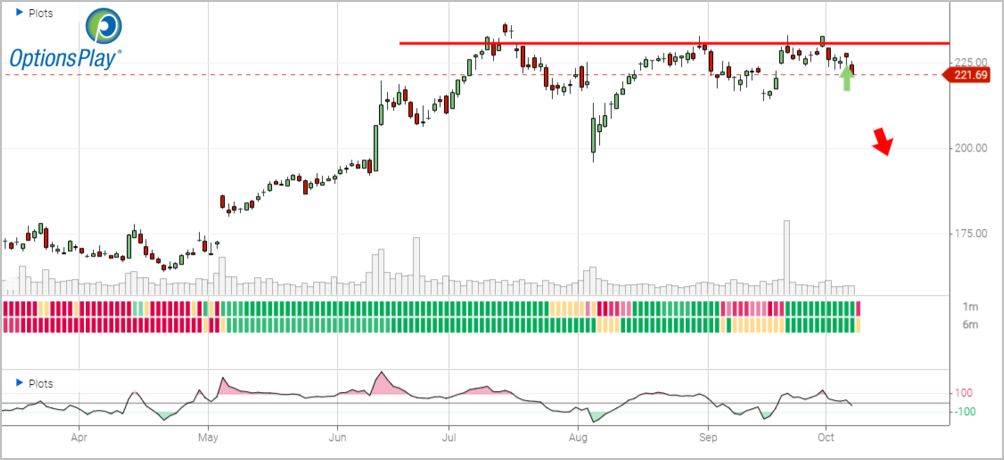
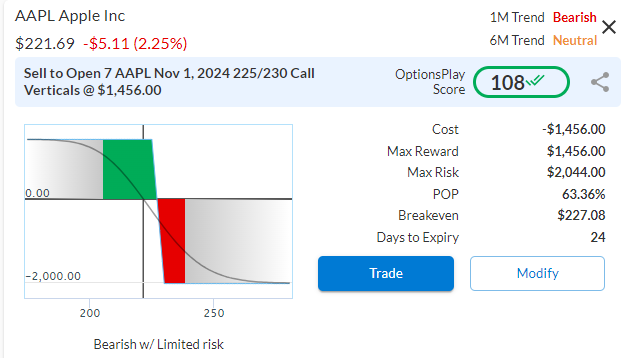
As AAPL is rejected at its $230 resistance level, we are looking for a continuation lower and we are looking to lock in some profits and roll it out and down to the Nov 1 $225/$230 Call Vertical to collect another $2.08 in Credit.
With another hurricane barreling down the Gulf coast of Florida, insurance stocks such as ALL are getting hammered and we need to close out this trade to prevent further losses.
We are Rolling AAPL by closing the one trade and opening a new trade with an expiry date a little further out.
AAPL – Daily
Trade Details
Strategy Details
Strategy: Short Call Vertical Spread
Direction: Bearish Credit Spread
Details: Sell to Open 7 AAPL November 1 $225/$230 Call Vertical Spreads @ $2.08 Credit per Contract.
Total Risk: This trade has a max risk of $2,044 (7 Contracts x $292) based on a hypothetical $100,000 portfolio risking 2%. We suggest using 2% of your portfolio value and divide it by $292 to select the # contracts for your portfolio.
Trend Continuation Signal: This is a bearish trade on a stock that failed to break above resistance and is likely to pullback to lower levels.
1M/6M Trends: Bearish/Neutral
Relative Strength: 9/10
OptionsPlay Score: 108
Stop Loss: @ $4.16 (100% loss to the value of premium)
View AAPL Trade
Entering the Trade
Use the following details to enter the trade on your trading platform. Please note that whenever there is a multi-leg option strategy, it should be entered as a single trade.
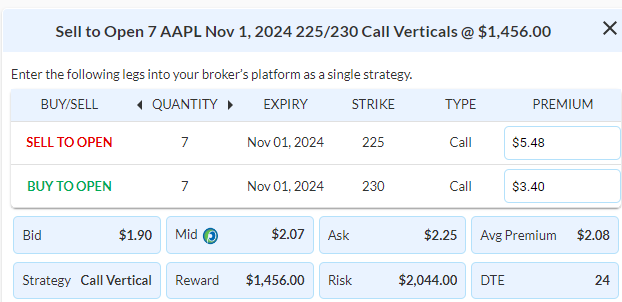
PLEASE NOTE that these prices are based on Monday’s closing prices. Should the underlying move significantly during the pre-market hours, we will likely adjust the strikes and prices to reflect a more accurate trade entry.
View AAPL Trade
$RACE
DailyPlay – Opening Trade (RACE) – October 7, 2024
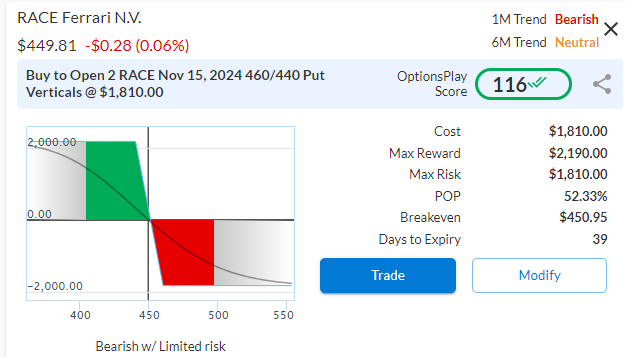
RACE Bearish Opening Trade Signal
Investment Rationale
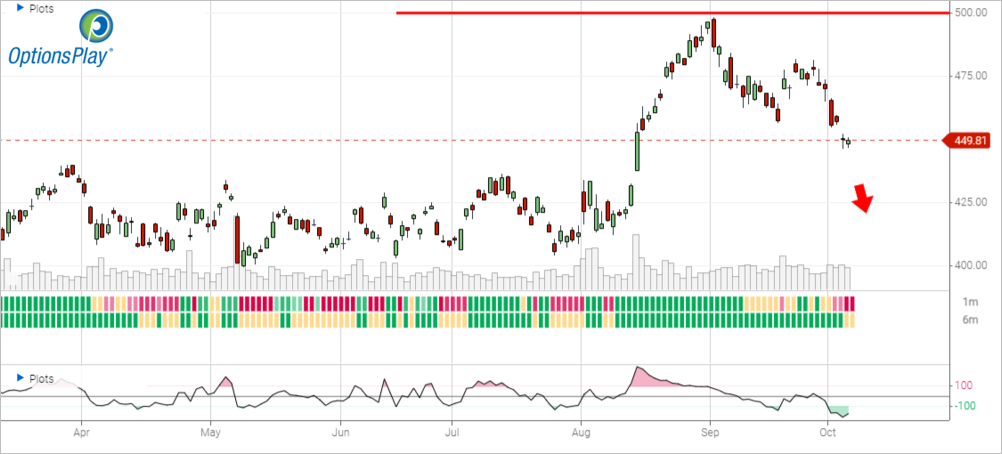
RACE recently broke down above its trading range with strong momentum an underperforming the S&P 500, providing an opportunity for further downside to our $400 target. With industry leading growth rates and profitability metrics, RACE warrants a premium valuation relative to its peers, but at more than 4x the industry average, RACE has significant downside risks to its valuation.
RACE – Daily
Trade Details
Strategy Details
Strategy: Long Put Vertical Spread
Direction: Bearish Debit Spread
Details: Buy to Open 2 RACE November 15 $460/$440 Put Vertical Spreads @ $9.05 Debit per Contract.
Total Risk: This trade has a max risk of $1,810 (2 Contracts x $905) based on a hypothetical $100,000 portfolio risking 2%. We suggest using 2% of your portfolio value and divide it by $905 to select the # contracts for your portfolio.
Trend Continuation Signal: This is a bearish trade on a stock that is trading lower from a previous high.
1M/6M Trends: Bearish/Neutral
Relative Strength: 4/10
OptionsPlay Score: 116
Stop Loss: @ $4.53 (50% loss of premium)
View RACE Trade
Entering the Trade
Use the following details to enter the trade on your trading platform. Please note that whenever there is a multi-leg option strategy, it should be entered as a single trade.
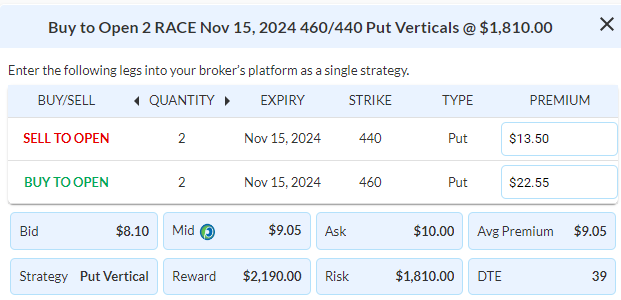
PLEASE NOTE that these prices are based on Friday’s closing prices. Should the underlying move significantly during the pre-market hours, we will likely adjust the strikes and prices to reflect a more accurate trade entry.
View RACE Trade
$XOM
DailyPlay – Closing Trades & Portfolio Review – October 4, 2024
Closing Trades
- XOM – 71% loss: Buy to Close 6 Contracts (or 100% of your Contracts) Nov 1st $120/$125 Call Vertical Spreads @ $2.65 Debit. DailyPlay Portfolio: By Closing all 6 Contracts, we will pay $1,584. We initially opened these 6 Contracts on September 24 @ $1.54 Credit. This trade had a loss of $1.11 Debit per Contract.
- XOM – 65% gain: Sell to Close 6 Contracts (or 100% of your Contracts) Nov 1st $125 Calls @ $2.66 Credit. DailyPlay Portfolio: By Closing all 6 Contracts, we will receive $1,596. We initially opened these 6 Contracts on October 2 @ $1.61 Debit. This trade generated $1.05 Credit per Contract. The combination of both XOM trades had a minimal loss of $0.06 Debit per Contract.
DailyPlay Portfolio Review
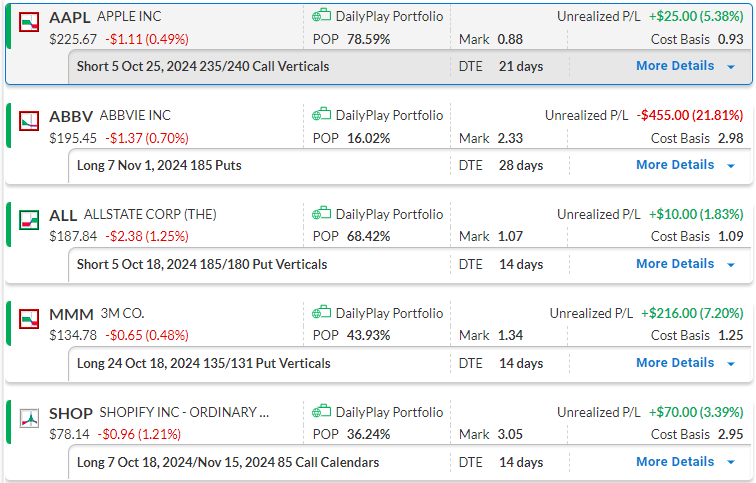
Our Trades
AAPL – 21 DTE
Bearish Credit Spread – Holding below key $230 resistance level, we’re looking for a continuation lower towards its $215 support level.
ABBV – 28 DTE
Bearish Puts – If ABBV breaks above the $200 resistance, it would warrants closing this position. For now we are closely monitoring this trade.
ALL – 14 DTE
Bullish Credit Spread – ALL is trading rangebound above support at $185. We will keep a close eye on this trade to see if support holds.
MMM – 14 DTE
Bearish Debit Spread – We’re looking for MMM to hold below $135 to reach our $122 downside target.
SHOP – 14 DTE
Bullish Calendar Spread – SHOP remains bullish as support at $76 is holding up, and we’re looking for a breakout towards the $85 target.
$AAPL
DailyPlay – Opening Trade (AAPL) – October 3, 2024
AAPL Bearish Opening Trade Signal
Investment Rationale
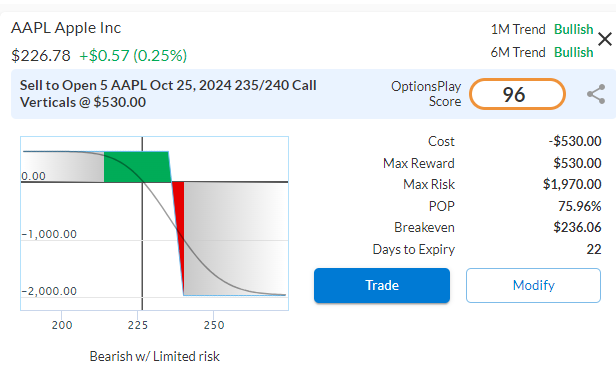
Apple Inc. (AAPL) has been rangebound between $215 and $232.50, recently rejecting the upper limit, suggesting it may revisit $215 before a breakout. Fundamentally, AAPL appears modestly overvalued, trading at a premium to peers despite only slightly higher growth, with its industry-leading margins not enough to justify the high valuation.
AAPL – Daily
Trade Details
Strategy Details
Strategy: Short Call Vertical Spread
Direction: Bearish Credit Spread
Details: Sell to Open 5 AAPL October 25 $235/$240 Call Vertical Spreads @ $1.06 Credit per Contract.
Total Risk: This trade has a max risk of $1,970 (5 Contracts x $394) based on a hypothetical $100,000 portfolio risking 2%. We suggest using 2% of your portfolio value and divide it by $394 to select the # contracts for your portfolio.
Counter Trend Signal: This is a bearish trade on a stock that is trading rangebound and not expected to continue higher.
1M/6M Trends: Bullish/Bullish
Relative Strength: 10/10
OptionsPlay Score: 96
Stop Loss: @ $2.12 (100% loss to value of premium)
View AAPL Trade
Entering the Trade
Use the following details to enter the trade on your trading platform. Please note that whenever there is a multi-leg option strategy, it should be entered as a single trade.
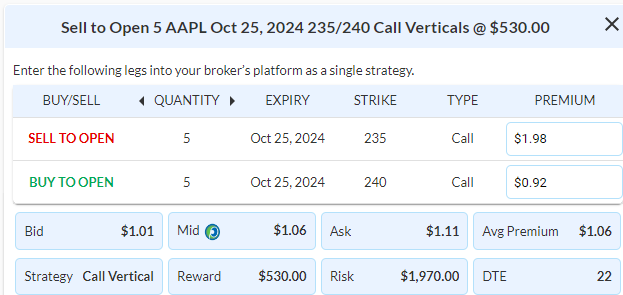
PLEASE NOTE that these prices are based on Wednesday’s closing prices. Should the underlying move significantly during the pre-market hours, we will likely adjust the strikes and prices to reflect a more accurate trade entry.
View AAPL Trade
$XOM

DailyPlay – Opening Trade (XOM) – October 2, 2024
XOM Bullish Opening Trade Signal/ Trade Adjustment
Investment Rationale
Buy an extra November 1 $125 Call. I would prefer to pay $1.54 for the extra call, which is the net credit received from the initial credit spread. This makes the debit for the long call equal to the net credit received from the initial trade, putting us at even as far as debits and credits are concerned.
I like to call this strategy, “I don’t want the cheese anymore; just get me out of the trap.” If we break significantly above $120, the trade could become profitable – the sooner, the better for that breakout to the upside. If the stock pulls back and declines, we’ll likely let everything expire worthless, and in that case, we would break even on the entire position.
If you let too much time pass and the stock drifts up, that’s a bad outcome. We still have a short spread from $120 to $125 at expiration, and if we ride it all the way to expiration and the stock stops at $125, the extra long call does not help.
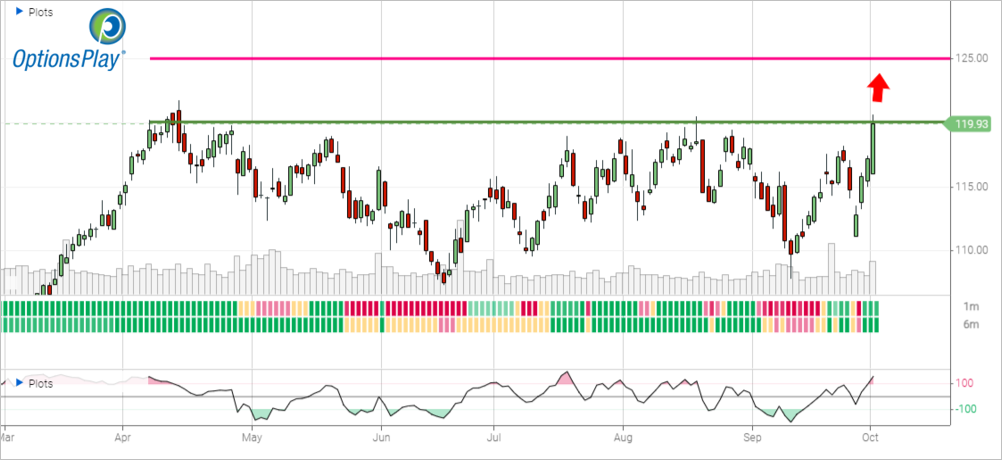
XOM – Daily
Trade Details
Strategy Details
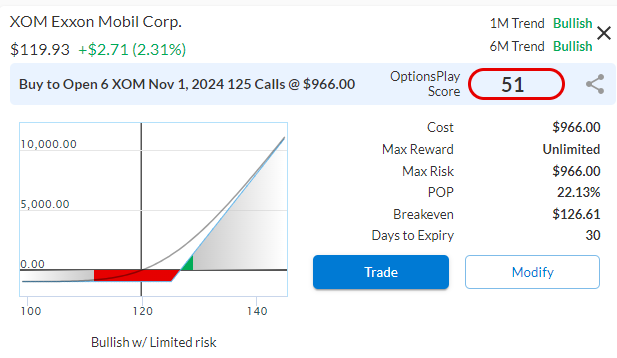
Strategy: Long Call
Direction: Bullish Call
Details: Buy to Open 6 XOM November 1 $125 Calls @ $1.61 Debit per Contract.
Total Risk: This trade has a max risk of $966 (6 Contracts x $161) based on a hypothetical $100,000 portfolio risking 2%. We suggest using 2% of your portfolio value and divide it by $161 to select the # contracts for your portfolio.
Trend Continuation Signal: This is a bullish trade on a stock that is in a bullish trend.
1M/6M Trends: Bullish/Bullish
Relative Strength: 4/10
OptionsPlay Score: 51
Stop Loss: @ $0.81 (50% loss of premium)
View XOM Trade
Entering the Trade
Use the following details to enter the trade on your trading platform. Please note that whenever there is a multi-leg option strategy, it should be entered as a single trade.
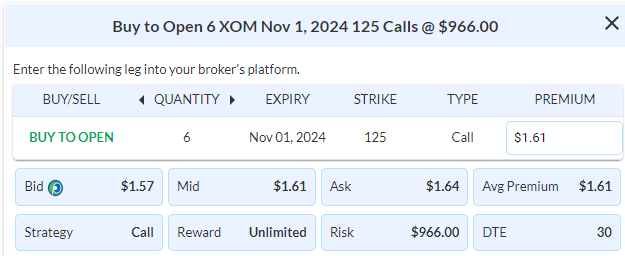
PLEASE NOTE that these prices are based on Tuesday’s closing prices. Should the underlying move significantly during the pre-market hours, we will likely adjust the strikes and prices to reflect a more accurate trade entry.
View XOM Trade
$MMM
DailyPlay – Opening Trade (MMM) – October 1, 2024
MMM Bearish Opening Trade Signal
Investment Rationale
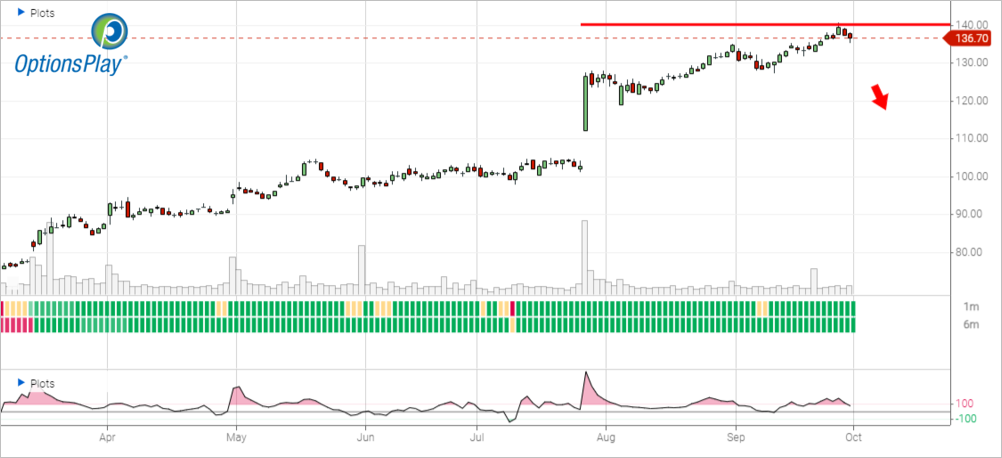
3M Company (MMM) has recently entered overbought territory on both daily and weekly timeframes, indicating signs of exhaustion and suggesting an increased likelihood of a selloff. While MMM is expected to grow EPS faster than its industry peers, negative revenue growth and slim margins pose significant downside risks, making it challenging for the company to meet these projections.
MMM – Daily
Trade Details
Strategy Details
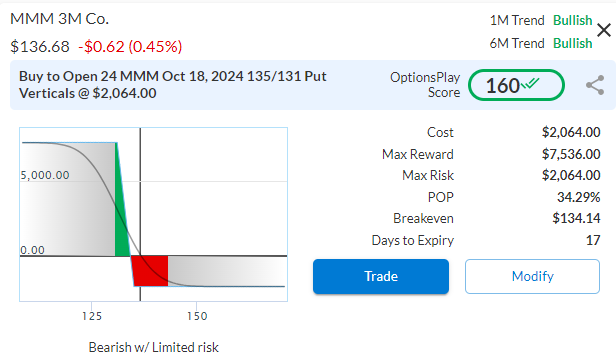
Strategy: Long Put Vertical Spread
Direction: Bearish Debit Spread
Details: Buy to Open 24 MMM October 18 $135/$131 Put Vertical Spreads @ $0.86 Debit per Contract.
Total Risk: This trade has a max risk of $2,064 (24 Contracts x $86) based on a hypothetical $100,000 portfolio risking 2%. We suggest using 2% of your portfolio value and divide it by $86 to select the # contracts for your portfolio.
Counter Trend Signal: This is a bearish trade on a stock that formed a bearish divergence and is expected to continue lower.
1M/6M Trends: Bullish/Bullish
Relative Strength: 10/10
OptionsPlay Score: 160
Stop Loss: @ $0.43 (50% loss of premium)
View MMM Trade
Entering the Trade
Use the following details to enter the trade on your trading platform. Please note that whenever there is a multi-leg option strategy, it should be entered as a single trade.
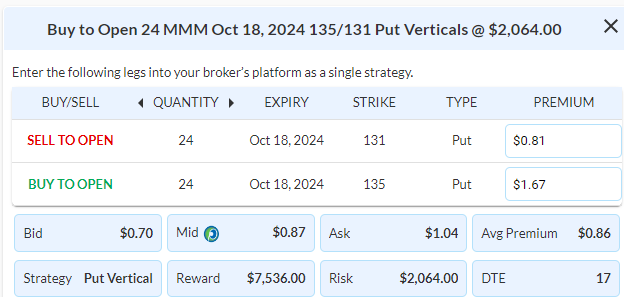
PLEASE NOTE that these prices are based on Monday’s closing prices. Should the underlying move significantly during the pre-market hours, we will likely adjust the strikes and prices to reflect a more accurate trade entry.
View MMM Trade

DailyPlay – Portfolio Review – September 30, 2024
DailyPlay Portfolio Review
Our Trades
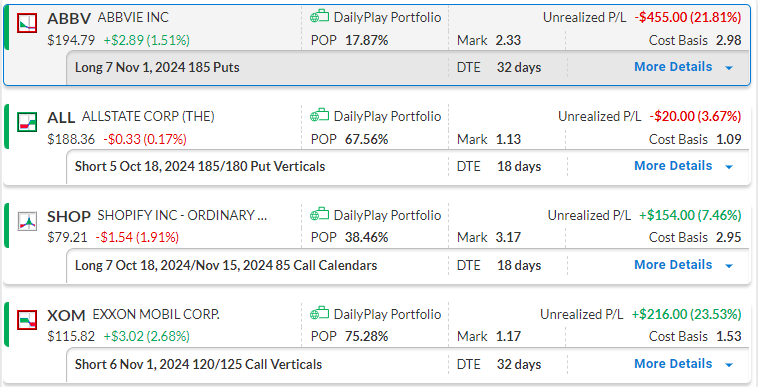
ABBV – 32 DTE
Bearish Puts – Our immediate downside target for ABBV is $182, but if we breakout above $200 we would cut losses and move on. So far it is still holding below its $195 support and maintains its downside potential as it continues to underperform relative to the market.
ALL – 18 DTE
Bullish Credit Spread – Allstate Corp. (ALL) remains in a moderately bullish trend, supported by strong fundamentals, so we’re staying the course with our position.
SHOP – 18 DTE
Bullish Calendar Spreads – Shopify (SHOP) remains bullish after its recent breakout, with expectations of continued upward momentum. With earnings set for early November, we’ve factored this into our option strategy and are staying the course.
XOM- 32 DTE
Bearish Credit Spread – Exxon Mobil Corp. (XOM) remains below the $117 resistance level and continues to drift lower, so we’re staying the course with our position.
DHI- 5 DTE
Bullish Calls and Combo – If you have not closed both positions yet, please do so today.
$ABBV
DailyPlay – Opening Trade (ABBV) Closing Trades (CLX, PYPL) – September 27, 2024
Closing Trades
- CLX – 28.79% gain: Sell to Close 7 Contracts (or 100% of your Contracts) Oct 18th $165 Puts @ $4.25 Credit. DailyPlay Portfolio: By Closing all 7 Contracts, we will receive $2,975. We initially opened these 7 Contracts on September 17 @ $3.30 Debit. Our gain, therefore, is $665.
- PYPL – 102.22% gain: Sell to Close 19 Contracts (or 100% of your Contracts) Oct 18th $70/$75 Call Vertical Spreads @ $4.55 Credit. DailyPlay Portfolio: By Closing all 19 Contracts, we will receive $8,645. We initially opened 11 Contracts on August 20 @ $1.99 Debit and then another 8
Contracts on September 3 @ $2.61 Debit. Our gain, therefore, is $4,370 which is over 4% gain on our total Portfolio.
ABBV Bearish Opening Trade Signal
Investment Rationale
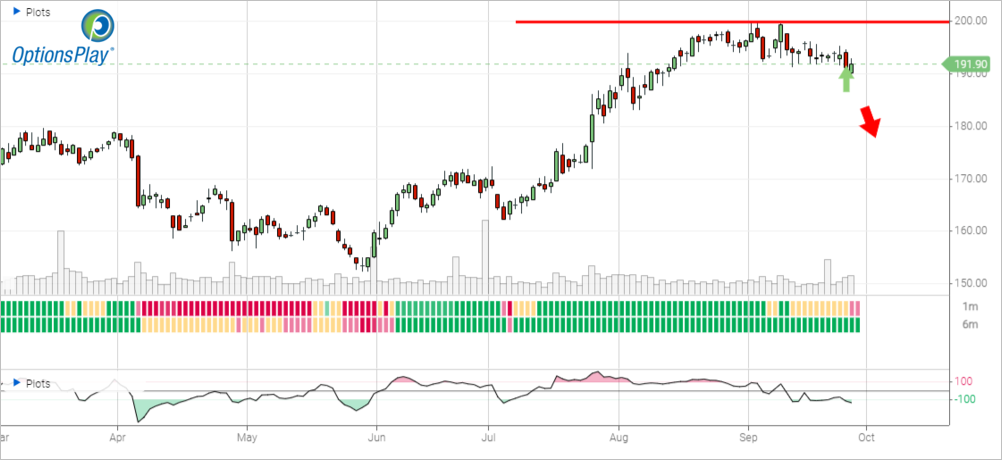
AbbVie Inc.(ABBV) recently broke below its trading range with strong momentum, underperforming the S&P 500. This breakdown suggests potential for further downside, with a target price of $183.
Although projected growth is in line with industry averages and net margins are comparable, ABBV trades at a 20% premium relative to its peers, presenting a significant downside risk.
ABBV – Daily
Trade Details
Strategy Details
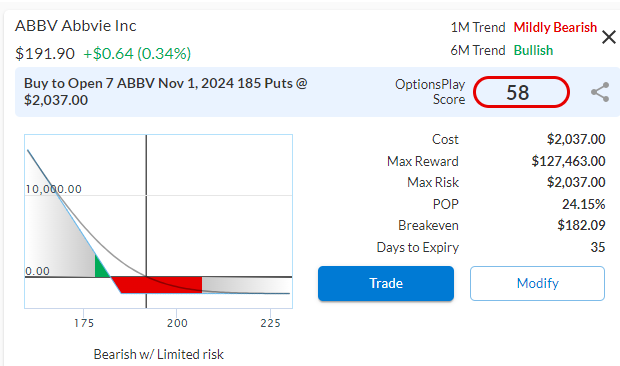
Strategy: Long Put
Direction: Bearish Put
Details: Buy to Open 7 ABBV November 1 $185 Puts @ $291 Debit per Contract.
Total Risk: This trade has a max risk of $2,037 (7 Contracts x $291) based on a hypothetical $100,000 portfolio risking 2%. We suggest using 2% of your portfolio value and divide it by $291 to select the # contracts for your portfolio.
Trend Continuation Signal: This is a bearish trade on a stock that recently broke below its trading range and is expected to continue lower.
1M/6M Trends: Mildly Bearish/Bullish
Relative Strength: 5/10
OptionsPlay Score: 58
Stop Loss: @ $146 (50% loss of premium)
View ABBV Trade
Entering the Trade
Use the following details to enter the trade on your trading platform. Please note that whenever there is a multi-leg option strategy, it should be entered as a single trade.
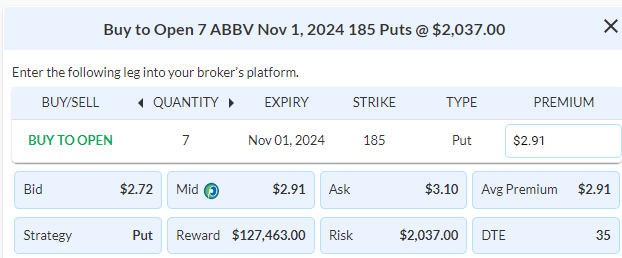
PLEASE NOTE that these prices are based on Thursday’s closing prices. Should the underlying move significantly during the pre-market hours, we will likely adjust the strikes and prices to reflect a more accurate trade entry.
View ABBV Trade
$ALL
DailyPlay – Opening Trade (ALL) – September 26, 2024
ALL Bullish Opening Trade Signal
Investment Rationale
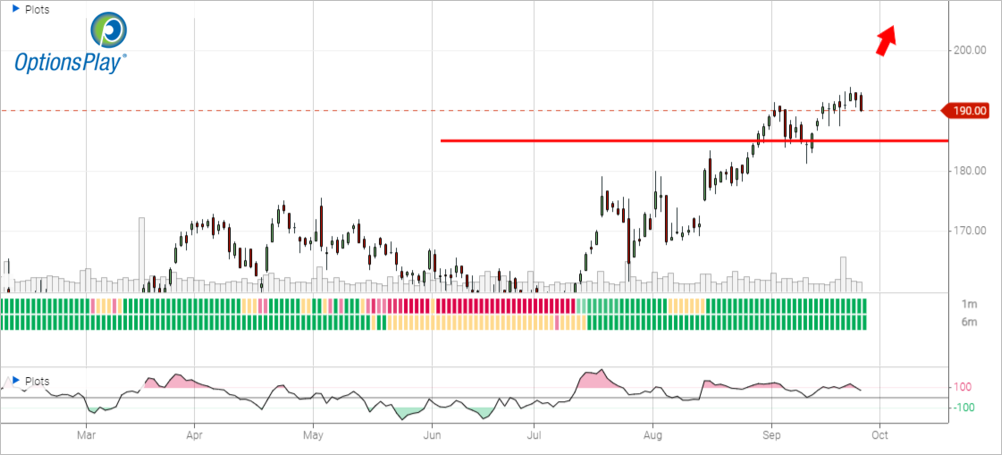
Allstate Corp. (ALL) is undervalued, with strong fundamentals, including a 12.00% annual sales growth rate and a projected earnings growth rate of 19.00%. Its low P/E ratio of 12.06 and a dividend yield of 1.94%, along with a strong dividend growth rate of 14.00%, further enhance its attractive valuation.
ALL remains in a strong bullish trend with its recent pullback to its $190 support level provides an attractive risk to reward for seeking long exposure.
ALL – Daily
Trade Details
Strategy Details
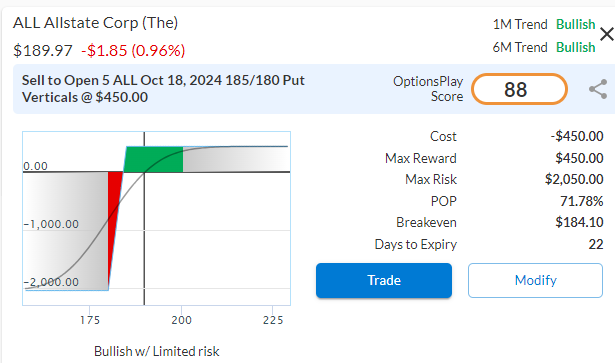
Strategy: Short Put Vertical Spread
Direction: Bullish Credit Spread
Details: Sell to Open 5 ALL October 18 $185/$180 Put Vertical Spreads @ $90.00 Credit per Contract.
Total Risk: This trade has a max risk of $2,050 (5 Contracts x $410) based on a hypothetical $100,000 portfolio risking 2%. We suggest using 2% of your portfolio value and divide it by $410 to select the # contracts for your portfolio.
Trend Continuation Signal: This is a bullish trade on a stock that is currently in a strong bullish trend and with fundamental views aligned to the upside.
1M/6M Trends: Bullish/Bullish
Relative Strength: 8/10
OptionsPlay Score: 88
Stop Loss: @ $180 (100% loss to the value of premium)
View ALL Trade
Entering the Trade
Use the following details to enter the trade on your trading platform. Please note that whenever there is a multi-leg option strategy, it should be entered as a single trade.
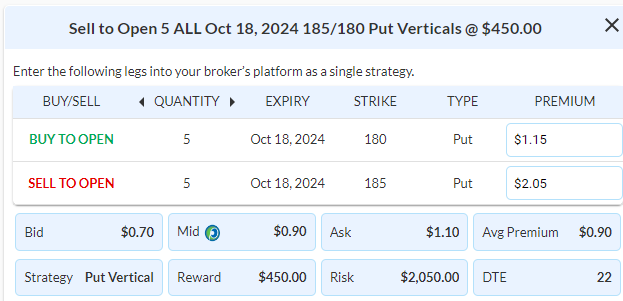
PLEASE NOTE that these prices are based on Wednesday’s closing prices. Should the underlying move significantly during the pre-market hours, we will likely adjust the strikes and prices to reflect a more accurate trade entry.