
$OIH

DailyPlay – Opening Trade (OIH) – July 30, 2024
OIH Bullish Opening Trade Signal
Investment Rationale
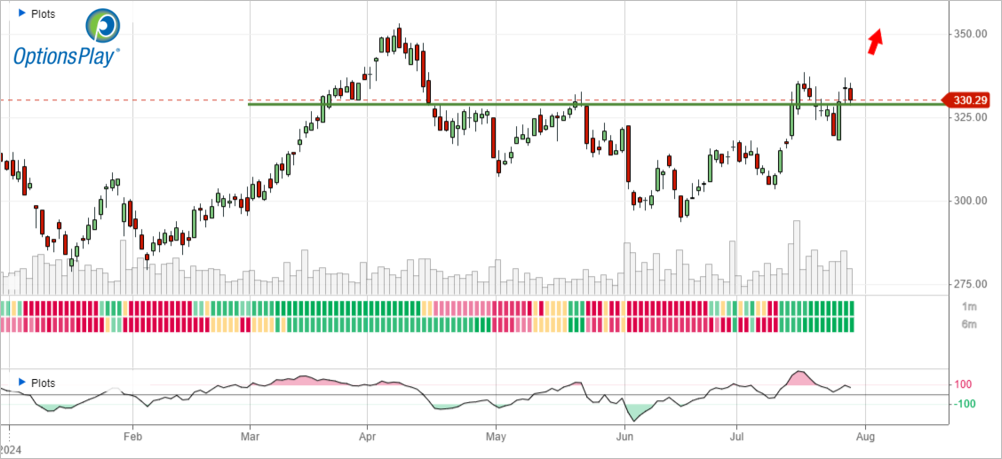
As crude prices drop to a major support level around $75, reaches oversold conditions and geopolitical risks rise, a potential opportunity arises in energy stocks. One way to seek bullish exposure is using the Oil Services ETF (OIH). With SLB, BKR and HAL accounting for nearly 40% of the ETF. We currently see strength in these energy names, especially if oil bounces from these levels. OIH recently broke out above its $330 resistance level which now acts as support. I’m using options to seek a neutral to bullish exposure by selling the Sept 6 $330/$312.5 Put Vertical @ $7.00 Credit.
OIH – Daily
Trade Details
Strategy Details
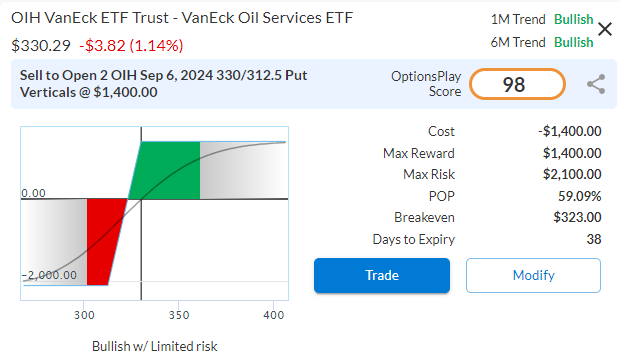
Strategy: Short Put Vertical Spread
Direction: Bullish Credit Spread
Details: Sell to Open 2 OIH Sept 6th $330/$312.50 Put Vertical Spreads @ $7.00 Credit per Contract.
Total Risk: This trade has a max risk of $2,100 (2 Contract x $1,050) based on a hypothetical $100,000 portfolio risking 2%. We suggest using 2% of your portfolio value and divide it by $1,050 to select the # contracts for your portfolio.
Trend Continuation Signal: This is a bullish trade on an ETF that is in a bullish trend, and expected to continue higher.
1M/6M Trends: Bullish/Bullish
Relative Strength: 7/10
OptionsPlay Score: 99
Stop Loss: @ $14.00 Debit. (100% loss to the value of premium)
View OIH Trade
Entering the Trade
Use the following details to enter the trade on your trading platform. Please note that whenever there is a multi-leg option strategy, it should be entered as a single trade.
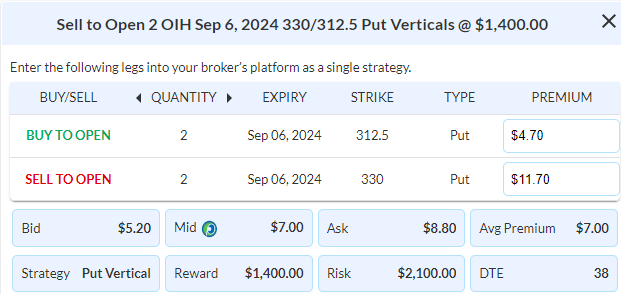
PLEASE NOTE that these prices are based on Monday’s closing prices. Should the underlying move significantly during the pre-market hours, we will likely adjust the strikes and prices to reflect a more accurate trade entry.
View OIH Trade

DailyPlay – Portfolio Review – July 29, 2024
DailyPlay Portfolio Review
Investment Rationale
As we head into the big week of earnings and a Fed announcement, investors are asking if the strength that we saw into the close of last week will continue, or if selling start to take over again. Our view is that markets will likely stabilize, however earnings would be the wildcard that could send stocks lower, just like GOOGL and TSLA did last week. We’re looking to close out MS, PYPL and potentially AZN this week to remove some long exposure going into earnings week and Fed decision.
Our Trades
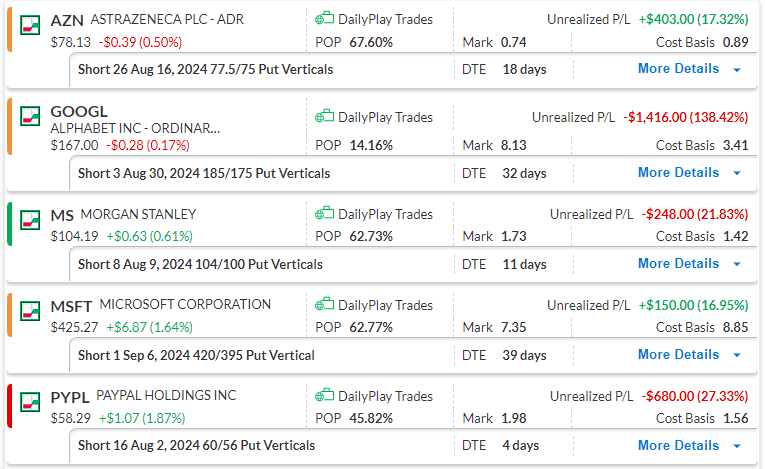
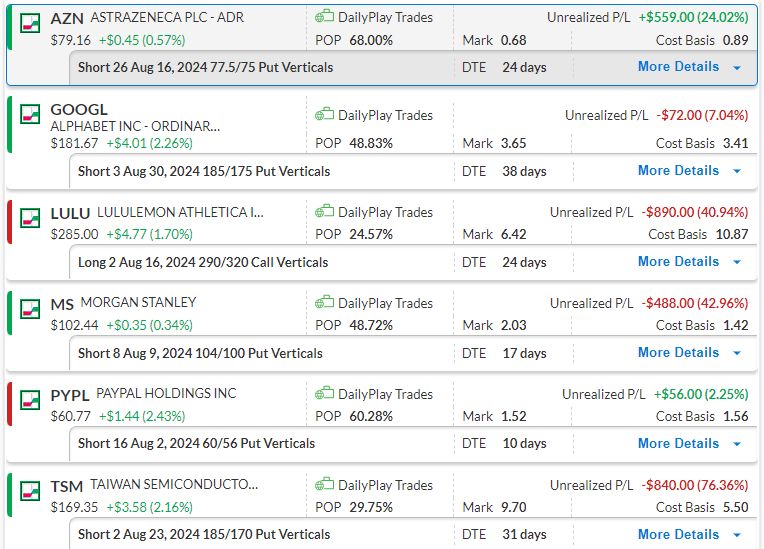
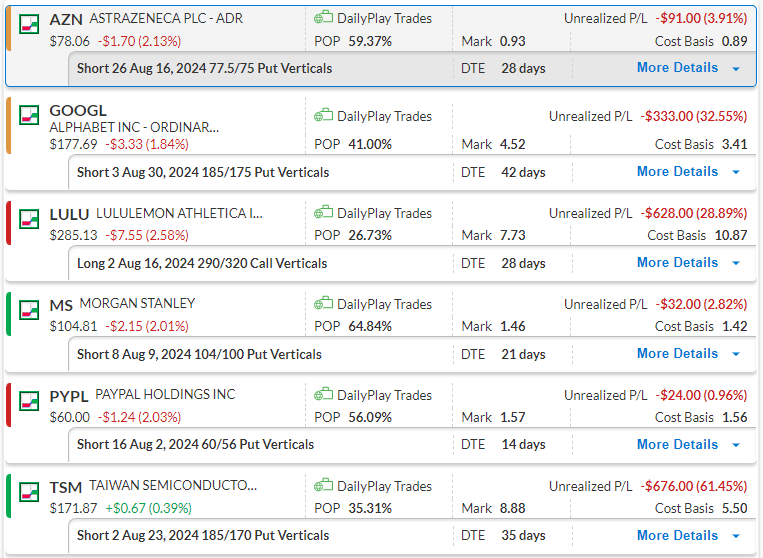
AZN – 18 DTE
Bullish Credit Spread – Support at $76 still holds with a break above $80 as the next upside target.
GOOGL – 32 DTE
Bullish Credit Spread – Following further downside last week, GOOGL found support at $167 which is expected to be confirmed by price action over the next few days.
MS – 11 DTE
Bullish Credit Spread – Trading above $104 our short strike, look to close this trade this week.
MSFT – 39 DTE
Bullish Credit Spread – Support at $420 is holding, as expected, with the next upside target at $445.
PYPL – 4 DTE
Bullish Credit Spread – We will look to close out PYPL in the next couple of trading sessions as it just trades above our breakeven price.
$MSFT
DailyPlay – Opening Trade (MSFT) – July 26, 2024
MSFT Bullish Opening Trade Signal
Investment Rationale
Heading into earnings next week, Microsoft is positioned to continue capitalizing on the growing demand for AI and cloud computing services, underscored by the cloud revenue growth reported by Alphabet this week. The company’s leading position in AI and cloud computing makes it a compelling trade for next week. The recent pullback to a major support level and recent outperformance provides an attractive risk/reward opportunity to add bullish exposure before it reports.
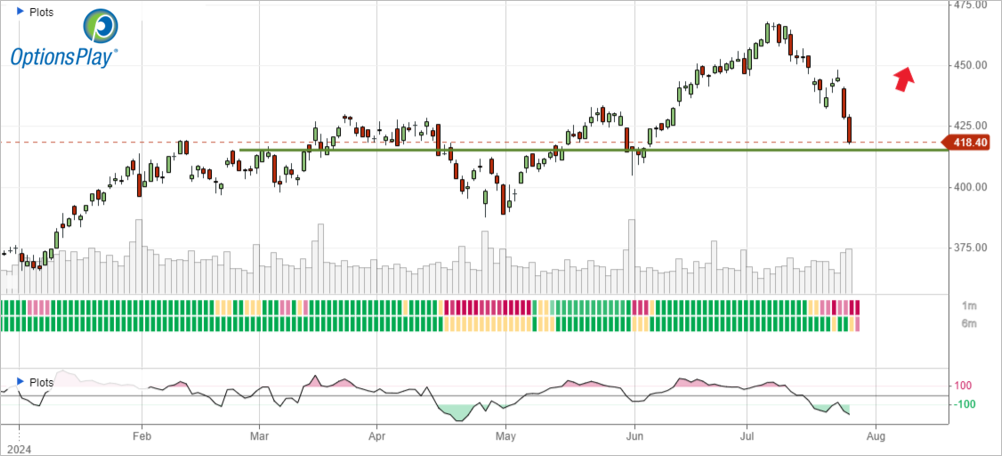
Technical Analysis
MSFT has recently pulled back to a significant support level at $415. This pullback provides a favorable entry point with reduced downside risk. Lastly with relative strength of MSFT compared to the S&P 500 remaining positive, and momentum is starting to turn positive again, this provides a bullish signal heading into earnings next week.
MSFT – Daily
Fundamental Analysis
From a valuation perspective, MSFT trades at 31x forward earnings, which represents a 50% premium to the average S&P 500 stock. However, this valuation is potentially justified given MSFT’s industry-leading margins and expected EPS and revenue growth rate of 16 and 15% respectively, driven by its strong presence in AI and cloud computing. Industry leading net margins of 36%, indicates both a highly efficient operation and high profitability on revenues.
Trade Details
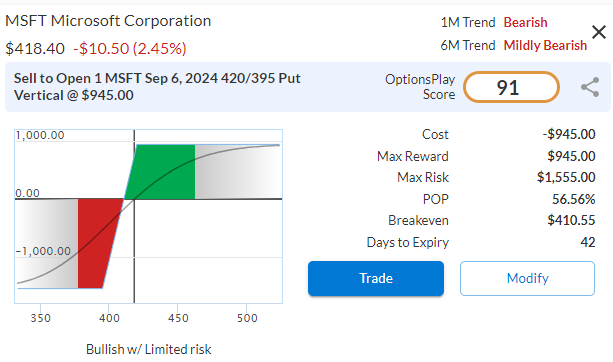
Strategy Details
Strategy: Short Put Vertical Spread
Direction: Bullish Credit Spread
Details: Sell to Open 1 MSFT Sept 6th $420/$395 Put Vertical Spread @ $9.45 Credit per Contract.
Total Risk: This trade has a max risk of $1,555 (1 Contract x $1,555) based on a hypothetical $100,000 portfolio risking 2%. We suggest using 2% of your portfolio value and divide it by $1,555 to select the # contracts for your portfolio.
Counter Trend Signal: This is a bullish trade on a stock that is currently bearish but expected to bounce higher off support.
1M/6M Trends: Bearish/ Mildly Bearish
Relative Strength: 3/10
OptionsPlay Score: 91
Stop Loss: @ $18.90 Debit. (100% loss to the value of premium)
View MSFT Trade
Entering the Trade
Use the following details to enter the trade on your trading platform. Please note that whenever there is a multi-leg option strategy, it should be entered as a single trade.
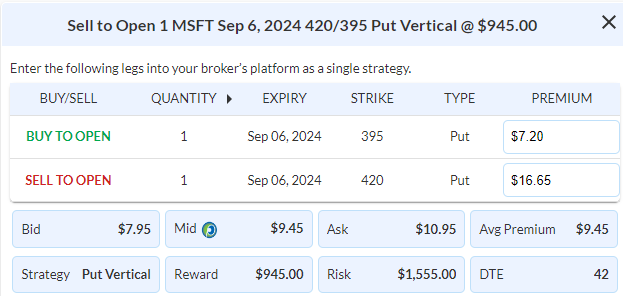
PLEASE NOTE that these prices are based on Thursday’s closing prices. Should the underlying move significantly during the pre-market hours, we will likely adjust the strikes and prices to reflect a more accurate trade entry.
View MSFT Trade
$TSM

DailyPlay – Closing Trade (TSM) – July 25, 2024
Investment Rationale
With the S&P 500 breaking below the key support level of $5450 today, the tone of the market shifts to be far more fearful and bearish. The narrowness of the market over the past few months is starting to rear its ugly head as everyone heads for the exits across a few crowded trades. With Semis leading the move lower we much trim our long exposure further with TSM today.
Closing Trade
- TSM – 116.36% loss: Buy to Close 2 Contracts (or 100% of your Contracts) Aug 23rd $185/$170 Put Vertical Spreads @ $11.90 Debit.
DailyPlay Portfolio: By Closing both Contracts, we will be paying $2,380. We initially opened these 2 Contracts on July 10 @ $5.50 Credit. Our average loss, therefore, is $640 per contract.
$LULU
DailyPlay – Closing Trade (LULU) – July 24, 2024
Investment Rationale
Despite markets recovering from the lows of last week, our LULU trade has triggered our stop loss threshold and requires trimming. We are going to close out LULU today and continue to hold the rest of our short theta positions (where time works in our favor) and look for further exit opportunities across our other DailyPlay portfolio positions.
Closing Trade
- LULU – 51.06% loss: Sell to Close 2 Contracts (or 100% of your Contracts) Aug 16th $290/$320 Call Vertical Spreads @ $5.32 Credit.
DailyPlay Portfolio: By Closing both Contracts, we will receive $1,064. We initially opened these 2 Contracts on July 18 @ $10.88 Debit. Our average loss, therefore, is $556 per contract.
DailyPlay – Portfolio Review – July 23, 2024
DailyPlay Portfolio Review
Investment Rationale
Bulls had a strong showing to start the week and stem last week’s losses. However, will there be further follow through this week? In my Monday Morning Macro Outlook session I laid out why I felt that we had a buy the dip opportunity to start off the week. So far we’ve seen the start of it but need to see it continue into the week for us to further confidence that downside risks have been mitigated. With GOOGL and TSLA earnings on deck tomorrow afternoon, all eyes are on earnings season to dictate the next leg of equities. Since our net positions are short theta I am comfortable holding them as we wait for further evidence and collect premium as we do so.
Our Trades
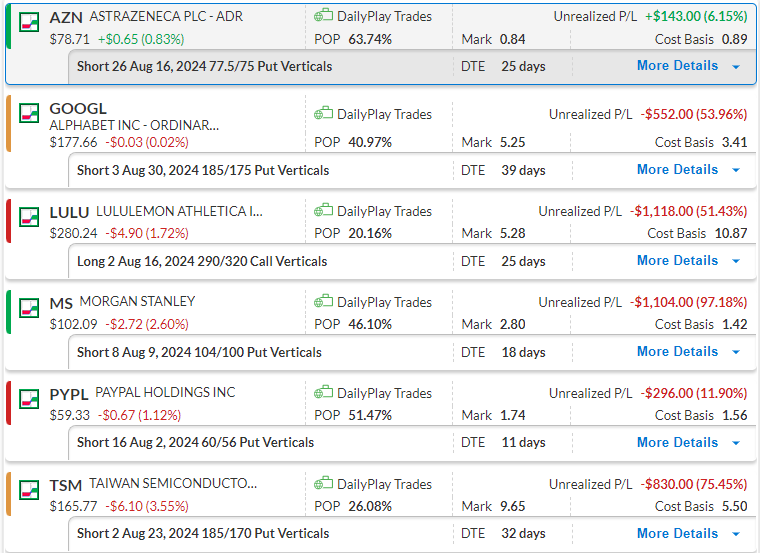
AZN – 24 DTE
Bullish Credit Spread – AZN gapped higher yesterday, pushing our gains to almost 25% on this trade. A break above $80 will likely lead to a continuation of this uptrend.
GOOGL – 38 DTE
Bullish Credit Spread – Google gapped higher yesterday to finish the trading day just short of breakeven. The next bullish target is at $190.
LULU – 24 DTE
Bullish Debit Spread – LULU also had a positive day, recovering some of the recent losses, as support at this level is holding.
MS – 17 DTE
Bullish Credit Spread – Support around the $100 mark held for MS yesterday and an upside recovery seems likely.
PYPL – 10 DTE
Bullish Credit Spread – PYPL recovered and is now trading in positive territory. A break above $62 will likely lead to upside gains, targeting $65 and then $68.
TSM – 31 DTE
Bullish Credit Spread – TSM bounced off $165 support yesterday. This warrants holding onto this position in anticipation of further upside.
DailyPlay – Portfolio Review – July 22, 2024
DailyPlay Portfolio Review
Investment Rationale
Equity markets are sitting just above a major support level. We are waiting to see if these levels hold this week before entering any new positions to our DailyPlay portfolio. In the meantime our positions are net short theta so time is working in our favor as we hold our positions and wait for confirmation that bulls can maintain control this week.
Our Trades
AZN – 25 DTE
Bullish Credit Spread – AZN bounced on last week’s lows placing this trade back in positive territory.
GOOGL – 39 DTE
Bullish Credit Spread – Last week’s low has held as support which could lead to a bounce off this level.
LULU – 25 DTE
Bullish Debit Spread – LULU continued to slip but is still in an area of support. The next day or two would determine if support holds.
MS – 18 DTE
Bullish Credit Spread – MS had a strong move lower on Friday and is now trading around the $100 support. A bounce off this area is expected to warrant holding onto this position.
PYPL – 11 DTE
Bullish Credit Spread – We will keep a close eye on PYPL as we are 11 days out from expiry.
TSM – 32 DTE
Bullish Credit Spread – Currently trading around the Friday low of $165, which is an area of support. A bounce higher off this level is needed to remain in this trade.
DailyPlay – Portfolio Review – July 19, 2024
DailyPlay Portfolio Review
Investment Rationale
The VIX closed above the 16 handle yesterday and technology has led this market lower. Many of you are asking if this is the start of a larger pullback or another opportunity to buy the dip. Based on what I’m seeing, my view is that it’s more likely a buy the dip type selloff and we are very much at a level where this could start to reverse back higher. We continue to see the RSP equal weight S&P remain very close to all-time highs. The swaps market is now pricing in 3 rate cuts for 2024, and the 10-year yields remain below 4.2%. The lack of participation that we highlighted over the past 7 months have reversed to a degree that we have never seen before. The Equal Weight S&P 500 has confirmed the current bullish trend. We’ve seen a healthy amount of sector rotation with flow out of Tech, Energy and Communications and flow into Discretionary, Materials, Industrials, Financials, Real Estate and Utilities. If this trend continues, we have a far healthier equity market rally with broader participation. Earnings reflect our largest risk at the moment and we will see a lot more by next week. Our DailyPlay Portfolio has a lot of long exposure which is why we are not adding further exposure on this buy the dip opportunity, and simply monitor our existing positions for exit opportunities.
Our Trades
AZN – 28 DTE
Bullish Credit Spread – $78 support has held so far, which supports our bullish thesis, with 28 days left, we will continue to hold this position.
GOOGL – 42 DTE
Bullish Credit Spread – Next level of support is $172, however, oversold conditions suggests a bounce is likely from here.
LULU – 28 DTE
Bullish Debit Spread – Our counter trend position requires LULU to stay above $282, a break below that would warrant cutting losses.
MS – 21 DTE
Bullish Credit Spread – We’re looking for $104 to hold, we have already taken profits on MS twice and now looking to at least break even on the last trade.
PYPL – 14 DTE
Bullish Credit Spread – The chart continues to look more constructive as it makes higher highs, we’ll monitor to see if the $60 support level holds this week.
TSM – 35 DTE
Bullish Credit Spread – With 35 days left to go and stop loss levels have not been triggered, we have the opportunity to continue holding this position and look for a bounce in semis.
$LULU
DailyPlay – Opening Trade (LULU) – July 18, 2024
LULU Bullish Opening Trade Signal
Investment Rationale
Lululemon Athletica Inc. (LULU) has been out of favor for the past 8 months, but its time take another look now. The charts are beginning to show signs that sellers are exhausted, while the fundamentals are becoming compelling. With improving technical and fundamental outlooks, LULU presents an attractive risk to reward for long exposure.
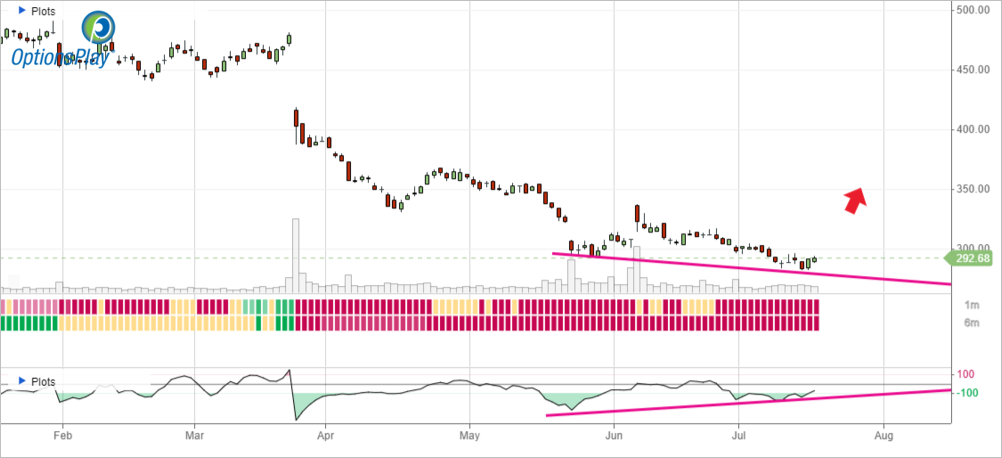
Technical Analysis
After peaking in Dec above $500, LULU has declined over 40% since then. However, recent new lows have been coupled with positive divergence, suggesting that sellers are starting to get exhausted and further downside is potentially limited. Momentum is also showing signs of bottoming out, which aligns with the notion of a potential near-term recovery.
LULU – Daily
Fundamental Analysis
And when we look at the business, LULU is trading at 20x forward earnings (slight discount to the S&P 500) despite decent EPS and revenue growth expectations of 11% and 10%, respectively. These growth rates are supported by strong net margins of 16%. The valuation is attractive compared to the broader market, suggesting that LULU may be due for a rebound as investor sentiment shifts.
Trade Details
Strategy Details
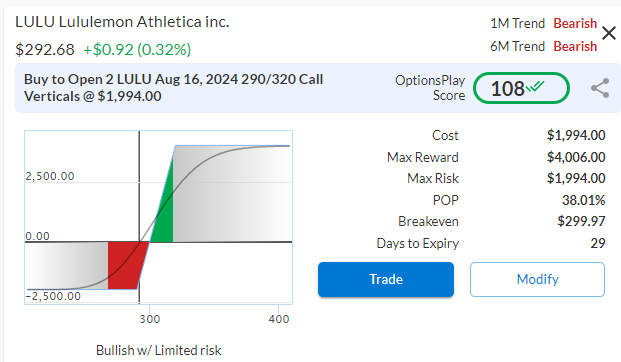
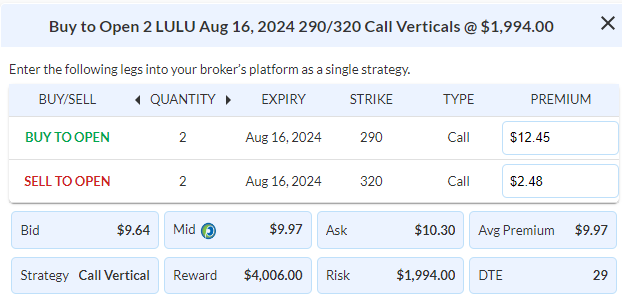
Strategy: Long Call Vertical Spread
Direction: Bullish Debit Spread
Details: Buy to Open 2 LULU Aug 16th $290/$320 Call Vertical Spreads @ $9.97 Debit per Contract.
Total Risk: This trade has a max risk of $1,994 (2 Contracts x $997) based on a hypothetical $100,000 portfolio risking 2%. We suggest using 2% of your portfolio value and divide it by $997 to select the # contracts for your portfolio.
Counter Trend Signal: This is a bullish trade on a stock that has bounced off support and is expected to continue higher.
1M/6M Trends: Bearish/Bearish
Relative Strength: 1/10
OptionsPlay Score: 108
Stop Loss: @ $4.99 Credit. (50% loss of premium)
View LULU Trade
Entering the Trade
Use the following details to enter the trade on your trading platform. Please note that whenever there is a multi-leg option strategy, it should be entered as a single trade.
PLEASE NOTE that these prices are based on Wednesday’s closing prices. Should the underlying move significantly during the pre-market hours, we will likely adjust the strikes and prices to reflect a more accurate trade entry.
View LULU Trade
$AXP
DailyPlay – Closing Trade (AXP) – July 17, 2024
Investment Rationale
As AXP breaks out above our $240 target price, we have made nearly 88% of the max profit on the trade with 30 days left to go. The risk to reward for continuing to hold this trade starts to look unattractive and I would use this opportunity to take profits on the trade. This allows us to redeploy this capital elsewhere where the risk/reward is skewed in our favor.
Closing Trade
- AXP – 56.24% gain: Sell to Close 4 Contracts (or 100% of your Contracts) Aug 16th $220/$240 Call Vertical Spreads @ $17.64 Credit.
DailyPlay Portfolio: By Closing all 4 Contracts, we will receive $7,056. We initially opened 2 Contracts on June 18 @ $9.63 Debit, and then anther 2 Contracts on July 3 @ $12.95 Debit. Our average gain, therefore, is $635 per contract with a total gain of $2,540 on our Portfolio.