
$AZN

DailyPlay – Opening Trade (AZN) – July 1, 2024
AZN Bullish Opening Trade Signal
Investment Rationale
Having come off some positive news in their oncology and vaccine pipeline recently, AZN’s recent outperformance is worth paying attention too, especially as the technicals and fundamentals align for further potential upside.
Technical Analysis
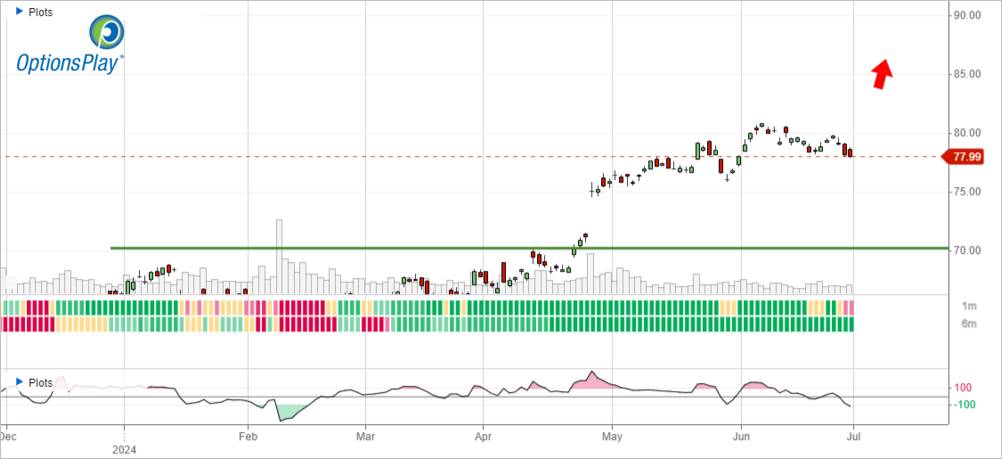
AZN broke out from its $70 range back in April and has continued higher with strong momentum. The recent pullback to its $78 support level provides an attractive risk/reward for adding bullish exposure and seeking further upside.
AZN – Daily
Fundamental Analysis
With expected EPS and revenue growth that is slightly higher than the average S&P 500 stock and strong margins, AZN trades at 10% discount to the average S&P 500 stock. This reflects at least a 10-15% upside in the valuation of AZN if we look at the fundamentals. With a robust drug pipeline there favorable upside potential for AZN.
Trade Details
Strategy Details
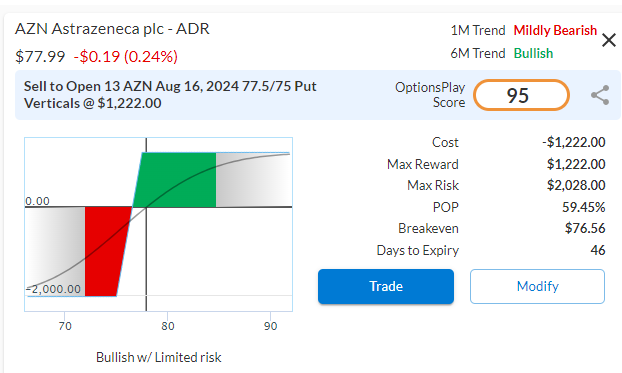
Strategy: Short Put Vertical Spread
Direction: Bullish Credit Spread
Details: Sell to Open 13 Contracts August 16th $77.5/75 Put Vertical Spreads @ $0.94 Credit per Contract.
Total Risk: This trade has a max risk of $2,028 (13 Contracts x $156) based on a hypothetical $100,000 portfolio risking 2%. We suggest using 2% of your portfolio value and divide it by $156 to select the # contracts for your portfolio.
Trend Continuation Signal: This is a bullish trade on a stock that is trading higher and is expected to continue the uptrend.
1M/6M Trends: Mildly Bearish /Bullish
Relative Strength: 9/10
OptionsPlay Score: 95
Stop Loss: @ $1.88 Debit. (100% loss to the value of premium received)
View AZN Trade
Entering the Trade
Use the following details to enter the trade on your trading platform. Please note that whenever there is a multi-leg option strategy, it should be entered as a single trade.
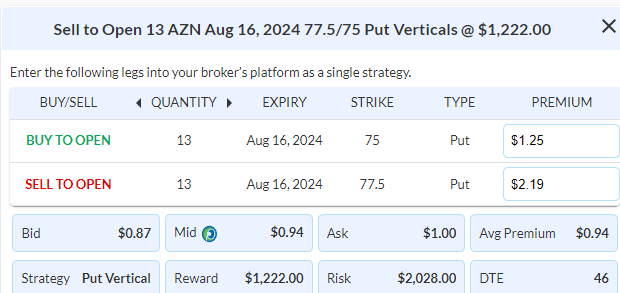
PLEASE NOTE that these prices are based on Friday’s closing prices. Should the underlying move significantly during the pre-market hours, we will likely adjust the strikes and prices to reflect a more accurate trade entry.
View AZN Trade

DailyPlay – Portfolio Review – June 28, 2024
DailyPlay Portfolio Review
Investment Rationale
As all eyes are on the Fed’s preferred inflation gauge, the PCE index this morning, expectations are for further improvement on the data for inflation towards the 2% target. Given the market moving event, we will simply monitor existing positions today and not enter any new positions.
Our Trades
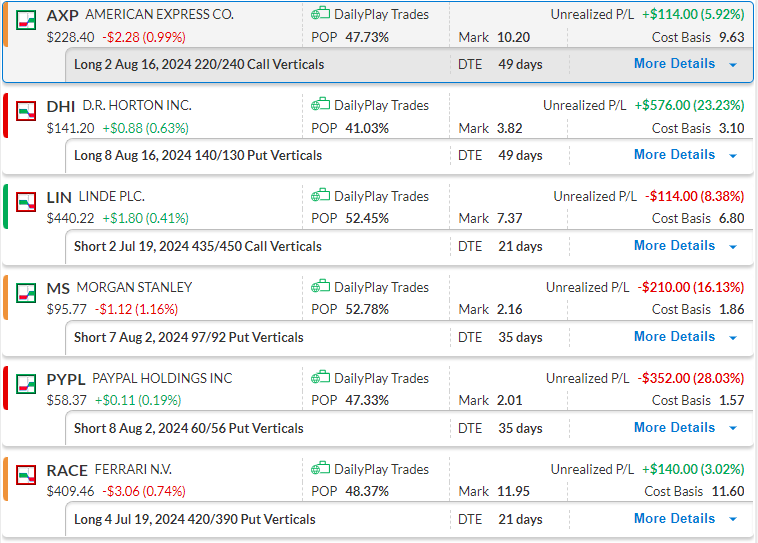
AXP – 49 DTE
Bullish Debit Spread – AXP has been trading between $228 and $231 over the last week. A break above $231 would indicate that further upside is on the table.
DHI – 49 DTE
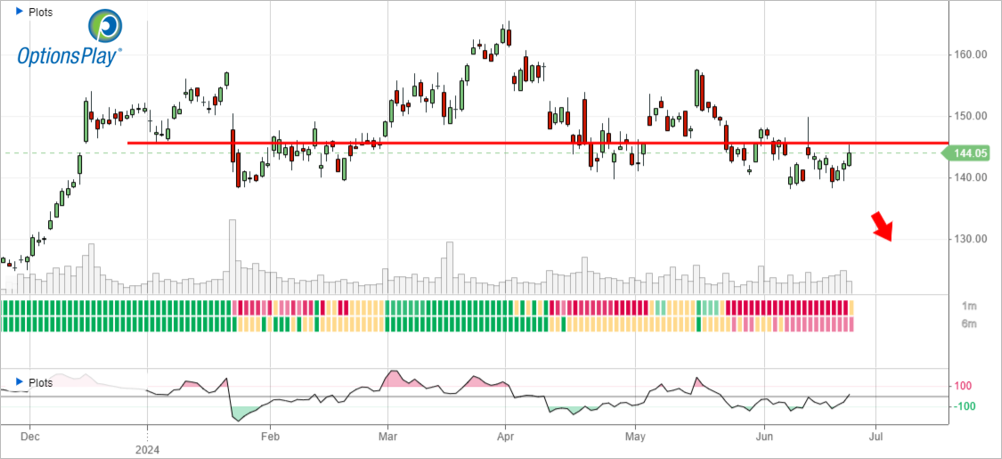
Bearish Debit Spread – Continues to trade just above the $140 support level and we’re looking for a break lower as performance relative to the market remains poor.
LIN – 21 DTE
Bearish Credit Spread – After filling the gap at $441, LIN has failed to break higher and now at risk of pulling back to its $425 support level.
MS – 35 DTE
Bullish Credit Spread – MS remains bullish and support at $95 is confirming our bullish thesis on this trade.
PYPL – 35 DTE
Bullish Credit Spread – Yesterday’s price action suggests $58 support remains strong, we’re looking for a bounce higher above $60.
RACE – 21 DTE
Bearish Debit Spread – Relative performance remains poor and at risk of pulling back to its $400 support and potentially lower.
$PDD

DailyPlay – Closing Trade (PDD) – June 27, 2024
Investment Rationale
In light of AMZN’s announcement for plans to create a direct low-cost channel with Chinese goods to counter PDD’s Temu, we should consider cutting losses on our PDD trade despite not triggering our stop loss levels. This is an example where the fundamentals changed after we entered a trade and the original thesis is no longer valid. When this happens it is best to cut losses when they are still small and move on instead of waiting and hoping.
Closing Trade
- PDD – 47.69% loss: Buy to Close 4 Contracts (or 100% of your Contracts) August 2nd $143/$135 Put Vertical Spreads @ $4.15 Debit. DailyPlay Portfolio: By Closing all 4 Contract, we will be paying $1,660 We opened these 4 Contract on June 24 @ $2.81 Credit. Our average loss, therefore, is $134 per contract.
$MS
DailyPlay – Opening Trade (MS) – June 26, 2024
MS Bullish Opening Trade Signal
Investment Rationale
As we approach the end of the quarter and earnings season is ramping back up, banks are on the docket first. After outperforming the S&P 500, financials have lost ground over the past few weeks to technology, but started to play catchup this week. Morgan Stanley recently pulled back to a major support level and looks attractive from a risk/reward perspective to add long exposure as financials start to show performance again.
Technical Analysis
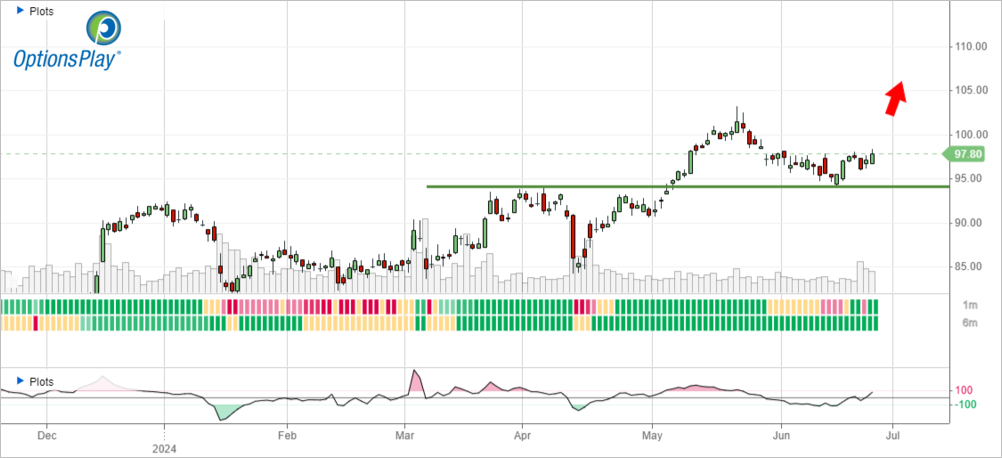
Morgan Stanley recently broke out above a major resistance level at $92-94 that has been in place for over a year and recently just retested it as support. With a potential breakout above its $98 resistance level, MS is setup to potentially retest its all-time highs around $110, our upside target.
MS – Daily
Fundamental Analysis
From a valuation perspective, MS is trading on the upper end of its historical range at 1.7x book value. However, it is expected to grow at a healthy clip relative to its peers with 8% EPS growth and 3-4% Revenue growth expected over the next few years. Additionally, if lighter capital rules are put in place by the Fed from its annual stress test, it would be a significant positive factor for banks such as MS.
Trade Details
Strategy Details
Strategy: Short Put Vertical Spread
Direction: Bullish Credit Spread
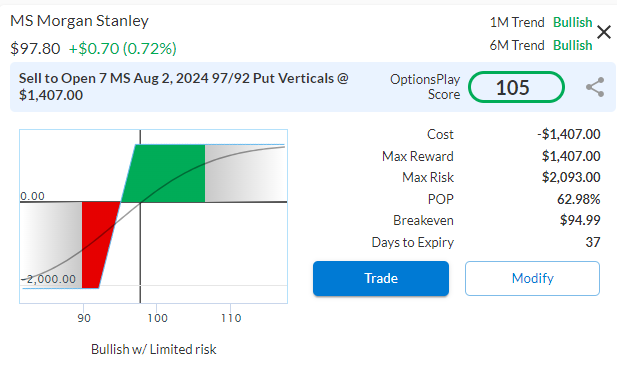
Details: Sell to Open 7 Contracts August 2nd $97/$92 Put Vertical Spreads @ $2.01 Credit per Contract.
Total Risk: This trade has a max risk of $2,093 (7 Contracts x $299) based on a hypothetical $100,000 portfolio risking 2%. We suggest using 2% of your portfolio value and divide it by $299 to select the # contracts for your portfolio.
Trend Continuation Signal: This is a bullish trade on a stock that is trading higher and is expected to break out above a level of resistance.
1M/6M Trends: Bullish/Bullish
Relative Strength: 7/10
OptionsPlay Score: 105
Stop Loss: @ $4.02 Debit. (100% loss to the value of premium received)
View MS Trade
Entering the Trade
Use the following details to enter the trade on your trading platform. Please note that whenever there is a multi-leg option strategy, it should be entered as a single trade.
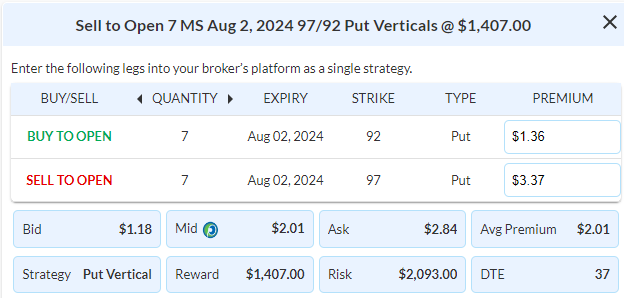
PLEASE NOTE that these prices are based on Tuesday’s closing prices. Should the underlying move significantly during the pre-market hours, we will likely adjust the strikes and prices to reflect a more accurate trade entry.
View MS Trade
$DHI

DailyPlay – Rolling Trade (DHI) – June 25, 2024
Closing Trade
- DHI – 72.83% loss: Sell to Close 7 Contracts (or 100% of your Contracts) July 5th $140/$130 Put Vertical Spreads @ $0.75 Credit. DailyPlay Portfolio: By Closing all 7 Contracts, we will receive $525. We opened these 7 Contracts on May 10 @ $3.22 Debit. The average loss, therefore, is $247.
DHI Bearish Opening Trade Signal
Investment Rationale
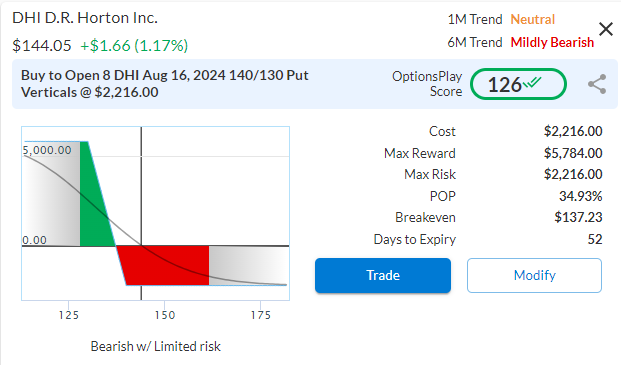
DHI continues to trend lower in the direction of our thesis but our Debit Spreads expires in less than two weeks and is running out of time. We will believe in our overall thesis so I am advocating that we roll the July 5 $140/130 Put Vertical to an Aug 16 $140/130 Put Vertical for a Net Debit of $2.02 Debit ($2.77 – $0.75) to buy ourselves 2 more months of time for DHI to breakdown below the key $140 support.
We Roll this trade by Closing the existing Trade and Opening a new one.
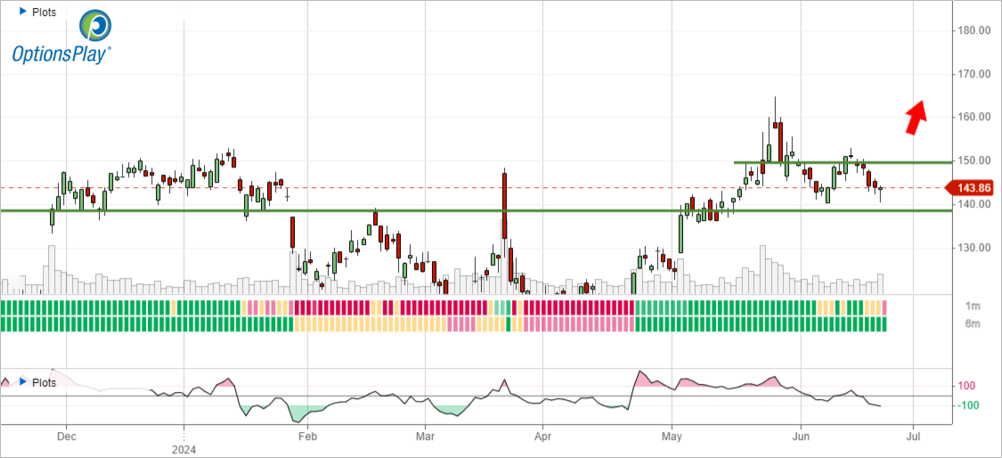
DHI – Daily
Trade Details
Strategy Details
Strategy: Long Put Vertical Spread
Direction: Bearish Debit Spread
Details: Buy to Open 8 Contracts August 16th $140/$130 Put Vertical Spreads @ $2.77 Debit per Contract.
Total Risk: This trade has a max risk of $2,216 (8 Contracts x $277) based on a hypothetical $100,000 portfolio risking 2%. We suggest using 2% of your portfolio value and divide it by $277 to select the # contracts for your portfolio.
Trend Continuation Signal: This is a bearish trade on a stock that is trending lower.
1M/6M Trends: Neutral/Mildly Bearish
Relative Strength: 4/10
OptionsPlay Score: 126
Stop Loss: @ $1.39 Credit. (50% loss of premium)
View DHI Trade
Entering the Trade
Use the following details to enter the trade on your trading platform. Please note that whenever there is a multi-leg option strategy, it should be entered as a single trade.
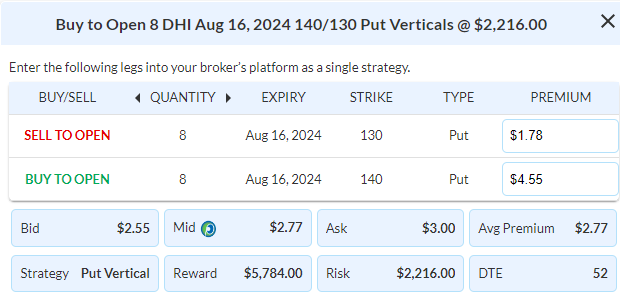
PLEASE NOTE that these prices are based on Monday’s closing prices. Should the underlying move significantly during the pre-market hours, we will likely adjust the strikes and prices to reflect a more accurate trade entry.
View DHI Trade
$PDD
DailyPlay – Opening Trade (PDD) – June 24, 2024
PDD Bullish Opening Trade Signal
Investment Rationale
In the current environment, it’s hard to find valuation bargains with growth stocks, but PDD stands out from the rest. With fast growing multi-national eCommerce brands, PDD is generating substantial cash flow yet trades at a substantial discount and presents an attractive investment opportunity.
Technical Analysis
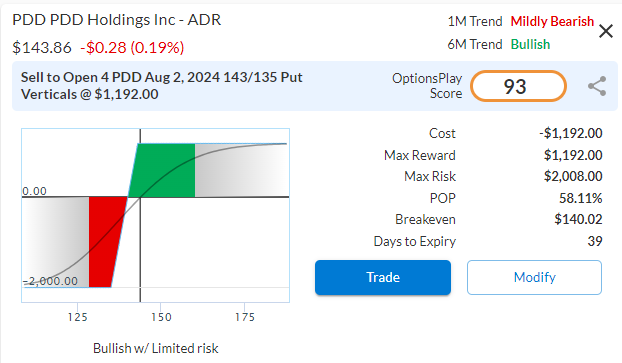
PDD has been trading in a range between $110 and $150 and recently the price action suggests a potential breakout above its $150 resistance level. After breaking out above a minor resistance level at $138, its pulled back to retest as support and the risk/reward favor adding long exposure at these levels to setup for a potential breakout.
PDD – Daily
Fundamental Analysis
Trading at 12x forward earnings, it almost looks like a mistake when you consider the industry leading 26% Net Margins and the 40-50% EPS and Revenue growth analysts are expecting over the the next few years. This represents a substantial discount to the multiples that fast growing companies typically would trade for.
Trade Details
Strategy Details
Strategy: Short Put Vertical Spread
Direction: Bullish Credit Spread
Details: Sell to Open 4 Contracts August 2nd $143/$135 Put Vertical Spreads @ $2.98 Credit per Contract.
Total Risk: This trade has a max risk of $2,008 (4 Contracts x $502) based on a hypothetical $100,000 portfolio risking 2%. We suggest using 2% of your portfolio value and divide it by $502 to select the # contracts for your portfolio.
Trend Continuation Signal: This is a bullish trade on a stock that is trading higher and recently found a new level of support.
1M/6M Trends: Mildly Bearish/Bullish
Relative Strength: 4/10
OptionsPlay Score: 93
Stop Loss: @ $5.96 Debit. (100% loss to the value of premium received)
View PDD Trade
Entering the Trade
Use the following details to enter the trade on your trading platform. Please note that whenever there is a multi-leg option strategy, it should be entered as a single trade.

PLEASE NOTE that these prices are based on Friday’s closing prices. Should the underlying move significantly during the pre-market hours, we will likely adjust the strikes and prices to reflect a more accurate trade entry.
View PDD Trade
$PYPL
DailyPlay – Opening Trade (PYPL) – June 21, 2024
PYPL Bullish Opening Trade Signal
Investment Rationale
Back in April, I laid out a bullish thesis for a turnaround at PayPal. Despite the stock price slipping about 6% over the past couple of weeks, the fundamentals have continued to improve and now the charts present another opportunity to gain long exposure in PYPL where the risk/reward is quite attractive around the $60 level.
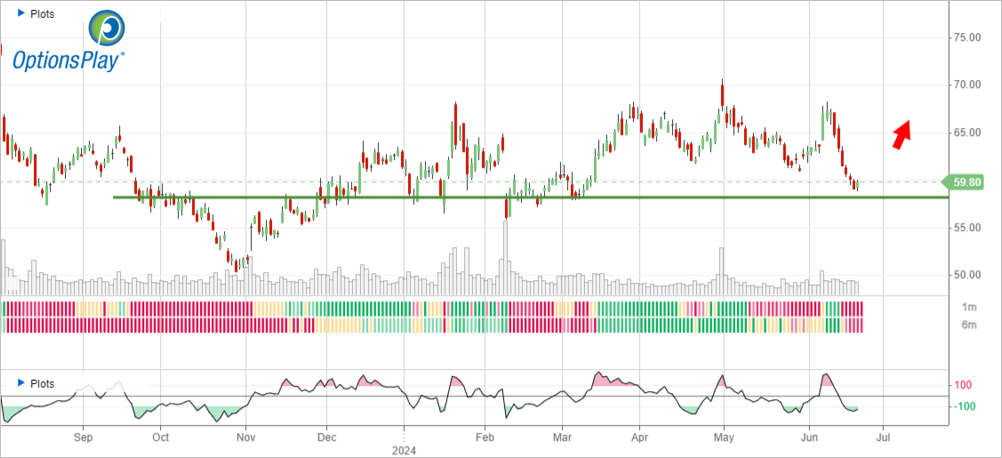
Technical Analysis
After peaking back in July of 2021, the stock has declined nearly 80% and has spent the last 12 months forming a bottoming formation and has stabilized its decline. We see a bearish to bullish reversal with an inverted head & shoulder formation on the longer term chart. And if we zoom in, the stock has traded within a $58-68 range for 6 months and we approached the bottom end of that range with oversold conditions, the risk to reward for adding long exposure at these levels are attractive.
PYPL – Daily
Fundamental Analysis
Now if we examine the fundamentals, the business looks even more compelling over the past couple of quarters. PYPL trades at 15x forward earnings, a 25% discount to the average S&P 500 stock, despite analysts expecting the company to grow EPS by 16% and revenue by 7% over the next few years. This has recently been revised higher on the back of their recent earnings beat. With improving net margins at 14%, PYPL should be trading at a slight premium to the average S&P 500 stock in terms of valuation, suggesting at least a 25-30% upside from here.
Trade Details
Strategy Details
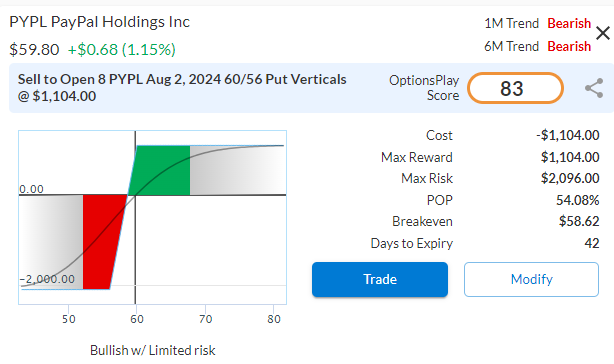
Strategy: Short Put Vertical Spread
Direction: Bullish Credit Spread
Details: Sell to Open 8 Contracts August 2nd $60/$56 Put Vertical Spreads @ $1.38 Credit per Contract.
Total Risk: This trade has a max risk of $2,096 (8 Contracts x $262) based on a hypothetical $100,000 portfolio risking 2%. We suggest using 2% of your portfolio value and divide it by $262 to select the # contracts for your portfolio.
Counter Trend Signal: This is a bullish trade on a stock that is expected to bounce higher off support.
1M/6M Trends: Bearish/Bearish
Relative Strength: 3/10
OptionsPlay Score: 83
Stop Loss: @ $2.76 Debit. (100% loss to the value of premium received)
View PYPL Trade
Entering the Trade
Use the following details to enter the trade on your trading platform. Please note that whenever there is a multi-leg option strategy, it should be entered as a single trade.
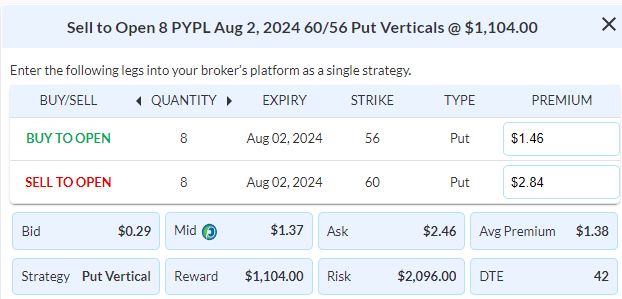
PLEASE NOTE that these prices are based on Thursday’s closing prices. Should the underlying move significantly during the pre-market hours, we will likely adjust the strikes and prices to reflect a more accurate trade entry.
View PYPL Trade
$HD
DailyPlay – Closing Trade (HD) – June 20, 2024
Closing Trade
HD – 69.94% loss: Sell to Close 3 Contracts (or 100% of your Contracts) Aug 16th $325/$300 Put Vertical Spreads @ $1.99 Credit. DailyPlay Portfolio: By Closing all 3 Contracts, we will receive $597. We opened these 3 Contracts on May 4 @ $6.62 Debit. The average loss, therefore, is $463.
Investment Rationale
On Monday, we laid out rules that if HD were to breakout above $350 it would warrant cutting losses on the trade, since we have triggered that threshold on Tuesday, we are closing this trade on the open for Thursday and continuing to monitor the remaining positions.
$AXP
DailyPlay – Opening Trade (AXP) – June 18, 2024
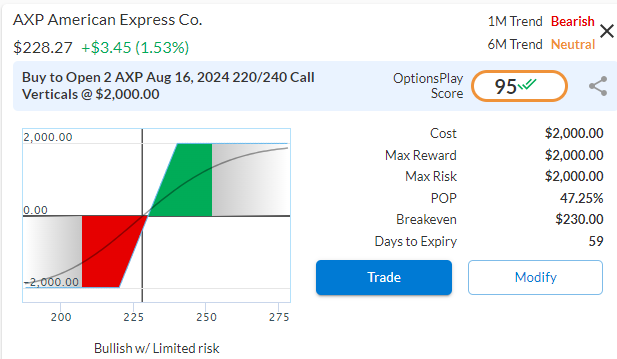
AXP Bullish Opening Trade Signal
Investment Rationale
As consumers become more selective in their spending, restaurants and travel remain bright spots in consumer spending. With American Express’s focus on premium customers who are continuing to spend in these categories, AXP is positioned to outperform its industry.
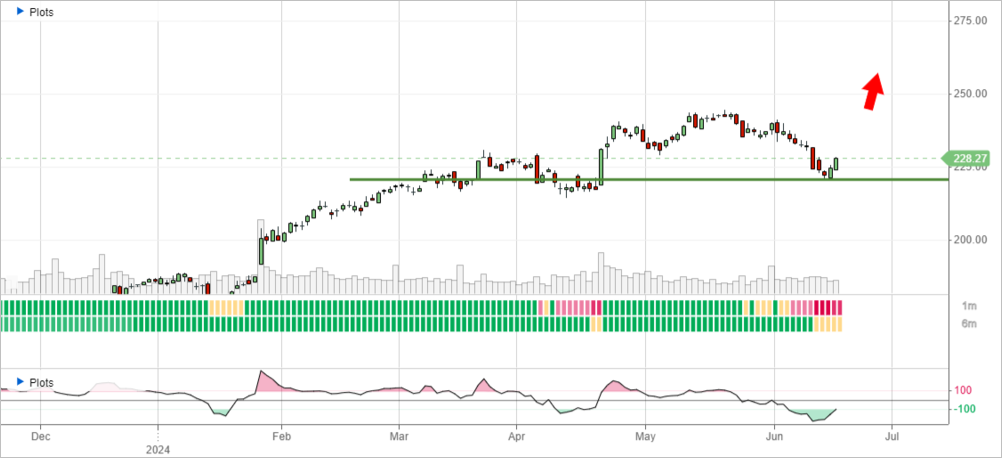
Technical Analysis
If we look at chart of AXP, it’s had an incredible run over the past year, rallying nearly 60% from the Oct 2023 lows, and recently, it has pulled back 8% from its peak a few weeks ago to its key $225 support level. This presents a more attractive risk/reward for adding long exposure within this strong bullish trend.
AXP – Daily
Fundamental Analysis
Shifting over to the business, AXP is expected to grow EPS at an above average clip of 15% and revenue at 9%, yet it trades at a 12% discount to the average S&P 500 stock. With net interest income and card fees expected to grow, this discount reflects the upside opportunity for AXP to trade back towards its 52-week highs and beyond.
Trade Details
Strategy Details
Strategy: Long Call Vertical Spread
Direction: Bullish Debit Spread
Details: Buy to Open 2 Contracts August 16th $220/$240 Call Vertical Spreads @ $10.00 Debit per Contract.
Total Risk: This trade has a max risk of $2,000 (2 Contracts x $1,000) based on a hypothetical $100,000 portfolio risking 2%. We suggest using 2% of your portfolio value and divide it by $1,000 to select the # contracts for your portfolio.
Counter Trend Signal: This is a bullish trade on a stock that is expected to bounce higher off support.
1M/6M Trends: Bearish/Neutral
Relative Strength: 9/10
OptionsPlay Score: 95
Stop Loss: @ $5.00 Credit. (50% loss of premium)
View AXP Trade
Entering the Trade
Use the following details to enter the trade on your trading platform. Please note that whenever there is a multi-leg option strategy, it should be entered as a single trade.
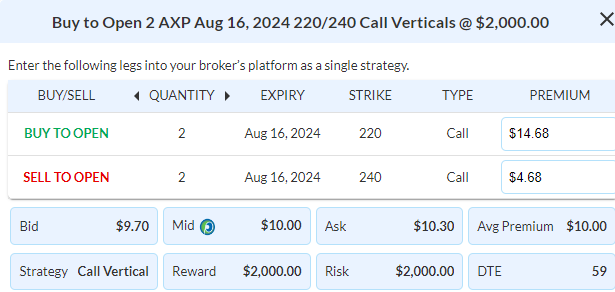
PLEASE NOTE that these prices are based on Monday’s closing prices. Should the underlying move significantly during the pre-market hours, we will likely adjust the strikes and prices to reflect a more accurate trade entry.
View AXP Trade
$ADBE, $NKE
DailyPlay – Closing Trades (ADBE, NKE) – June 17, 2024
Closing Trades
- ADBE – 94.09% gain: Buy to Close 1 Contract (or 100% of your Contracts) July 19th $455/$425 Put Vertical Spread @ $0.67 Debit. DailyPlay Portfolio: By Closing this Contract, we will pay $67. We opened this Contract on June 6 @ $11.33 Credit. The gain, therefore, is $1,066.
- NKE – 51.50% loss: Sell to Close 14 Contracts (or 100% of your Contracts) June 21st $92.50/$100 Call Vertical Spreads @ $1.52 Credit. DailyPlay Portfolio: By Closing all 14 Contracts, we will receive $2,128. We opened 7 Contracts on April 17 @ $2.98 Debit. On May 5 we opened another 7 Contracts @ $3.29 Debit. The average loss, therefore, is $161.
Investment Rationale
As we head into a shortened week of trading and triple witching on Friday, we have two positions that require managing today. ADBE last week reported stronger than expected earnings and rallied significantly. We need to close out of Put Vertical at a profit, while NKE failed to sustain it’s breakout above $95 and we are approaching expiration.