
$LIN

DailyPlay – Opening Trade (LIN) – June 14, 2024
LIN Bearish Opening Trade Signal
Investment Rationale
Despite equities pushing to new all-time highs, one sector that is lagging further behind is Materials. Traditionally a growth sector that should rally along with a bull market, Materials is trending in the opposite direction and under-performing the S&P 500 by more than 7% over the last month and half. This risks further downside especially for the stocks in this sector that are trading at rich valuations such as LIN.
Technical Analysis
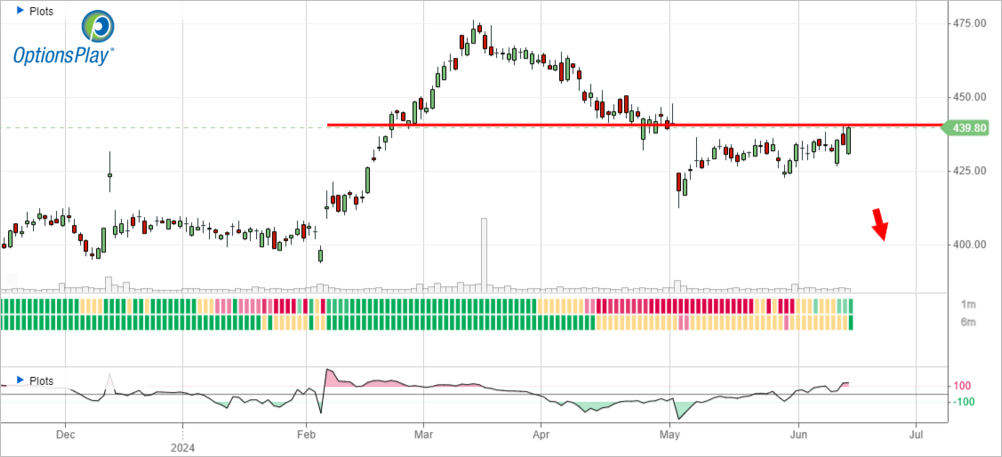
A provider of industrial gases, LIN isn’t a household brand, yet the charts are giving us a reason to pay attention. After turning bearish after reaching its $475 peak, it gapped lower last month and just managed to track back up to that gap fill level of $440. However the under-performance of LIN relative to both the market and its sector is suggesting that the gap fill will act as resistance and is likely to resume it’s bearish trend.
LIN – Daily
Fundamental Analysis
And if we look at the business, this is where the risks lay. Trading at 28x forward earnings, LIN is expensive by all accounts, specifically within the materials sector. While LIN benefits from industry leading net margins of 19%, the company is not expected to grow much faster than the average S&P 500 stock (9% EPS and 4% Revenue). This flies in the face of a materials stocks trading at a valuation 40% higher than the average S&P 500 stock. The risk here is that multiple contraction alone could bring this stock materially lower.
Trade Details
Strategy Details
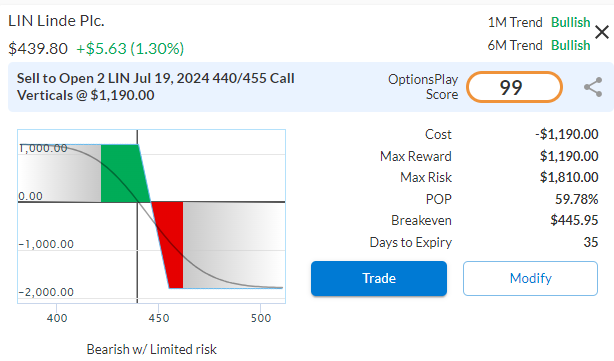
Strategy: Short Call Vertical Spread
Direction: Bearish Credit Spread
Details: Sell to Open 2 Contracts July 19th $440/$455 Call Vertical Spreads @ $5.95 Credit per Contract.
Total Risk: This trade has a max risk of $1,810 (2 Contracts x $905) based on a hypothetical $100,000 portfolio risking 2%. We suggest using 2% of your portfolio value and divide it by $905 to select the # contracts for your portfolio.
Counter Trend Signal: This is a bearish trade on a stock that is expected to pull back from resistance.
1M/6M Trends: Bullish/Bullish
Relative Strength: 7/10
OptionsPlay Score: 99
Stop Loss: @ $11.90 Debit. (100% loss of premium received)
View LIN Trade
Entering the Trade
Use the following details to enter the trade on your trading platform. Please note that whenever there is a multi-leg option strategy, it should be entered as a single trade.
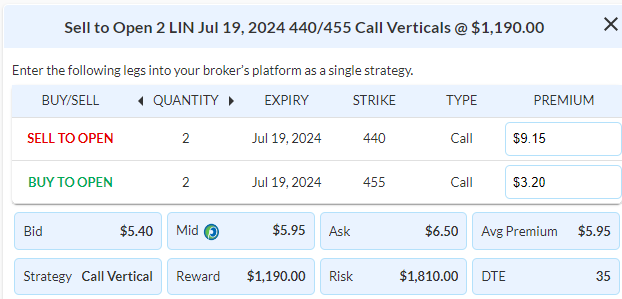
PLEASE NOTE: Based on the pre-market prices, consider Selling the July $435/450 Call Vertical for around $5.85 Credit. We will update our DailyPlay Portfolio on the platform around 9:45 with an executable price.
View LIN Trade
$KR

DailyPlay – Closing Trade (KR) – June 13, 2024
Investment Rationale
Yesterday’s economic data was a roller coaster for investors. CPI came in cooler than expected and bonds and equities rallied across the board with sizable gains, however the Fed struck a hawkish tone and suggested only 1 rate cut was expected for 2024. Bond and equity markets largely shrugged off the Fed’s rhetoric and continues to price in 2 cuts for 2024. This becomes challenging as it’s difficult to fight the clear bullish trend, but we’re fighting the Fed. We’re going to close out our KR short position for a profit and reducing our short exposure significantly before the end of this week, given the strength of the market.
Closing Trade
- KR – 69.06% gain: Sell to Close 17 Contracts (or 100% of your Contracts) July 5th $53/$49 Put Vertical Spreads @ $2.35 Credit. DailyPlay Portfolio: By Closing all 17 Contract, we will receive $3,995. We opened these 17 Contract on May 28 @ $1.20 Debit. Our average gain, therefore, is $115 per contract, with a total gain of $1,955.

DailyPlay – Portfolio Review – June 12, 2024
DailyPlay Portfolio Review
Investment Rationale
We get a double whammy today with CPI at 8:30AM and Fed decision at 2PM EST. Expectations are for inflation to continue to improve towards the Fed’s 2% target and for the Fed to keep interest rates steady. However, what will likely move markets will be the language from Chairman Powell’s speech or if we get a surprise from the CPI print. With such potential volatility today, we will continue to hold our DailyPlay positions that have continued to improve nicely.
Our Trades
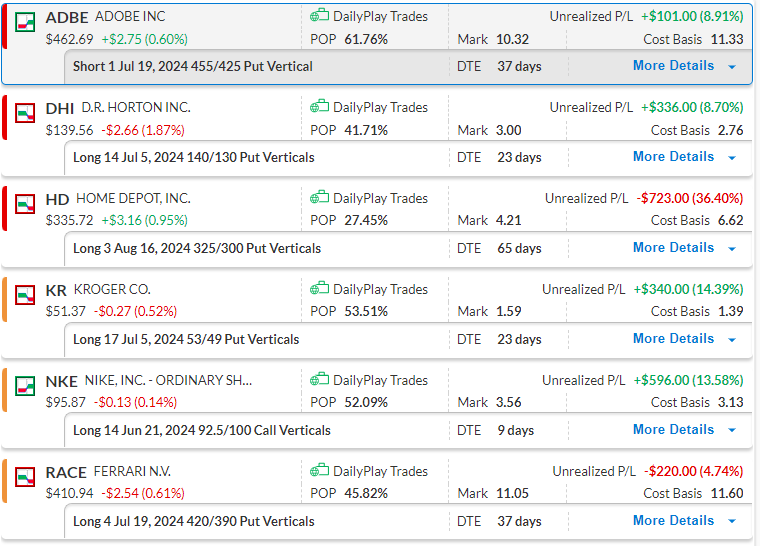
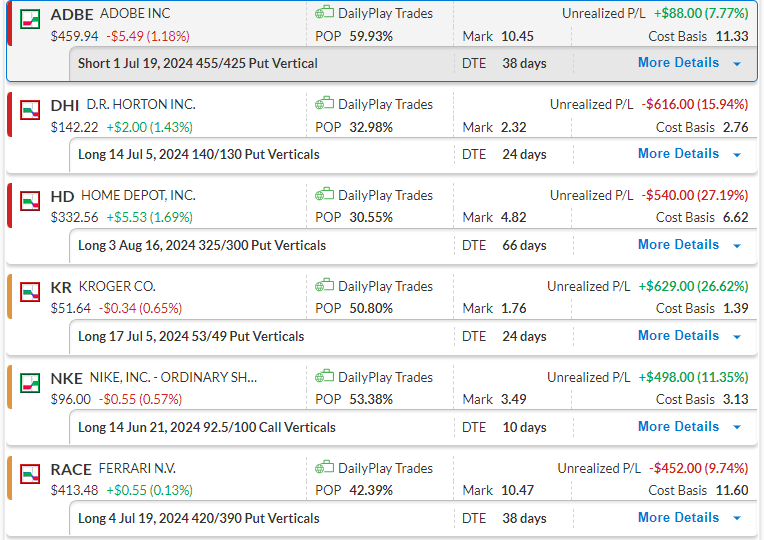
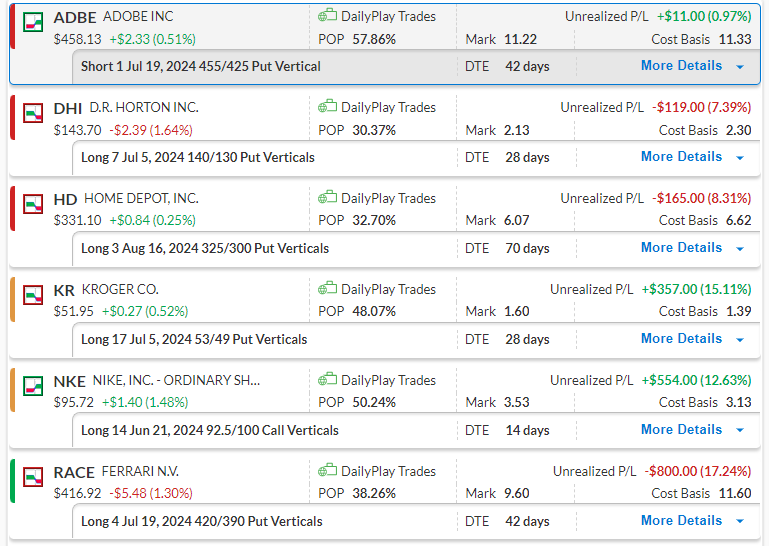
ADBE – 37 DTE
Bullish Credit Spread – Earnings are slated for Thursday PM and now sitting just above its $460 support, will consider closing before earnings event.
DHI – 23 DTE
Bearish Debit Spread – Just broke below its key $140 major support with poor relative performance, we’re targeting low $120’s on further downside.
HD – 65 DTE
Bearish Debit Spread – Starting to break above its $335 resistance level, further upside would warrant cutting losses on this trade.
KR – 23 DTE
Bearish Debit Spread – Now within $1 of filling its gap at $50.60, with extended targets of $47 to the downside.
NKE – 9 DTE
Bullish Debit Spread – Sitting just above below our $96 support/resistance, looking for a continuation towards $100 upside target.
RACE – 37 DTE
Bearish Debit Spread – We’re looking for a continuation lower towards our $400 support and a breakdown to the $390 downside target.
DailyPlay – Portfolio Review – June 11, 2024
DailyPlay Portfolio Review
Investment Rationale
Apple’s WWDC event seems to have disappointed investors looking for a knockout AI integration into iOS18. Spending only 2 mins on their partnership with OpenAI’s ChatGPT into Siri, AAPL sold off yesterday and opening up today even lower. Overall, it’s a step in the right direction, but AAPL remains behind their rivals on the software side for AI. As we turn towards the CPI print and the FOMC meeting later this week, let’s review our DailyPlay positions.
Our Trades
ADBE – 38 DTE
Bullish Credit Spread – Earnings are slated for Thursday PM and holding below $460 resistance at the moment, will consider closing before the earnings event.
DHI – 24 DTE
Bearish Debit Spread – Just sitting above $140 major support with poor relative performance, suggesting possible major breakdown.
HD – 66 DTE
Bearish Debit Spread – Trading just above its major $330 support/resistance level, we’re looking for further weakness towards a $305 downside target.
KR – 24 DTE
Bearish Debit Spread – Now within $1 of filling its gap at $50.60, with extended targets of $47 to the downside.
NKE – 10 DTE
Bullish Debit Spread – Has broken above $95 resistance, looking for a continuation towards the $100 upside target.
RACE – 38 DTE
Bearish Debit Spread – Still trading near the bottom end of the range and we’re looking for a break below towards a $390 downside target.
$DHI
DailyPlay – Opening Trade (DHI) – June 10, 2024
DHI Bearish Opening Trade Signal
Investment Rationale
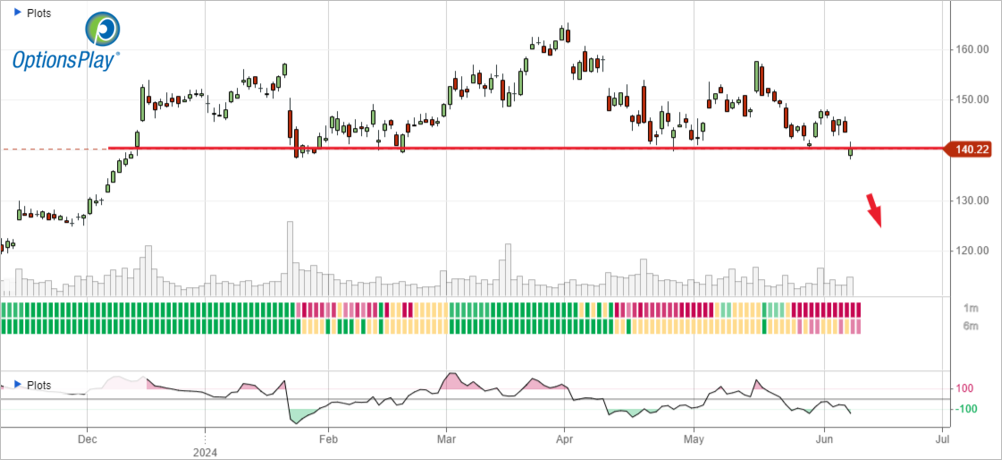
As homebuilder weakness continues, DHI is at risk of a major breakdown below its key $140 support that has held since Dec 2023. If we break below this level, targets are in the low $120’s. With it’s recent underperformance relative to its sector and market, suggests that weakness is ahead.
DHI – Daily
Trade Details
Strategy Details
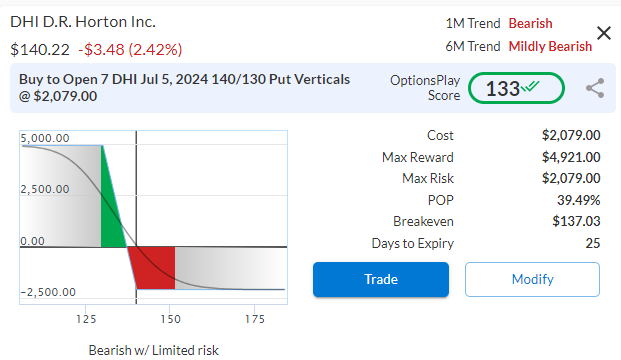
Strategy: Long Put Vertical Spread
Direction: Bearish Debit Spread
Details: Buy to Open 7 Contracts July 5th $140/$130 Put Vertical Spreads @ $2.97 Debit per Contract.
Total Risk: This trade has a max risk of $2,079 (7 Contracts x $297) based on a hypothetical $100,000 portfolio risking 2%. We suggest using 2% of your portfolio value and divide it by $297 to select the # contracts for your portfolio.
Trend Continuation Signal: This is a bearish trade on a stock that is trending lower.
1M/6M Trends: Bearish/Mildly Bearish
Relative Strength: 4/10
OptionsPlay Score: 133
Stop Loss: @ $1.49 Credit. (50% loss of premium paid)
View DHI Trade
Entering the Trade
Use the following details to enter the trade on your trading platform. Please note that whenever there is a multi-leg option strategy, it should be entered as a single trade.
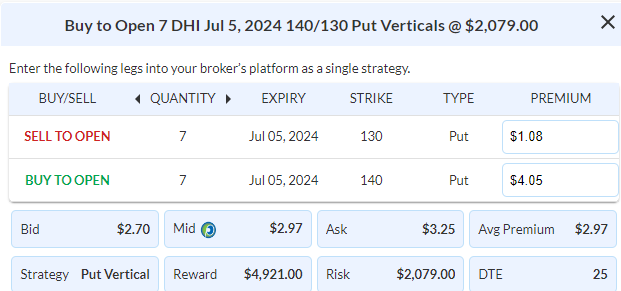
Please note that these prices are based on Wednesday’s closing prices. Should the underlying move significantly during the pre-market hours, we will likely adjust the strikes and prices to reflect a more accurate trade entry.
View DHI Trade
DailyPlay – Portfolio Review – June 7, 2024
DailyPlay Portfolio Review
Investment Rationale
As traders await the Jobs numbers this morning, equities are hovering just around all-time highs. We expect a bad news is good news type event where any weakness in job numbers would imply more room for the Fed to cut rates, providing a headwind for equities. We are taking a pause from adding additional exposure in our DailyPlay portfolio until we have more clarity around these economic numbers.
Our Trades
ADBE – 42 DTE
Bullish Credit Spread – We’re set up for a breakout above $460 going into earnings next week.
DHI – 28 DTE
Bearish Debit Spread – Weakness in housing continues as DHI fails to break higher and potentially retests $140 support.
HD – 70 DTE
Bearish Debit Spread – Just sitting above the $330 support level that we are targeting a break below.
KR – 28 DTE
Bearish Debit Spread – Weakness has continued and we are targeting the $50.50 gap fill as our initial downside target.
NKE – 14 DTE
Bullish Debit Spread – Bottoming formation is looking more constructive but yet to break out above $96.
RACE – 42 DTE
Bearish Debit Spread – Continues to remain rangebound, but a break above $423 would invalidate our thesis and require closing out.
$ADBE

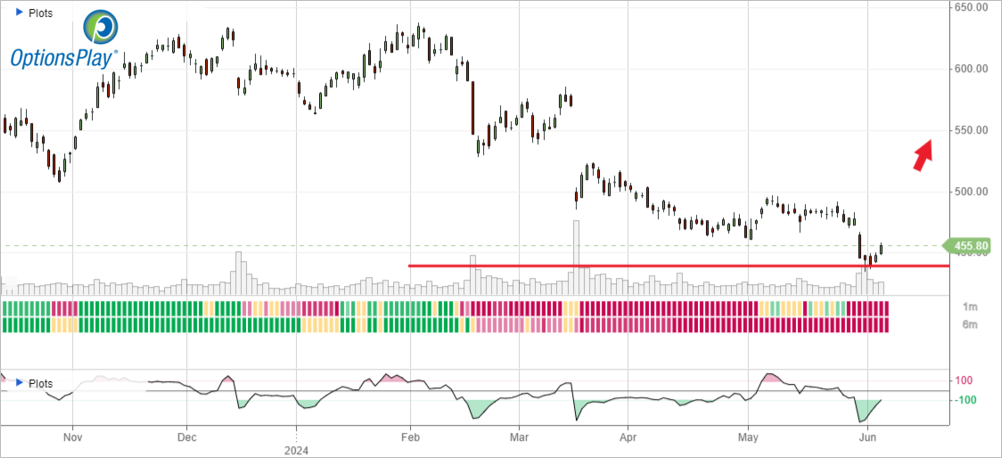
DailyPlay – Opening Trade (ADBE) – June 6, 2024
ADBE Bullish Opening Trade Signal
Investment Rationale
As we head into earnings for ADBE next week, we are taking a 3rd position on this stock in the last 2 months. We’re batting .500 so far and looking to improve on our win rate with an earnings play. Our investment thesis has not changed, Adobe is one of the few software plays that has an AI-related product that generates profits today. Expectations are for EPS to remain flat, but the stock is nearly 29% lower from its February peak, creating a significant upside opportunity going into an earnings catalyst.
Technical Analysis
After declining 29% over the past 4 months, ADBE has printed a new recent low that has been coupled with positive divergence (lower low in price, but higher low in momentum). This suggests that the selling has exhausted and the opportunity is now to the upside. Additionally, ADBE generated a Counter Trend buy signal yesterday and has outperformed the market since.
ADBE – Daily
Fundamental Analysis
ADBE trades at a very reasonable 25x forward earnings, especially when analysts expect the company to grow EPS and Revenues by 12-13% over the next few years and commands a very strong industry-leading 24% net margin. Since 2009, ADBE has only missed on earnings 3 times, so probabilities point to another beat this season.
Trade Details
Strategy Details
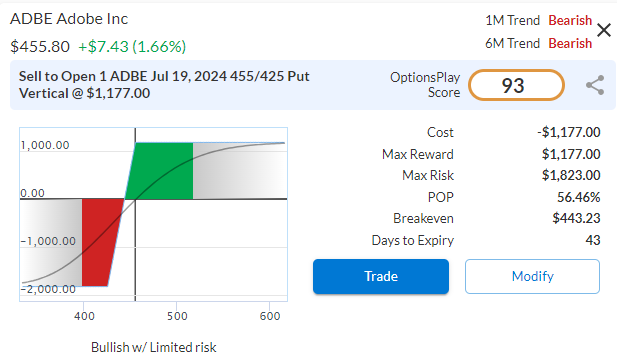
Strategy: Short Put Vertical Spread
Direction: Bullish Credit Spread
Details: Sell to Open 1 Contract July 19th $455/$425 Put Vertical Spread @ $11.77 Credit per Contract.
Total Risk: This trade has a max risk of $1,823 (1 Contract x $1,823) based on a hypothetical $100,000 portfolio risking 2%. We suggest using 2% of your portfolio value and divide it by $1,823 to select the # contracts for your portfolio.
Counter Trend Signal: This is a bullish trade on a stock that is expected to bounce higher off support.
1M/6M Trends: Bearish/Bearish
Relative Strength: 2/10
OptionsPlay Score: 93
Stop Loss: @ $23.54 Debit. (100% loss of premium received)
View ADBE Trade
Entering the Trade
Use the following details to enter the trade on your trading platform. Please note that whenever there is a multi-leg option strategy, it should be entered as a single trade.
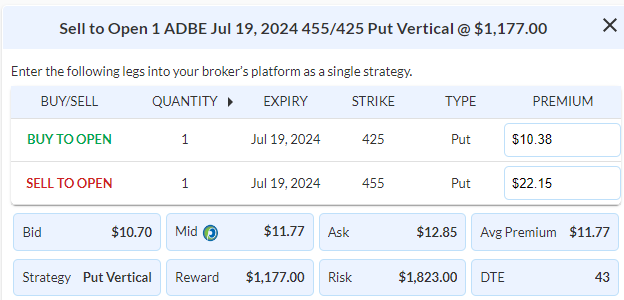
Please note that these prices are based on Wednesday’s closing prices. Should the underlying move significantly during the pre-market hours, we will likely adjust the strikes and prices to reflect a more accurate trade entry.
View ADBE Trade
$NKE
DailyPlay – Opening Trade (NKE) – June 5, 2024
NKE Bullish Opening Trade Signal
Investment Rationale
With NKE poised to break out above its $95 resistance level and head toward our $100 gap-fill target, let’s take this opportunity to add another 2% of our portfolio’s value to this trade.
NKE – Daily
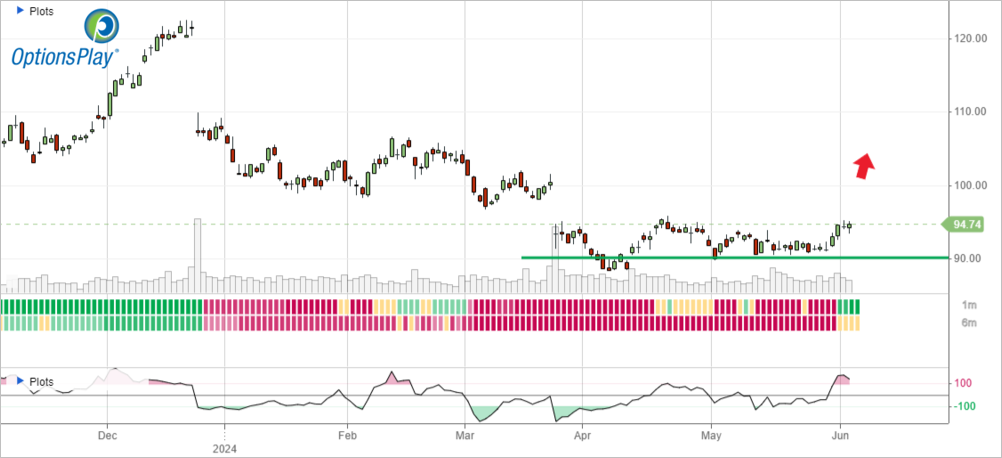
Trade Details
Strategy Details
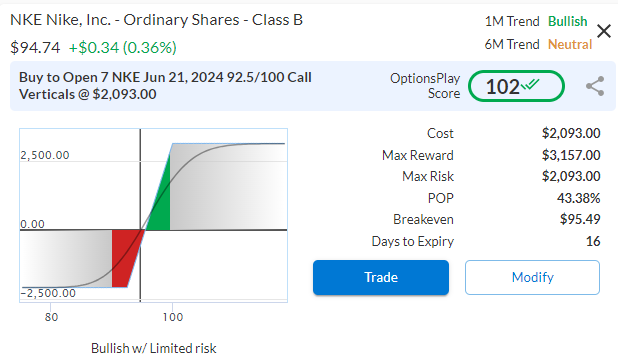
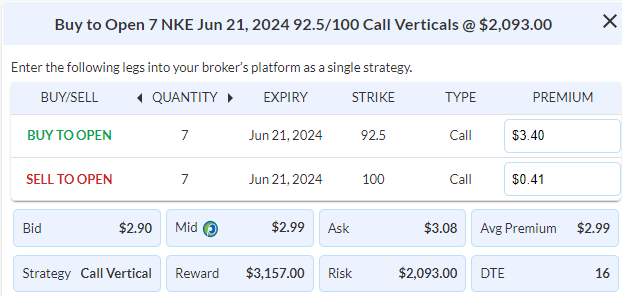
Strategy: Long Call Vertical Spread
Direction: Bullish Debit Spread
Details: Buy to Open 7 Contracts June 21st $92.50/$100 Call Vertical Spreads @ $2.99 Debit per Contract.
Total Risk: This trade has a max risk of $2,093 (7 Contracts x $299) based on a hypothetical $100,000 portfolio risking 2%. We suggest using 2% of your portfolio value and divide it by $299 to select the # contracts for your portfolio.
Trend Continuation Signal: This is a bullish trade on a stock that recently turned from neutral to bullish.
1M/6M Trends: Bullish/Neutral
Relative Strength: 2/10
OptionsPlay Score: 102
Stop Loss: @ $1.50 Credit. (50% loss of premium paid)
View NKE Trade
Entering the Trade
Use the following details to enter the trade on your trading platform. Please note that whenever there is a multi-leg option strategy, it should be entered as a single trade.
Please note that these prices are based on Tuesday’s closing prices. Should the underlying move significantly during the pre-market hours, we will likely adjust the strikes and prices to reflect a more accurate trade entry.
View NKE Trade
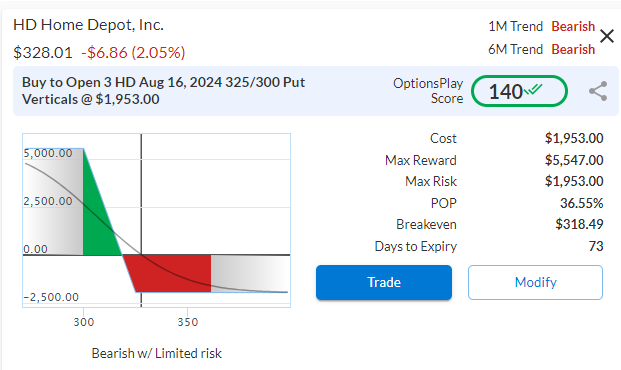
$HD
DailyPlay – Opening Trade (HD) – June 4, 2024
HD Bearish Opening Trade Signal
Investment Rationale
America’s largest Home Improvement store, HD has benefited from a long period of investor interest and traded at a premium valuation for years. However, the recent environment of slowing consumer spending and higher interest rates has finally caught up with it and risks are to the downside below $300.
Technical Analysis
After a rally towards its all-time highs just shy of $400, HD has pulled back below its key $350 support level and now tests its $325 support and a risk of breaking lower. As the relative performance of HD reached a new 52-week low recently, it suggests that there are still further downside risks with targets the next support lower just below $300.
HD – Daily
Fundamental Analysis
Trading at 21x forward earnings, HD is still trading at a premium given the fact that analysts are only expecting EPS and Revenue to grow at low single-digit levels and net margins sit below 10%. The reality is that with margins that are relatively thin and consumer spending further slowing down, HD cannot command the same type of premium valuation relative to the market.
Trade Details
Strategy Details
Strategy: Long Put Vertical Spread
Direction: Bearish Debit Spread
Details: Buy to Open 3 Contracts Aug 16th $325/$300 Put Vertical Spreads @ $6.51 Debit per Contract.
Total Risk: This trade has a max risk of $1,953 (3 Contracts x $651) based on a hypothetical $100,000 portfolio risking 2%. We suggest using 2% of your portfolio value and divide it by $651 to select the # contracts for your portfolio.
Trend Continuation Signal: This is a bearish trade on a stock that recently turned bearish.
1M/6M Trends: Bearish/Bearish
Relative Strength: 4/10
OptionsPlay Score: 140
Stop Loss: @ $3.25 Credit. (50% loss of premium paid)
View HD Trade
Entering the Trade
Use the following details to enter the trade on your trading platform. Please note that whenever there is a multi-leg option strategy, it should be entered as a single trade.

Please note that these prices are based on Monday’s closing prices. Should the underlying move significantly during the pre-market hours, we will likely adjust the strikes and prices to reflect a more accurate trade entry.
View HD Trade
$PLTR
DailyPlay – Closing Trade (PLTR) – June 3, 2024
Closing Trade
- PLTR – 42.50% loss: Sell to Close 13 Contracts (or 100% of your Contracts) June 21st $22/$18 Put Vertical Spreads @ $0.92 Credit. DailyPlay Portfolio: By Closing all 13 Contracts, we will receive $1,196. We opened these 13 Contracts on May 1 @ $1.60 Debit. The average loss, therefore, is $68.
Investment Rationale
With the news of PLTR signing a new significant contract with Eaton it has now held its $20 major support level and the probability of it hitting our $18 target in the next 3 weeks is slim. It is time to cut this earnings play.