
$ADBE

DailyPlay – Closing Trade (ADBE) – May 31, 2024
Closing Trade
- ADBE – 93.32% loss: Buy to Close 1 Contract (or 100% of your Contracts) June 21st $460/490 Put Vertical Spread @ $21.42 Debit. DailyPlay Portfolio: By Closing this 1 Contract, we will pay $2,142. We opened this 1 Contract on May 7 @ $11.12 Credit. As we rolled ADBE from a previous trade where we gained $536 with a return of 69% the loss is therefore $494.
$DHI

DailyPlay – Opening Trade (DHI) – May 30, 2024
DHI Bearish Opening Trade Signal
Investment Rationale
As many major consumer names trade closer to their 52-week lows as equity markets print new all-time highs, there are growing risks that the consumer is weaker than the economy suggests. One industry that is adjacent to discretionary is home builders. Recently, weakness in the home builders suggests that it may be heading in the direction of the discretionary sector and presents an opportunity to add short exposure in DHI.
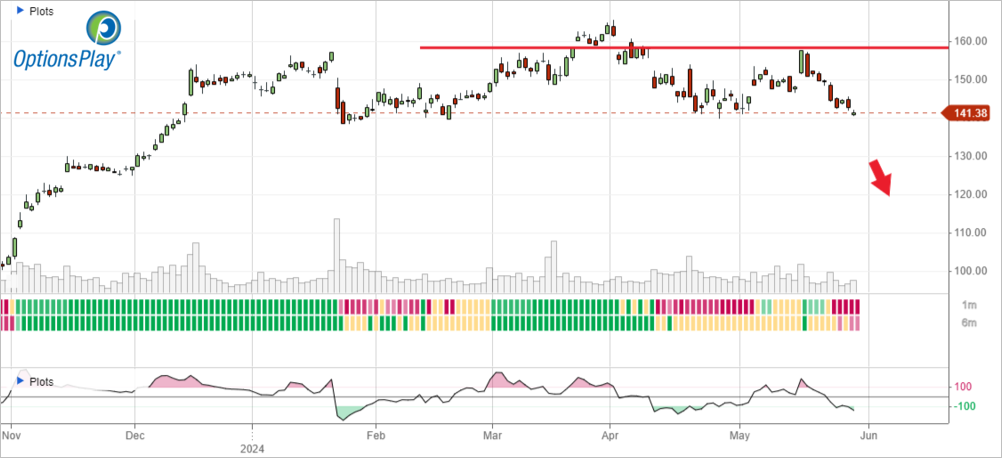
Technical Analysis
If we look at XHB, the Home Builders ETF, we see that it has continued to trade in a range between $100 and $110 over the past 4 months, however, the relative performance of XHB to the S&P 500 has started to underperform recently. This suggests that XHB is likely to revisit the bottom of the trading range and potentially break below it. And if we look at DR Horton (DHI) the largest of the home builders, it has recently traded in a similar range between $140 and $160 over the past 6 months, but the relative performance to its industry is poor and near its 52-week lows. This weakness suggests that it will revisit the $140 support level and potentially break lower, especially as momentum has recently turned negative.
DHI – Daily
Fundamental Analysis
Now, looking at the business, DHI trades at 10.5x forward earnings, which is the upper bound of its historical average over the past 5 years. With some of the slowest expected EPS growth of only 4% among its peers, these valuations start to look expensive as 10-year yields climb above 4.6% again.
Trade Details
Strategy Details
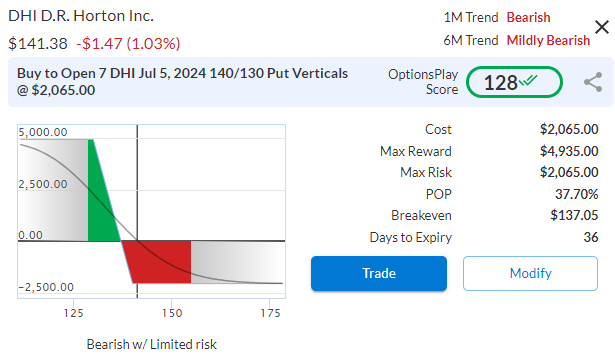
Strategy: Long Put Vertical Spread
Direction: Bearish Debit Spread
Details: Buy to Open 7 Contracts July 5th $140/$130 Put Vertical Spreads @ $2.95 Debit per Contract.
Total Risk: This trade has a max risk of $2,065 (7 Contracts x $295) based on a hypothetical $100,000 portfolio risking 2%. We suggest using 2% of your portfolio value and divide it by $295 to select the # contracts for your portfolio.
Trend Continuation Signal: This is a bearish trade on a stock that recently turned bearish.
1M/6M Trends: Bearish/ Mildly Bearish
Relative Strength: 6/10
OptionsPlay Score: 128
Stop Loss: @ $1.48 Credit. (50% loss of premium paid)
View DHI Trade
Entering the Trade
Use the following details to enter the trade on your trading platform. Please note that whenever there is a multi-leg option strategy, it should be entered as a single trade.
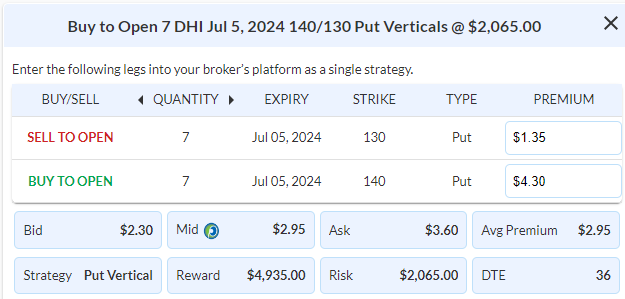
Please note that these prices are based on Wednesday’s closing prices. Should the underlying move significantly during the pre-market hours, we will likely adjust the strikes and prices to reflect a more accurate trade entry.
View DHI Trade
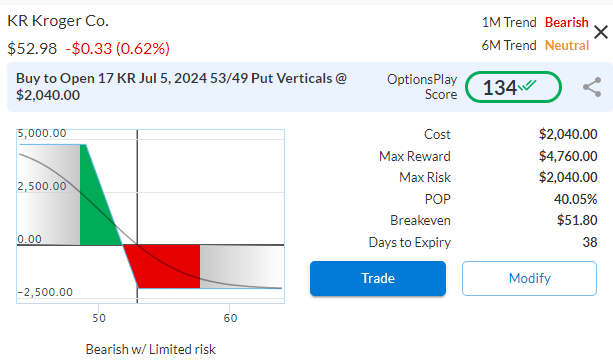
$KR
DailyPlay – Opening Trade (KR) – May 28, 2024
KR Bearish Opening Trade Signal
Investment Rationale
As consumer stocks continue to underperform, supermarkets are notorious for operating on razor-thin margins. Kroger recently had a few months of stellar performance that pushed its valuation to well beyond its historical averages but is now at risk of a pullback.
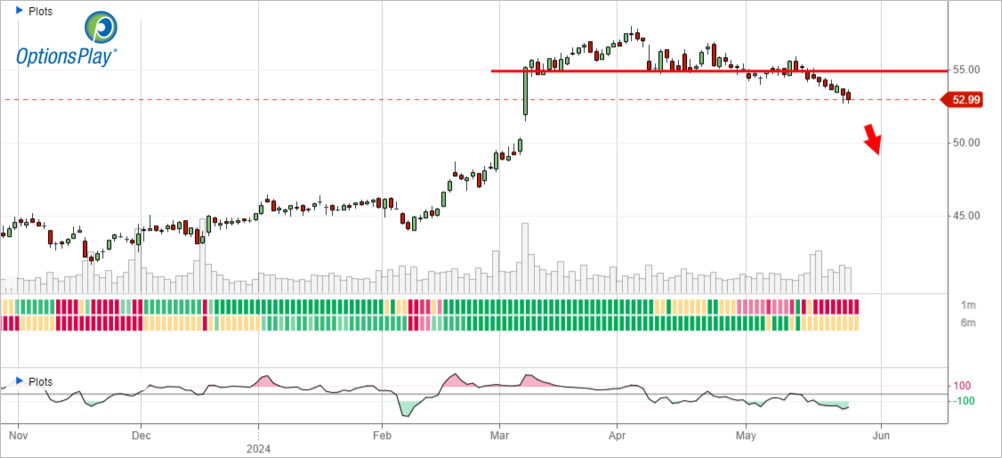
Technical Analysis
After a period of outperformance starting in Feb, KR has quickly reversed those gains and started to break below its key $54-55 support area along with strong underperformance. As momentum turns negative, KR looks set to close its gap at $50 and potentially revisit $46 extended downside targets.
KR – Daily
Fundamental Analysis
Operating on razor-thin margins of 2%, KR’s 1% revenue growth that’s expected is not compelling considering its higher-than-average valuation. Trading at 12x forward earnings, KR is trading at a premium relative to itself and peers and at risk of multiple compressions.
Trade Details
Strategy Details
Strategy: Long Put Vertical Spread
Direction: Bearish Debit Spread
Details: Buy to Open 17 Contracts July 5th $53/$49 Put Vertical Spreads @ $1.20 Debit per Contract.
Total Risk: This trade has a max risk of $2,040 (17 Contracts x $120) based on a hypothetical $100,000 portfolio risking 2%. We suggest using 2% of your portfolio value and divide it by $120 to select the # contracts for your portfolio.
Trend Continuation Signal: This is a bearish trade on a stock that recently turned bearish.
1M/6M Trends: Bearish/Neutral
Relative Strength: 7/10
OptionsPlay Score: 134
Stop Loss: @ $0.60 Credit. (50% loss of premium paid)
View KR Trade
Entering the Trade
Use the following details to enter the trade on your trading platform. Please note that whenever there is a multi-leg option strategy, it should be entered as a single trade.
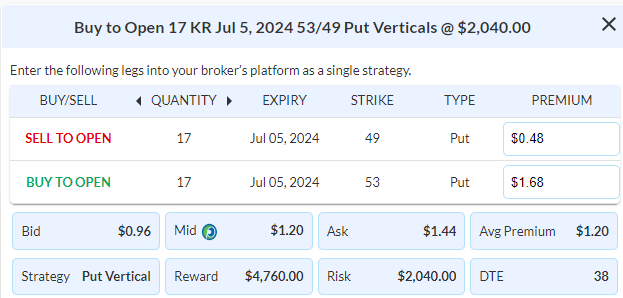
Please note that these prices are based on Friday’s closing prices. Should the underlying move significantly during the pre-market hours, we will likely adjust the strikes and prices to reflect a more accurate trade entry.
View KR Trade
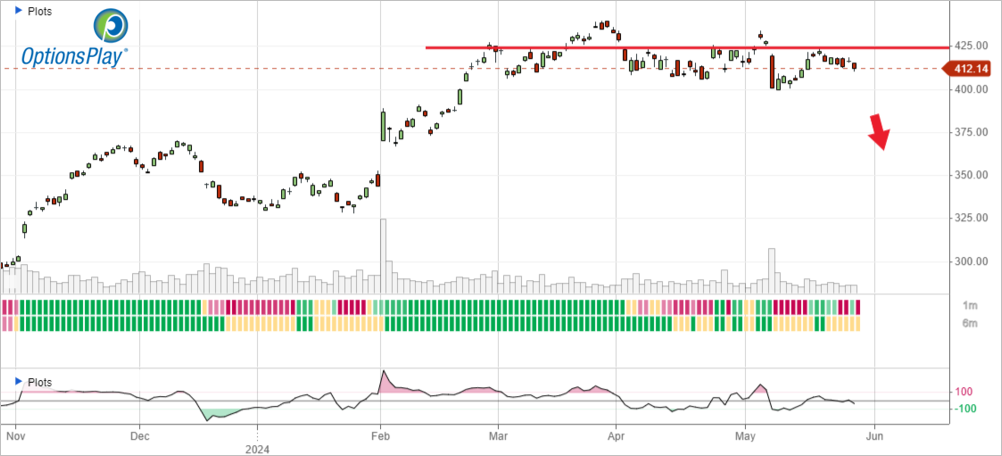
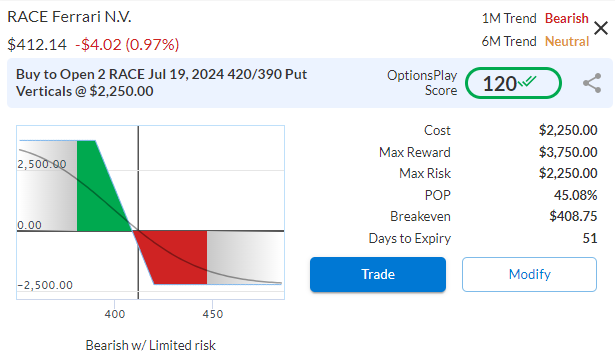
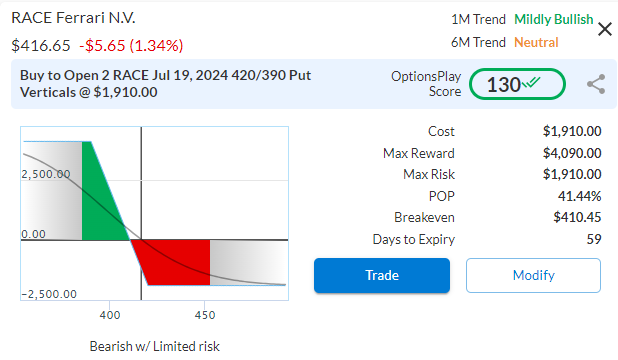
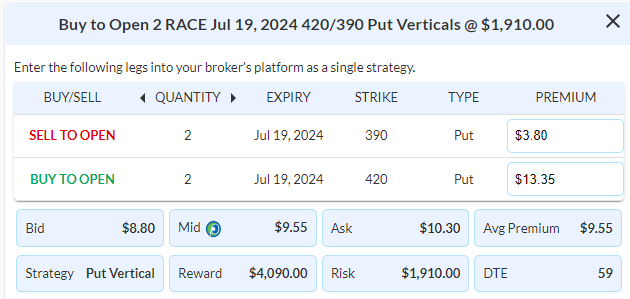
$RACE
DailyPlay – Opening Trade (RACE) – May 29, 2024
RACE Bearish Opening Trade Signal
Investment Rationale
As Ferrari continues to print lower highs and lower lows with momentum turning negative, our position has finally swung into the green. Here is an opportunity for us to add some additional exposure as stocks start to turn lower in this higher interest environment. Still trading at over 49x forward earnings, RACE is at risk of a larger fall than many others. Look to add another 2% of our portfolio’s value to this bearish trade today.
RACE – Daily
Trade Details
Strategy Details
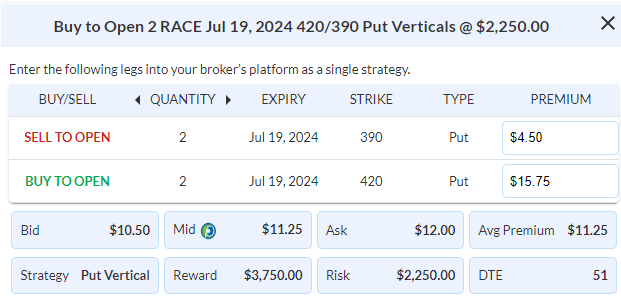
Strategy: Long Put Vertical Spread
Direction: Bearish Debit Spread
Details: Buy to Open 2 Contracts July 19th $420/$390 Put Vertical Spreads @ $11.25 Debit per Contract.
Total Risk: This trade has a max risk of $2,250 (2 Contracts x $1,125) based on a hypothetical $100,000 portfolio risking 2%. We suggest using 2% of your portfolio value and divide it by $1,125 to select the # contracts for your portfolio.
Trend Continuation Signal: This is a bearish trade on a stock that recently turned bearish.
1M/6M Trends: Bearish/Neutral
Relative Strength: 6/10
OptionsPlay Score: 120
Stop Loss: @ $5.63 Credit. (50% loss of premium paid)
View RACE Trade
Entering the Trade
Use the following details to enter the trade on your trading platform. Please note that whenever there is a multi-leg option strategy, it should be entered as a single trade.
Please note that these prices are based on Tuesday’s closing prices. Should the underlying move significantly during the pre-market hours, we will likely adjust the strikes and prices to reflect a more accurate trade entry.
View RACE Trade

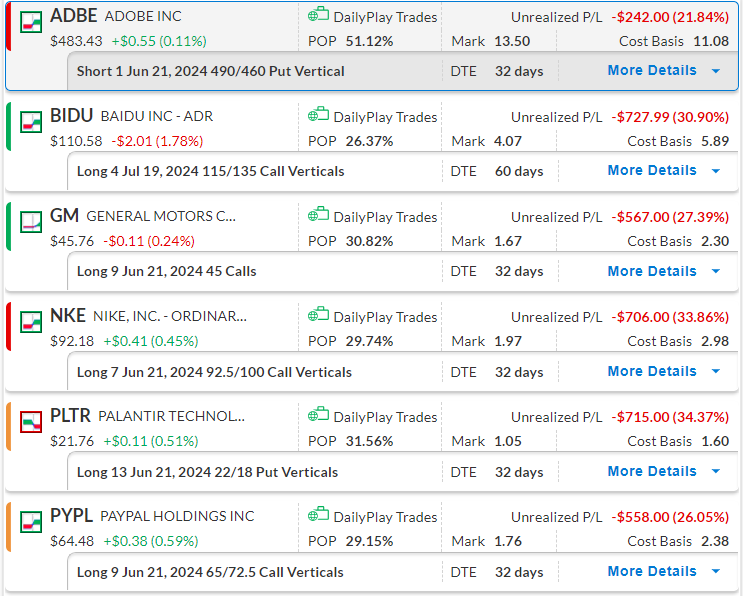
DailyPlay – Portfolio Review – May 24, 2024
DailyPlay Portfolio Review
Our Trades
ADBE – 28 DTE
Bullish Credit Spread – ADBE continues to trade within a tight range but remains just near our breakeven and at least 1 more week before it warrants rolling.
NKE – 28 DTE
Bullish Debit Spread – We are keeping a close eye on this position and a break below $90 would warrant closing this position.
PLTR – 28 DTE
Bearish Debit Spread – PLTR also moved in our favor yesterday and a break below $20.50 seems likely.
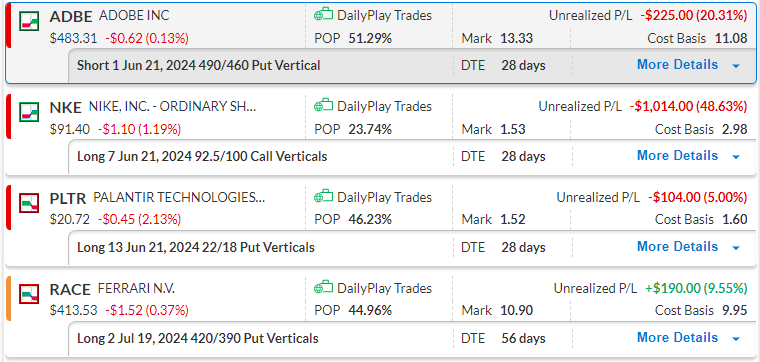
RACE – 56 DTE
Bearish Debit Spread – RACE has gained more traction and is almost at 10% gain.
$PYPL
DailyPlay – Portfolio Review & Closing Trade (PYPL) – May 23, 2024
Closing Trade
- PYPL – 63.87% loss: Sell to Close 9 Contracts (or 100% of your Contracts) June 21st $65/$72.50 Call Vertical Spreads @ $0.86 Credit. DailyPlay Portfolio: By Closing all 9 Contracts, we will receive $774. We opened these 9 Contracts on April 23 @ $2.38 Debit. The average loss, therefore, is $152.
DailyPlay Portfolio Review
Investment Rationale
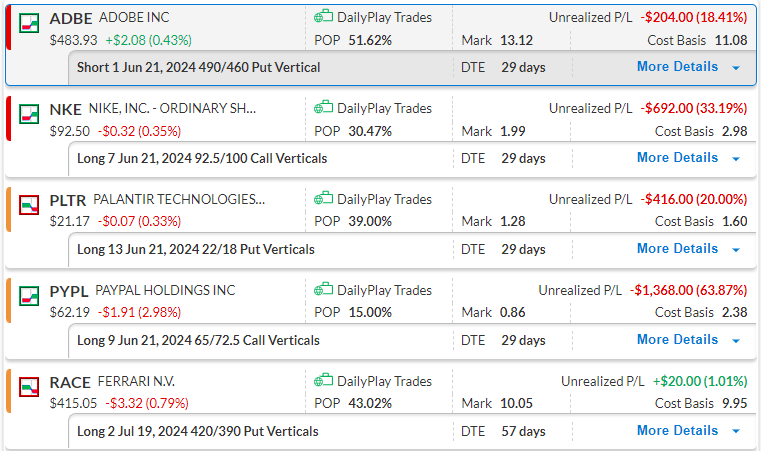
As equity markets rally today on the back of NVDA earnings, we continue to monitor our DailyPlay portfolio for alerts to cut losses and manage the trades. PYPL crossed below a key support level yesterday and requires us to close out the position, while our PLTR, RACE and ADBE positions improved yesterday. We will continue to monitor our portfolio for new opportunities and adjustments.
Our Trades
ADBE – 29 DTE
Bullish Credit Spread – ADBE traded above $480 support during all trading sessions this week, and a break higher is therefore likely.
NKE – 29 DTE
Bullish Debit Spread – Support around $90 is holding and a move higher should ideally happen within the next few trading days, to support our bullish thesis.
PLTR – 29 DTE
Bearish Debit Spread – Trends remain bearish and a break below $20.50 would likely fill the gap toward $18.
PYPL – 29 DTE
Bullish Debit Spread – As support at $63 failed, we are closing this position today.
RACE – 57 DTE
Bearish Debit Spread – RACE gained over a percentage point since we opened this bearish trade. Our first price target is $400.
$BIDU. $GM
DailyPlay – Closing Trades (BIDU, GM) – May 22, 2024
Closing Trades
- BIDU – 59.42% loss: Sell to Close 4 Contracts (or 100% of your Contracts) July 19th $115/$135 Call Vertical Spreads @ $2.39 Credit. DailyPlay Portfolio: By Closing all 4 Contracts, we will receive $956. We opened these 4 Contracts on May 6 @ $5.89 Debit. The average loss, therefore, is $350.
- GM – 51.30% loss: Sell to Close 9 Contracts (or 100% of your Contracts) June 21 $45 Calls @ $1.12 Credit. DailyPlay Portfolio: By Closing all 9 Contracts, we will receive $1,008. We opened these 9 Contracts on April 26 @ $2.30 Debit. The average loss, therefore, is $118.
Investment Rationale
I want to address our current DailyPlay portfolio which holds 6 unrealized losing positions. Understandably, this has raised questions and is a learning opportunity for every trader. We have not been in such a position since the March 2020 selloff and our realized profits records speak for themselves. However, every trader will come across a point where you are faced with a series of consecutive losses. The short answer is that the best course of action is to stick with our Stop Loss rules and continue trading. We are only able to afford this if we followed the rules for position sizing when we entered these trades. The all-important 2% rule which is included with every trade signal ensures that even when you are faced with a series of losses, you are able to survive them and emerge on the other end and continue trading. Even if all 6 positions triggered their stop loss levels it would only result in a 6% drawdown in our portfolio. As we review our DailyPlay portfolio, BIDU and GM triggered their stop loss levels yesterday and require us to close those out.
To review the 2% rule and how we build a profitable portfolio, please review my recent webinar on this topic, by clicking HERE.
$RACE
DailyPlay – Opening Trade (RACE) – May 21, 2024
RACE Bearish Opening Trade Signal
Investment Rationale
The popularity of Formula 1 can’t be overstated these days, but my favorite racing team Ferrari is expensive and I’m concerned that it’s due for a pullback in this environment. Ferrari has rallied over 25% this year after posting better-than-expected earnings, but this rally is starting to look overdone and I think it’s at risk of trading lower.
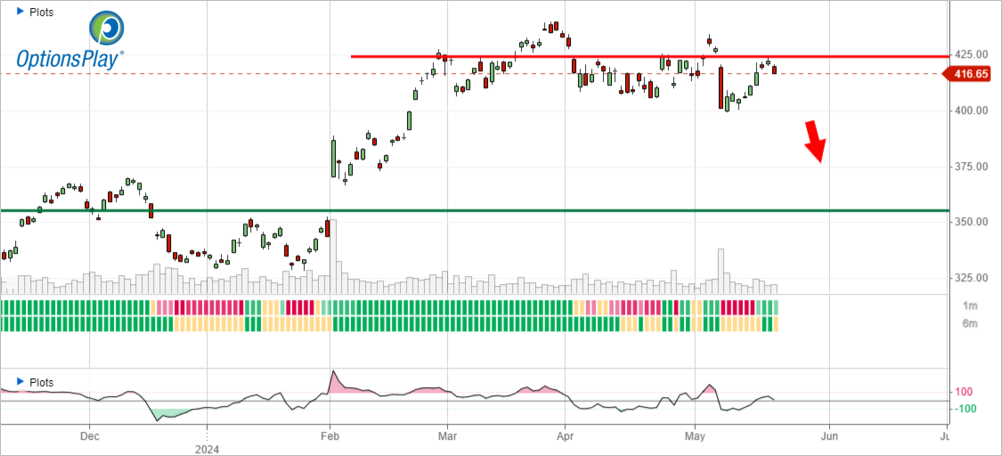
Technical Analysis
The stock has rallied 25% this year so far, more than double what the S&P 500 has returned. However, there are classic signs of a potential bullish to bearish reversal. Firstly we have what looks like a head and shoulders reversal pattern that has completed with a neckline at $410. This would indicate a potential reversal to fill the gap at $355 (a 13.6% decline). This is coupled with relative underperformance to the market, a signal for potential weakness ahead, and MACD remains negative for RACE.
RACE – Daily
Fundamental Analysis
What’s interesting about Ferrari’s business is how resilient the ultra-luxury market has been to recent downturns. This is part of why RACE has continued to command a premium valuation relative to its peers. However, 48x forward earnings are simply detached from reality when EPS is expected to grow at 15% over the next few years. That’s a valuation that is nearly 140% higher than the average S&P 500 stock.
Trade Details
Strategy Details
Strategy: Long Put Vertical Spread
Direction: Bearish Debit Spread
Details: Buy to Open 2 July 19th $420/$390 Put Vertical Spreads @ $9.55 Debit per Contract.
Total Risk: This trade has a max risk of $1,910 (2 Contracts x $955) based on a hypothetical $100,000 portfolio risking 2%. We suggest using 2% of your portfolio value and divide it by $955 to select the # contracts for your portfolio.
Counter Trend Signal: This is a bearish trade on a stock that is over-bought and expected to pull back from recent highs.
1M/6M Trends: Mildly Bullish /Neutral
Relative Strength: 6/10
OptionsPlay Score: 130
Stop Loss: @ $4.78 Credit. (50% loss of premium paid)
View RACE Trade
Entering the Trade
Use the following details to enter the trade on your trading platform. Please note that whenever there is a multi-leg option strategy, it should be entered as a single trade.
Please note that these prices are based on Monday’s closing prices. Should the underlying move significantly during the pre-market hours, we will likely adjust the strikes and prices to reflect a more accurate trade entry.
View RACE Trade
DailyPlay – Portfolio Review – May 20, 2024
DailyPlay Portfolio Review
Investment Rationale
As equities continue its grind higher, we remain positioned in our DailyPlay Portfolio for further upside. With all positions currently with an unrealized loss, we are taking this time to be patient as we are long-time decay but have plenty of time left in all of our positions.
Our Trades
ADBE – 32 DTE
Bullish Credit Spread – ADBE traded above $480 support over the last two trading sessions, and a break higher is therefore likely.
BIDU – 60 DTE
Bullish Debit Spread – Again trading above $110 and an upside move should target $120.
GM – 32 DTE
Bullish Calls – Completed a bullish pennant and a break higher seems likely.
NKE – 32 DTE
Bullish Debit Spread – Support around $90 is holding and a move higher should ideally happen within the next few trading days, to support our bullish thesis.
PLTR – 32 DTE
Bearish Debit Spread – Trends remain bearish and resistance at $22 is still holding.
PYPL – 32 DTE
Bullish Debit Spread – With the price remaining above $63, a move higher is still possible. However, we will closely monitor this trade as increased strength is needed for a move higher.
$CRM
DailyPlay – Closing Trade (CRM) – May 17, 2024
Investment Rationale
Markets have continued to provide a risk-on signal after this week’s CPI print and our CRM position has now rallied above the $280 major resistance level that we wanted to see hold. Despite not yet triggering our stop loss levels we believe it is best to cut this position at the moment and not hold onto a bearish position in this market where time decay is working against us.
Closing Trade
- CRM – 30.81% loss: Sell to Close 4 Contracts (or 100% of your Contracts) June 21st $270/$250 Put Vertical Spreads @ $4.02 Credit. DailyPlay Portfolio: By Closing all 4 Contracts, we will receive $1,608. We opened these 4 Contracts on May 13 @ $5.81 Debit. The average loss, therefore, is $179.