
$CRWD

DailyPlay – Opening Trade (CRWD) – September 27, 2023
CRWD Bullish Opening Trade Signal
View CRWD Trade
Strategy Details
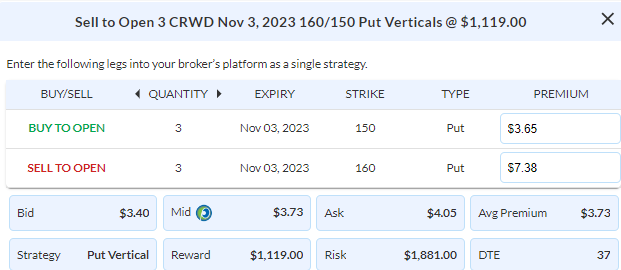
Strategy: Short Put Vertical Spread
Direction: Bullish
Details: Sell to Open 3 Contracts Nov 3rd $160/$150 Put Vertical Spreads @ $3.73 Credit per contract.tract.
Total Risk: This trade has a max risk of $1,881 (3 Contracts x $627) based on a hypothetical $100,000 portfolio risking 2%. We suggest using 2% of your portfolio value and divide it by $627 to select the # shares for your portfolio.
Trend Continuation Signal: This is a bullish trade on a stock that is expected to continue higher.
1M/6M Trends: Neutral/Bullish
Technical Score: 10/10
OptionsPlay Score: 90
Stop Loss: @ $7.50 Debit (100% loss).
Entering the Trade
Use the following details to enter the trade on your trading platform. Please note that whenever there is a multi-leg option strategy, it should be entered as a single trade.
Please note that these prices are based on Tuesday’s closing prices. Should the underlying move significantly during the pre-market hours, we will likely adjust the strikes and prices to reflect a more accurate trade entry.
Investment Rationale
The bond market selloff has started to reach oversold and exhausted levels that suggest we are in for a bounce. The question is how far? With 10-year yields now firmly above 4.3%, in my opinion, we may see a shallow bounce in equities and bonds, but the economic headwinds remain. Higher oil prices are denting consumer confidence, and higher rates are pushing equity valuations lower. The real risk is if the bond market has to reprice its current expectations of rate cuts by next year. In that scenario, equity markets will have to sell off further to account for higher rates for longer. While I expect a bounce over the next few trading sessions, I believe that bounce is an opportunity to seek further downside exposure rather than a buying opportunity.
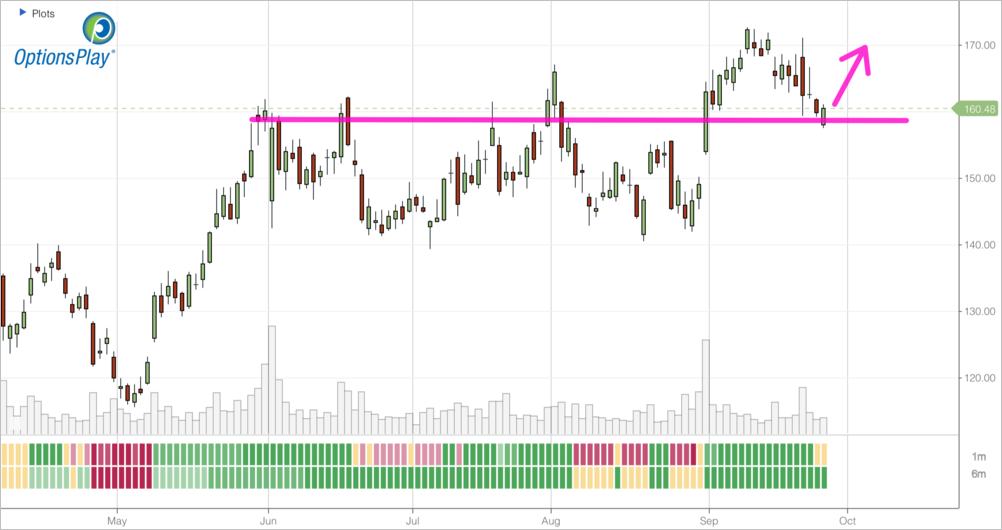
To play for a short-term tactical bounce, I’m choosing to favor profitable, high-margin momentum plays such as CRWD. Cybersecurity remains one of the fastest-growing industries within software as geopolitical tensions rise. With its recent pullback to its $160 support level, I’m looking to sell the Nov 3 $160/$150 Put Vertical @ $3.73 Credit. With a hypothetical portfolio of $100,000, I recommend risking 2% of the portfolio’s value to this trade, which is 3 Contracts for a risk of $1,881. We will set a stop loss on the put spread at 100% of the premium collected @ $7.50 Debit.
CRWD – Daily
$TXN

DailyPlay – Opening Trade (TXN) – September 26, 2023
TXN Bearish Opening Trade Signal
View TXN Trade
Strategy Details
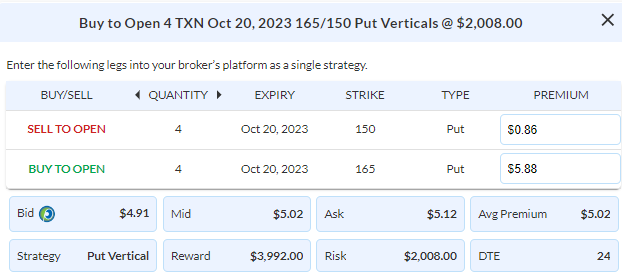
Strategy: Long Put Vertical Spread
Direction: Bearish
Details: Buy to Open 4 Contracts Oct 20th $165/$150 Put Vertical Spreads @ $5.02 Debit per contract.
Total Risk: This trade has a max risk of $2,008 (4 Contracts x $502) based on a hypothetical $100,000 portfolio risking 2%. We suggest using 2% of your portfolio value and divide it by $502 to select the # shares for your portfolio.
Trend Continuation Signal: This is a bearish trade on a stock that broke below an area of support.
1M/6M Trends: Bearish/Bearish
Technical Score: 3/10
OptionsPlay Score: 130
Stop Loss: @ $2.50 Credit (50% loss).
Entering the Trade
Use the following details to enter the trade on your trading platform. Please note that whenever there is a multi-leg option strategy, it should be entered as a single trade.
Please note that these prices are based on Thursday’s closing prices. Should the underlying move significantly during the pre-market hours, we will likely adjust the strikes and prices to reflect a more accurate trade entry.
Investment Rationale
As 10-year yields continue to climb to decade highs, stocks with rich valuations are at the highest risk of a pullback as equities weaken. One of our positions TXN has now broken below it major support level of $160 and at risk of reversing lower toward its $144 52-week lows. We are going to take this opportunity now to add further exposure to the TXN position. We have already taken profits on our initial position and currently own the Oct $165/$150 Put Vertical and suggest that we add another 2% of our portfolio risk to this position. With a hypothetical portfolio of $100,000, 2% of the portfolio’s value would equate to 4 more Contracts. We will set a stop loss on the put spread at 50% of the premium paid @ $2.50 Credit.
$RCL
DailyPlay – Opening Trade (RCL) Closing Trade (KEY) – September 25, 2023
Closing Trade
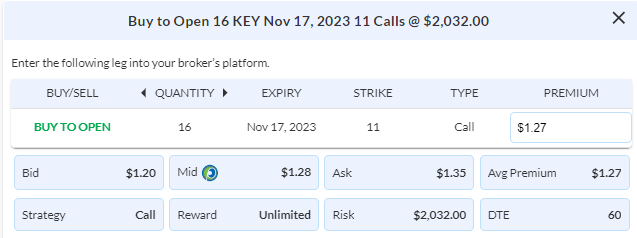
- KEY – 55.12% Loss: Sell to Close 16 Contracts (or 100% of your Contracts) Nov 17th $11 Calls @ $0.57 Credit. DailyPlay Portfolio: By Closing all 16 Contracts, we will receive $912. We initially opened these 16 Contracts on September 18 @ $1.28 Debit. Our average loss, therefore, is $71 per contract.
RCL Bearish Opening Trade Signal
View RCL Trade
Strategy Details
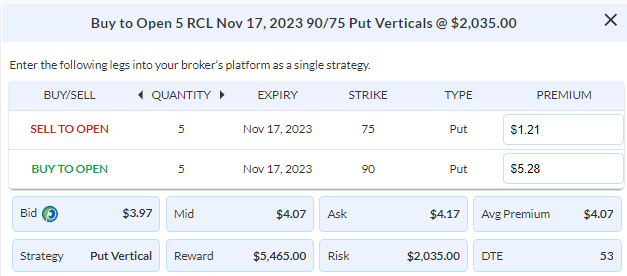
Strategy: ong Put Vertical Spread
Direction: Bearish
Details: Buy to Open 5 Contracts Nov 17th $90/$75 Put Vertical Spreads @ $4.07 Debit per contract.
Total Risk: This trade has a max risk of $2,035 (5 Contracts x $407) based on a hypothetical $100,000 portfolio risking 2%. We suggest using 2% of your portfolio value and divide it by $407 to select the # shares for your portfolio.
Trend Continuation Signal: This is a bearish trade on a stock that has reached a point of exhaustion and is expected to continue lower.
1M/6M Trends: Bearish/Neutral
Technical Score: 10/10
OptionsPlay Score: 136
Stop Loss: @ $2.00 Credit (50% loss).
Entering the Trade
Use the following details to enter the trade on your trading platform. Please note that whenever there is a multi-leg option strategy, it should be entered as a single trade.
Please note that these prices are based on Friday’s closing prices. Should the underlying move significantly during the pre-market hours, we will likely adjust the strikes and prices to reflect a more accurate trade entry.
Investment Rationale
With the S&P 500 closing at its lowest level in over 2 months, it is at risk of completing a topping formation that puts $4100 to the downside in our sights. This week represents an important week for bulls to take control of not only equities but also bonds. With the 10-year yields breaking out above the 4.3% double top puts equity valuations into question. If we see yields remain elevated above 4.3%, the S&P will likely be pressured lower below its key $4300 level towards $4100. We need to manage positions in our portfolio by closing out the full position in KEY, after hitting our stop loss level.
At the same time I’m going to seek downside exposure in the travel industry with RCL. After rallying nearly 250% over the past year, RCL is starting to show some cracks after breaking below its key support of $95-97. The breakdown targets $75 to the downside and we can potentially profit from that by buying the Nov $90/75 Put Vertical @ $4.07 Debit. With a hypothetical portfolio of $100,000, I recommend risking 2% of the portfolio’s value to this trade, which is 5 Contracts for a risk of $2,035. We will set a stop loss on the put spread at 50% of the premium paid @ $2.00 Credit.
$SBUX
DailyPlay – Opening Trade (SBUX) – Closing Trades (SBUX, FCX) – September 22, 2023
Closing Trades
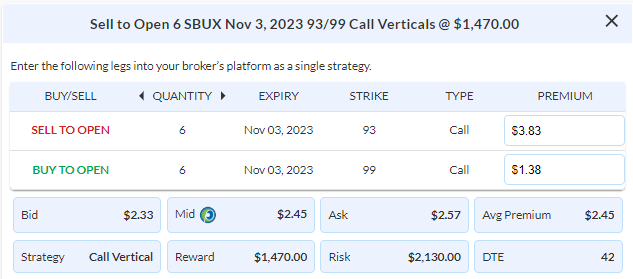
- SBUX – 60.50% Gain: Buy to Close 7 Contracts (or 100% of your Contracts) Oct 27th $97/$102 Call Vertical Spreads @ $0.79 Debit. DailyPlay Portfolio: By Closing all 7 Contracts, we will pay $553. We initially opened these 7 Contracts @ $2.00 Credit. Our average gain, therefore, is $353 per contract.
- FCX – 52.89% Loss: Sell to Close 8 Contracts (or 100% of your Contracts) Oct 20th $38/$45 Call Vertical Spreads @ $1.14 Credit. DailyPlay Portfolio: By Closing all 8 Contracts, we will receive $912. We initially opened these 8 Contracts on August 22 @ $2.32 Debit. Our average loss, therefore, is $118 per contract.
SBUX Bearish Opening Trade Signal
View SBUX Trade
Strategy Details
Strategy: Short Call Vertical Spread
Direction: Bearish
Details: Sell to Open 6 Contracts Nov 3rd $93/$99 Call Vertical Spreads @ $2.45 Credit per contract.
Total Risk: This trade has a max risk of $2,130 (6 Contracts x $355) based on a hypothetical $100,000 portfolio risking 2%. We suggest using 2% of your portfolio value and divide it by $355 to select the # shares for your portfolio.
Trend Continuation Signal: This stock is in a bearish trend and is expected to continue lower.
1M/6M Trends: Bearish/Bearish
Technical Score: 4/10
OptionsPlay Score: 103
Stop Loss: @ $5.00 Debit (100% loss).
Entering the Trade
Use the following details to enter the trade on your trading platform. Please note that whenever there is a multi-leg option strategy, it should be entered as a single trade.
Please note that these prices are based on Thursday’s closing prices. Should the underlying move significantly during the pre-market hours, we will likely adjust the strikes and prices to reflect a more accurate trade entry.
Investment Rationale
With the recent sharp rise in yields, equity valuations have come under pressure. The S&P has closed just at its major support level of $4330 and bulls need to hold this level to keep markets in a neutral trend, otherwise a break below turns bearish and targets $4100 to the downside. This requires us to close out our full FCX position, which has reached its stop loss level. Additionally, SBUX has reached our take profit level and we need to roll it lower to seek further bearish exposure now that its $95 support level has been broken. Roll to Nov 3 $93/$99 Call Vertical @ $2.45 Credit. With a hypothetical portfolio of $100,000, I recommend risking 2% of the portfolio’s value to this trade, which is 6 Contracts for a risk of $2,130. We will set a stop loss on the put spread at 100% of the premium collected @ $5.00 Debit.
$AMT

DailyPlay – Closing Trade (AMT) – September 21, 2023
Closing Trade
- AMT – 42.97% Loss: Sell to Close 4 Contracts (or 100% of your Contracts) Oct 20th $180/$195 Call Vertical Spreads @ $2.92 Credit. DailyPlay Portfolio: By Closing all 4 Contracts, we will receive $1,168. We initially opened these 4 Contracts on August 24 @ $4.85 Debit. Our average gain, therefore, is $193 per contract.
Investment Rationale
The market’s reaction to the FOMC meeting and Chairman Powell’s testimony is challenging to navigate. Despite bonds and equities selling off, the bond swap market continues to discount the Fed’s language and dot plot. Markets still show only a 28% chance of a rate hike in Nov and still expect rate cuts in the 1st half of 2024. We have to balance the knee-jerk selloff yesterday with the bigger picture view that the bond markets are providing and remain fairly neutral in this market. I advocated for a balance of long and short exposure in the DailyPlay portfolio. Currently, the S&P with its series of lower highs seems to target $4330 to the downside, and if a break below that would target $4100 below that. At the moment, I think it’s best to remove some exposure in trades that are long theta (time decay) that are not working and close out our AMT despite the fact that it has not yet reached its full stop loss level.

DailyPlay – Closing Trade (TXN) – September 20, 2023
Closing Trade
- TXN – 75% Gain: Buy to Close 3 Contracts (or 100% of your Contracts) Oct 13th $170/$180 Call Vertical Spreads @ $1.00 Debit. DailyPlay Portfolio: By Closing all 3 Contracts, we will be paying $300. We initially opened these 3 Contracts on Sept 5 @ $3.95 Credit. Our average gain, therefore, is $295 per contract.
Investment Rationale
All eyes are on the FOMC meeting today, as Chairman Powell is expected to deliver no rate hikes and an interpretation of the current inflation and employment data. One of the unexpected drivers of inflation is oil as it approaches $100/barrel. This will cause a rise in inflation and a dent in consumer spending as discretionary spend is allocated away from goods and services towards gas tanks. And companies will have to raise prices to pass on fuel costs to consumers as well. Note that the 10-year yields are now firmly at risk of rising towards the 5.2% level, not seen since 2007, which is concerning for current equity valuations. We are going to take this opportunity to close out half of our TXN trade, closing the 3 contracts of the Oct 13 $170/$180 Call Vertical @ $1.00 Debit since we have reached 75% of Max Gain and keep our 5 Contracts of a Put Spread to seek further downside in semiconductors.
$BIDU
DailyPlay – Closing Trade (BIDU) – September 19, 2023
Closing Trade
- BIDU – 92.31% Loss: Buy to Close 3 Contracts (or 100% of your Contracts) Oct 13th $144/$134 Put Vertical Spreads @ $7.00 Debit. DailyPlay Portfolio: By Closing all 3 Contracts, we will be paying $2,100. We initially opened these 3 Contracts on Sept 1 @ $4.25 Credit. Our average loss, therefore, is $275 per contract.
Investment Rationale
As a reminder, our DailyPlay service is designed to not only provide trade ideas and signals to enter and exit, but also provide a daily reminder of the best practices for managing a portfolio of positions. It is instinctual to hold onto losing positions, hoping that they will return back to profits, and take profits as soon as they appear. However, our goal at OptionsPlay is to help shape you into a profitable trader. And that can only be achieved by ensuring that losers stay small and give winners have the chance to run. For today, as we look at our portfolio, BIDU has reached a stop loss level and requires management. We are going to close out the full position of BIDU and focus on managing our winning positions.
$KEY
DailyPlay – Opening Trade (KEY) – September 18, 2023
KEY Bullish Opening Trade Signal
View KEY Trade
Strategy Details
Strategy: Long Call
Direction: Bullish
Details: Buy to Open 16 Contracts Nov 17th $11 Calls @ $1.28 Debit per contract.t.
Total Risk: This trade has a max risk of $2,032 (16 Contracts x $127) based on a hypothetical $100,000 portfolio risking 2%. We suggest using 2% of your portfolio value and divide it by $127 to select the # shares for your portfolio.
Trend Continuation Signal: This stock is in a bullish trend and is expected to continue higher.
1M/6M Trends: Bullish/Mildly Bullish
Technical Score: 7/10
OptionsPlay Score: 77
Stop Loss: @ $0.65 Credit (50% loss).
Entering the Trade
Use the following details to enter the trade on your trading platform. Please note that whenever there is a multi-leg option strategy, it should be entered as a single trade.
Please note that these prices are based on Friday’s closing prices. Should the underlying move significantly during the pre-market hours, we will likely adjust the strikes and prices to reflect a more accurate trade entry.
Investment Rationale
All eyes are on the FOMC this week as the Fed is expected to keep rates at the current level. Investors will be focused on Chairman Powell’s language around the latest CPI and employment data, and how that factors into rate hikes for the rest of the year. Currently the market is expecting a 33% chance of a rate hike in November and traders are already betting on a faster than expected rate cuts for next year. Equity markets remained neutral as extreme bearishness in the markets have started to recede. What’s interesting is that small caps and value have started to outperform large cap growth, which factors into how we look for opportunties right now.
Financials has been on our radar for a couple weeks and recently started to show relative strength. Looking for smaller cap, regional banks we find KEY as an way to play for upside in equities. KEY’s trends turned bullish last week and trades at a reasonable 8x forward earnings and a 7% dividend yield provides an attractive risk/reward entry for long exposure. With IV Rank @ 8%, I’m looking to simply buy the Nov $11 Call @ $1.27 Debit. With a hypothetical portfolio of $100,000, I recommend risking 2% of the portfolio’s value to this trade, which is 16 Contracts for a risk of $2,032. We will set a stop loss on the put spread at 50% of the premium paid @ $0.65 Credit.
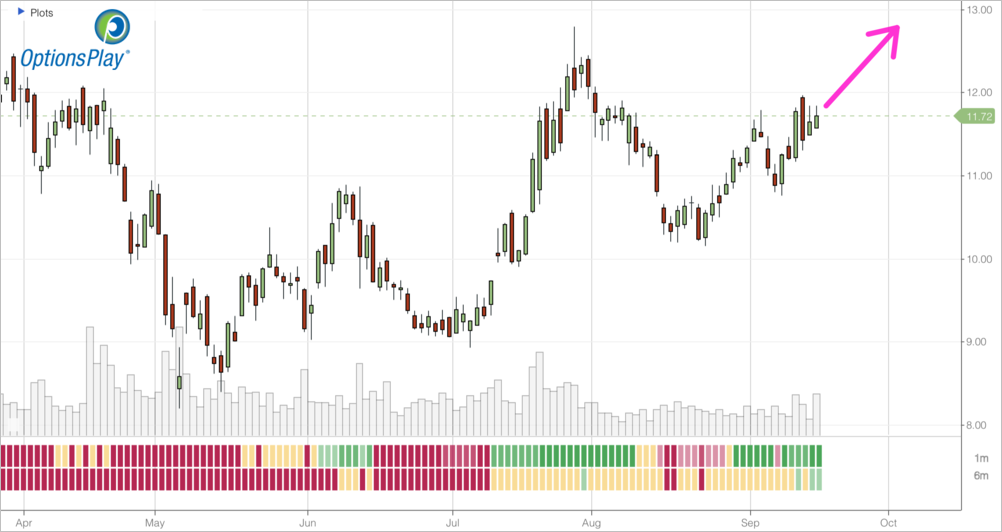
KEY – Daily

DailyPlay Updates – September 15, 2023
Investment Rationale
Data out of China has started to stabilize as Industrial Output and Retail Sales both surprised to the upside. As we look at how markets are digesting the strength of the US economy alongside a potential stabilization across China, we see that the S&P 500 is currently rallying up to its key $4550 resistance level. A break above that would suggest the start of a new bullish trend, while a rejection at those levels targeting $4330 to the downside. Currently our DailyPlay portfolio is positioned net long with a couple of hedges against a downturn using technology stocks. I currently do not feel the need to add more exposure, preferring to wait and see how the market reacts to reaching those upside targets first. I hope that you have a wonderful weekend!
$UPS
DailyPlay – Closing Trade (UPS) – September 14, 2023
Closing Trade
- UPS – 65.29% Gain: Buy to Close 3 Contracts (or 100% of your Contracts) Oct 20th $165/$175 Call Vertical Spreads @ $1.18 Debit. DailyPlay Portfolio: By Closing all 3 Contracts, we will be paying $354. We initially opened these 3 Contracts on Sept 6 @ $3.64 Credit. Our average gain, therefore, is $246 per contract.
Investment Rationale
As we wait on retail sales this morning to provide a glimpse into how consumer spending has held up into the end of summer, one position has reached its final target, UPS. This is our 3rd and final trade on UPS now that is has gapped lower and reached our downside target. If UPS were to rally back towards resistance we may enter another short in the next few weeks, but for now I think it’s time to take our profits on this trade and move onto other ideas. We’re going to close out the final remaining contracts on UPS.