$AMD

DailyPlay – Opening Trade (AMD) – July 31, 2023
AMD Bearish Opening Trade Signal
View AMD Trade
Strategy Details
Strategy: Long Put
Direction: Bearish
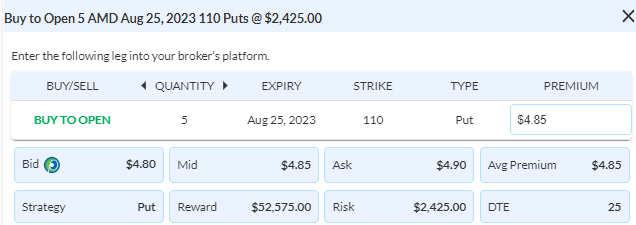
Details: Buy to Open 5 Contracts Aug 25th $110 Puts @ $4.85 Debit per contract.
Total Risk: This trade has a max risk of $2,425 (5 Contracts x $485) based on a hypothetical $100,000 portfolio risking 2%. We suggest using 2% of your portfolio value and divide it by $485 to select the # shares for your portfolio.
Trend Continuation Signal: This stock has been neutral to bearish and is expected to break downwards.
1M/6M Trends: Bearish/Neutral
Technical Score: 10/10
OptionsPlay Score: 94
Stop Loss: @ $2.40 Credit (50% loss).
Entering the Trade
Use the following details to enter the trade on your trading platform. Please note that whenever there is a multi-leg option strategy, it should be entered as a single trade.
Please note that these prices are based on Friday’s closing prices. Should the underlying move significantly during the pre-market hours, we will likely adjust the strikes and prices to reflect a more accurate trade entry.
Investment Rationale
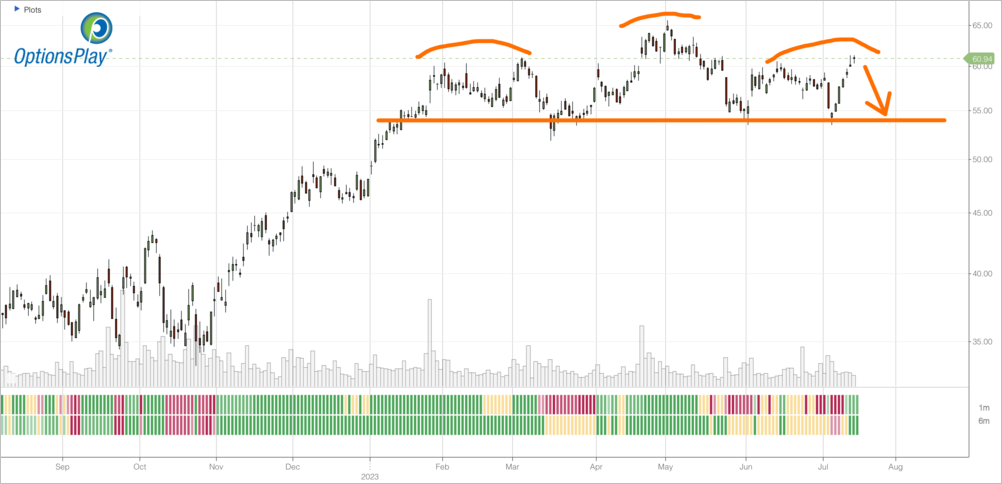
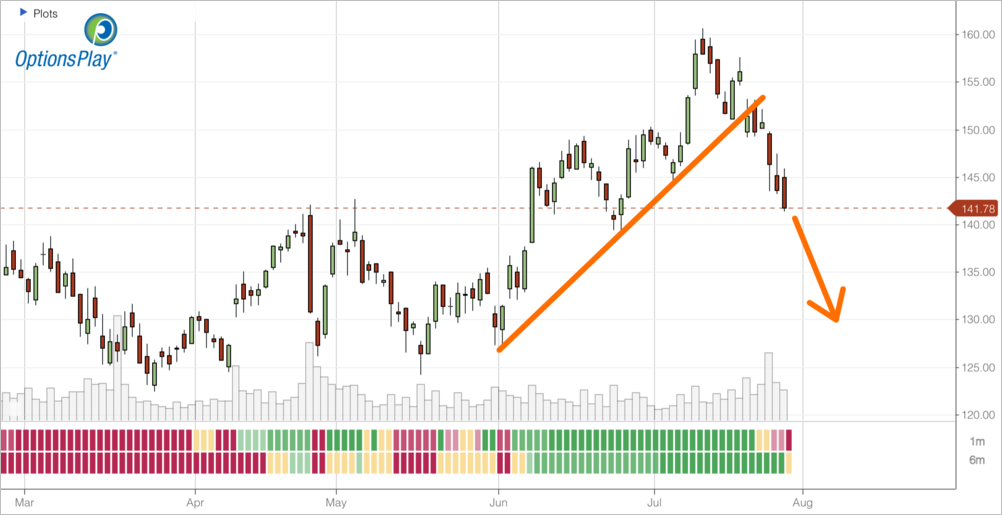
Heading into the biggest week of earnings and AAPL on Thursday we kick off the week with some big tech earnings. One name I have my eye on is AMD. After INTC reported decent earnings last week, it was clear that consumer and server chips demand has remained soft. Any AI-driven optimism pales in comparison to NVDA and will likely result in negligible revenue increases. And if we look at a Chart of AMD, it has held its triangle formation, but its relative strength to its sector remains poor, suggesting a breakdown is more likely with earnings as the catalyst. This morning’s pre-market strength is an opportunity to seek bearish exposure as the risk of a disappointing earnings with weak guidance is elevated. I’m buying an Aug 25 $110 Put @ $4.85 Debit (will be cheaper at the open). With a hypothetical portfolio of $100,000 we recommend risking 2% of it on this trade, which is 5 Contracts for a total risk of $2,425. Set a stop loss on the spread when losses exceed 50% of the premium paid, at about $2.40 Credit.
AMD – Daily
$WHR
DailyPlay – Opening Trade (WHR) Closing Trade (WHR) – July 28, 2023
Closing Trade
WHR – 31.36% Gain: Sell to Close 4 Contracts (or 100% of your Contracts) Aug 11th $149 Puts @ $7.75 Credit. DailyPlay Portfolio: By Closing all 4 Contracts, we will receive $3,100.
WHR Bearish Opening Trade Signal
View WHR Trade
Strategy Details
Strategy: Long Put Vertical Spread
Direction: Bearish
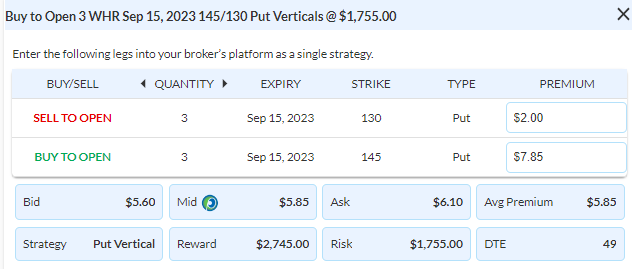
Details: Buy to Open 3 Contracts Sept 15th $145/$130 Put Vertical Spreads @ $5.85 Debit per contract.
Total Risk: This trade has a max risk of $1,755 (3 Contracts x $585) based on a hypothetical $100,000 portfolio risking 2%. We suggest using 2% of your portfolio value and divide it by $585 to select the # shares for your portfolio.
Trend Continuation Signal: This is a bullish trade on a stock that has been bullish and is expected to break higher.
1M/6M Trends: Bearish/Neutral
Technical Score: 4/10
OptionsPlay Score: 111
Stop Loss: @ $2.93 Credit (50% loss).
Entering the Trade
Use the following details to enter the trade on your trading platform. Please note that whenever there is a multi-leg option strategy, it should be entered as a single trade.
Please note that these prices are based on Thursday’s closing prices. Should the underlying move significantly during the pre-market hours, we will likely adjust the strikes and prices to reflect a more accurate trade entry.
Investment Rationale
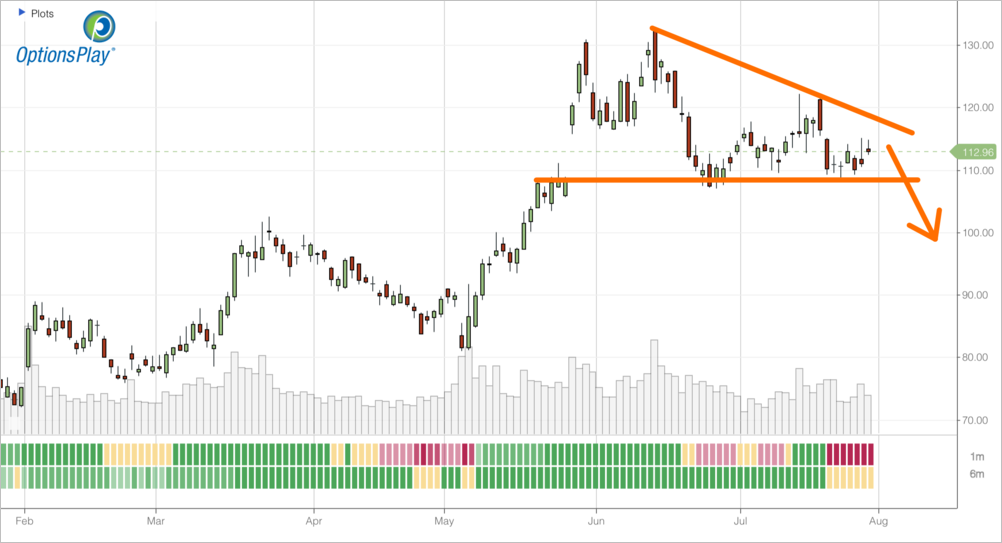
Reviewing our open positions we see that WHR has continued to trend lower after reporting earnings and its 1m/6m trend have started to turn bearish. Now is a good time to adjust this position and roll the position to a Put Vertical spread and potentially profit from further downside. This locks in a profit on this trade and allows us to seek further downside exposure while risking a very small dollar amount. Sell to Close all 4 Contracts of the Aug $149 Puts @ $7.75 Credit and taking the proceeds to Buy the Sept $145/$130 Put Vertical @ $5.85 Debit. With a hypothetical portfolio of $100,000 we recommend risking 2% of it on this trade, which is 3 Contracts for a total risk of $1,755. Set a stop loss on the spread when losses exceed 50% of the premium paid, at about $2.90 Credit. With this roll, even if the put spread is stopped out, we will risk a total of roughly $140, with a potential profit of about $2,700 if WHR is below $130 at the Sept expiration.
WHR – Daily
$CAT

DailyPlay – Opening Trade (CAT) – July 27, 2023
CAT Bullish Opening Trade Signal
View CAT Trade
Strategy Details
Strategy: Long Call Vertical Spread
Direction: Bullish
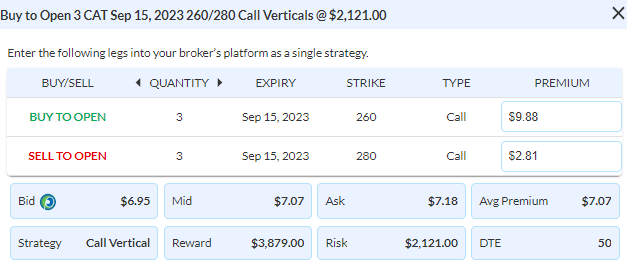
Details: Buy to Open 3 Contracts Sept 15th $260/$280 Call Vertical Spreads @ $7.07 Debit per contract.
Total Risk: This trade has a max risk of $2,121 (3 Contracts x $707) based on a hypothetical $100,000 portfolio risking 2%. We suggest using 2% of your portfolio value and divide it by $707 to select the # shares for your portfolio.
Trend Continuation Signal: This is a bullish trade on a stock that has been bullish and is expected to break higher.
1M/6M Trends: Bullish/Bullish
Technical Score: 6/10
OptionsPlay Score: 102
Stop Loss: @ $3.54 Credit (50% loss).
Entering the Trade
Use the following details to enter the trade on your trading platform. Please note that whenever there is a multi-leg option strategy, it should be entered as a single trade.
Please note that these prices are based on Wednesday’s closing prices. Should the underlying move significantly during the pre-market hours, we will likely adjust the strikes and prices to reflect a more accurate trade entry.
Investment Rationale
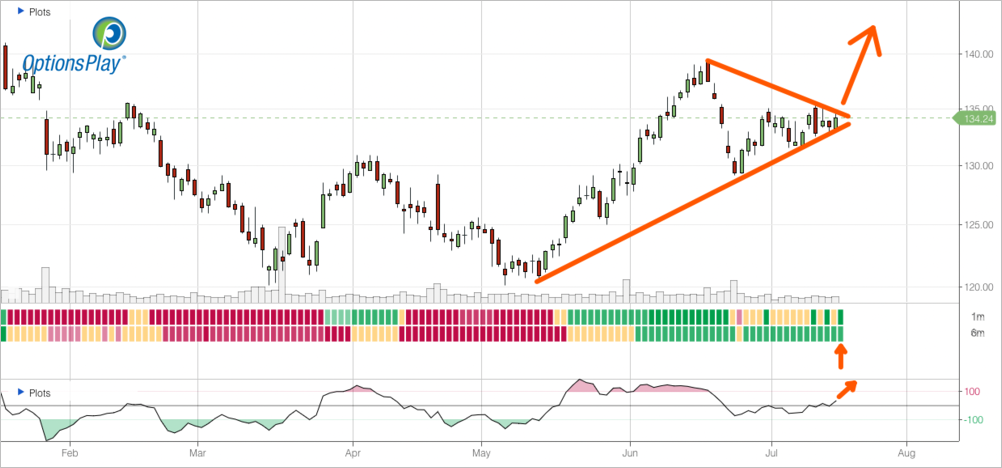
Yesterday’s FOMC meeting was a non-event, despite Chairman Powell leaving the door open to further rate hikes. The market has now fully committed to pricing in no more rate hikes for the rest of the year and expect rates to be a full 125bps lower by the end of next year. This should be interpreted as positive, however markets are showing some early signs of exhaustion with negative divergence with momentum on both the S&P 500 and Nasdaq 100 index. Despite this, we see a healthy amount of rotation within the sectors and the rally broadening out. One sector that is showing strength on both an absolute and relative basis is industrials as it prints a new all time high yesterday. And CAT is a potential candidate for a breakout with earnings next week within the industrials sector. Trading at only 14x forward earnings, yet expecting 26% EPS growth this year, it’s trading at a valuation that could support a breakout on strong earnings guidance. Currently trading at just below the $265 resistance level we are taking this opportunity to buy an OTM Call Vertical to play for a breakout on earnings. Buy to Open Sept $260/280 Call Vertical @ $7.07 Debit. With a hypothetical portfolio of $100,000 we recommend risking 2% of it on this trade, which is 3 Contracts for a total risk of $2,121. Set a stop loss on the spread when losses exceed 50% of the premium paid, at about $3.50 Credit.
CAT – Daily

DailyPlay Updates – July 26, 2023
Today is the big day of the FOMC meeting, which will bring an expected 25bps hike. The big unknown is whether or not the Fed will pivot to a pausing after this rate hike. This is where I believe there is room for disappointment based on the strength of economic data, providing room for further rate hikes. We have to take this into account with our long positions that are at risk with this FOMC meeting. Taking a look at our positions, GOOGL turned out to be a winner almost instantly on the back of strong search revenue. We expect to close out this position after the open and will update the price after the open. We will also keep a close eye on WHR to close this out at a small loss despite seeing a big move lower yesterday.
$GOOGL
DailyPlay – Opening Trade (GOOGL) – July 25, 2023
GOOGL Bullish Opening Trade Signal
View GOOGL Trade
Strategy Details
Strategy: Short Put Vertical Spread
Direction: Bullish
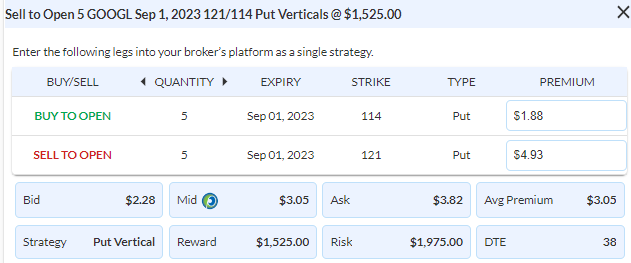
Details: Sell to Open 5 Contracts Sept 1st $121/$114 Put Vertical Spreads @ $3.05 Credit per contract.
Total Risk: This trade has a max risk of $1,975 (5 Contracts x $395) based on a hypothetical $100,000 portfolio risking 2%. We suggest using 2% of your portfolio value and divide it by $395 to select the # shares for your portfolio.
Trend Continuation Signal: This is a bullish trade on a stock that has been neutral to bullish and is expected to continue higher.
1M/6M Trends: Neutral/Neutral
Technical Score: 9/10
OptionsPlay Score: 105
Stop Loss: @ $6.10 Debit (100% loss).
Entering the Trade
Use the following details to enter the trade on your trading platform. Please note that whenever there is a multi-leg option strategy, it should be entered as a single trade.
Please note that these prices are based on Monday’s closing prices. Should the underlying move significantly during the pre-market hours, we will likely adjust the strikes and prices to reflect a more accurate trade entry.
Investment Rationale
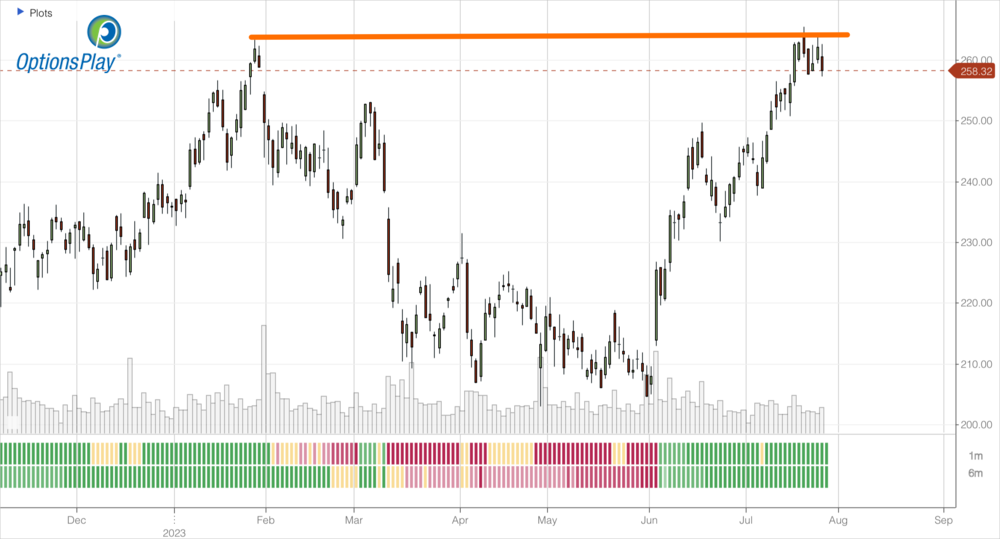
As we wait for HLT to report Wednesday morning and TMUS on Thursday afternoon, we look for opportunities among the Tech giants that report this week. Across the board, all the major tech names that lead this AI rally are trading at nosebleed valuations, except Alphabet. While still expecting over 16% EPS growth this year, GOOGL trades at only 22x next year’s earnings, presenting a long entry opportunity just before earnings. The risks lie in search revenue and communication of timelines for their AI integrations that could drive the stock performance after earnings. With options premiums elevated, we have a rare opportunity to sell a Bull Put Spread going into earnings collecting over 43% of the vertical width. Sell to Open the Sept 1 $121/$114 Put Vertical @ $3.05 Credit. With a hypothetical portfolio of $100,000 we recommend risking 2% of it on this trade, which is 5 Contracts for a total risk of $1,975 in. Set a stop loss on the spread when losses exceed 100% of the premium paid, about $6.10 Debit.
GOOGL – Daily
$TMUS
DailyPlay – Opening Trade (TMUS) Closing Trade (AXP) – July 24, 2023
Closing Trade
- AXP – 41.05% Loss: Sell to Close 3 Contracts (or 100% of your Contracts) Aug 18th $170/$185 Call Vertical Spreads @ $4.05 Credit. DailyPlay Portfolio: By Closing all 4 Contracts, we will receive $1,215. Our average loss per contract is therefore $282.
TMUS Bullish Opening Trade Signal
View TMUS Trade
Strategy Details
Strategy: Long Call Vertical Spread
Direction: Bullish
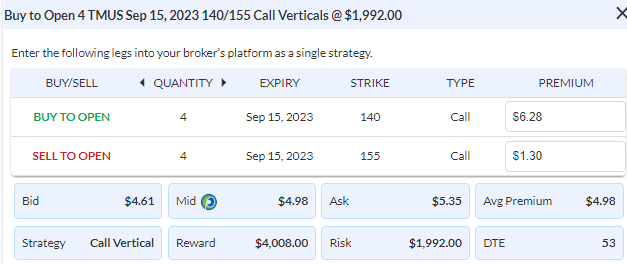
Details: Buy to Open 4 Contracts Sept 15th $140/$155 Call Vertical Spreads @ $4.98 Debit per contract.
Total Risk: This trade has a max risk of $1,992 (4 Contracts x $498) based on a hypothetical $100,000 portfolio risking 2%. We suggest using 2% of your portfolio value and divide it by $498 to select the # shares for your portfolio.
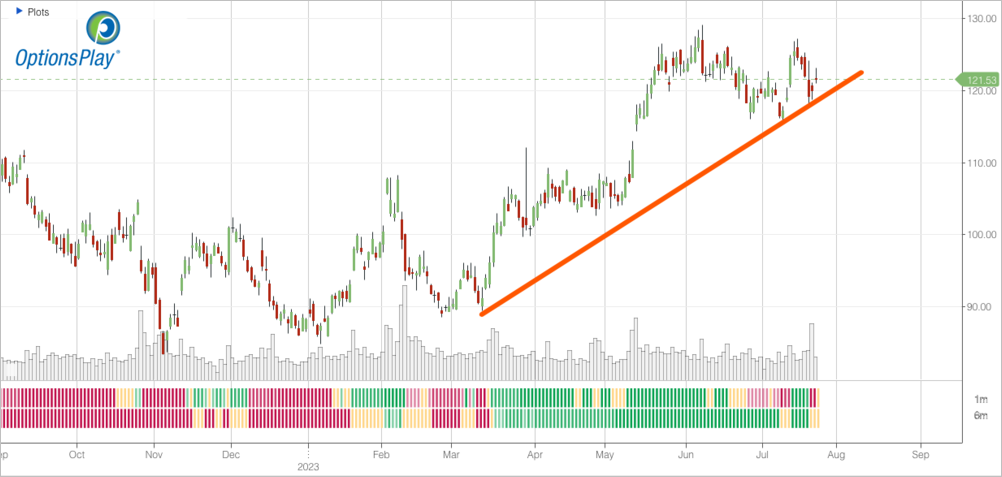
Trend Continuation Signal: This stock has been bullish and recently broke above a key level.
1M/6M Trends: Bullish/Neutral
Technical Score: 4/10
OptionsPlay Score: 115
Stop Loss: @ $2.49 Credit (50% loss).
Entering the Trade
Use the following details to enter the trade on your trading platform. Please note that whenever there is a multi-leg option strategy, it should be entered as a single trade.
Please note that these prices are based on Friday’s closing prices. Should the underlying move significantly during the pre-market hours, we will likely adjust the strikes and prices to reflect a more accurate trade entry.
Investment Rationale
As I write today’s DailyPlay, I wanted to remind readers that our goal is to help you grow your account by instilling strategies that lead to profitability. We do this by firstly ensuring that we don’t blow up our account by continuously cutting losing positions quickly and focusing our efforts on adding exposure in positions that are working to hit home runs. While this may sound simple, managing your emotions as you implement this is far from simple. This is what separates profitable traders from those who struggle with handling the uncomfortable. It’s incredibly difficult to accept lots of small losses while fighting the urge to take profits on your winning positions. It’s important to remember and understand that the road to profitability if filled with a lot of small losers balanced by far fewer big wins. With this in mind, we are closing our 3 Contracts of AXP where earnings did not move in the expected direction at a small loss and adding to our TMUS position that is working. Buy to Open 4 Contracts TMUS Sept $140/155 Call Vertical @ $4.98 Debit.
TMUS – Daily
$WHR
DailyPlay – Opening Trade (WHR) – July 21, 2023
WHR Bearish Opening Trade Signal
View WHR Trade
Strategy Details
Strategy: Long Put
Direction: Bearish
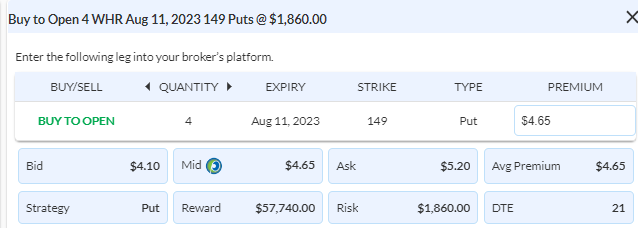
Details: Buy to Open 4 Contracts Aug 11th $149 Put @ $4.65 Debit per contract.
Total Risk: This trade has a max risk of $1,860 (4 Contracts x $465) based on a hypothetical $100,000 portfolio risking 2%. We suggest using 2% of your portfolio value and divide it by $465 to select the # shares for your portfolio.
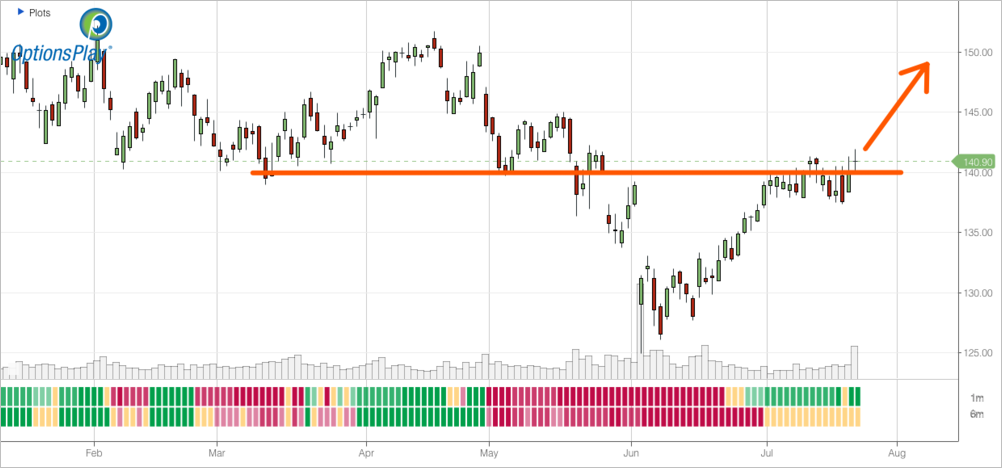
Counter Trend Signal: This stock has been bullish but broke below an uptrend channel.
1M/6M Trends: Bullish/Bullish
Technical Score: 7/10
OptionsPlay Score: 87
Stop Loss: @ $2.33 Credit (50% loss).
Entering the Trade
Use the following details to enter the trade on your trading platform. Please note that whenever there is a multi-leg option strategy, it should be entered as a single trade.
Please note that these prices are based on Thursday’s closing prices. Should the underlying move significantly during the pre-market hours, we will likely adjust the strikes and prices to reflect a more accurate trade entry.
Investment Rationale
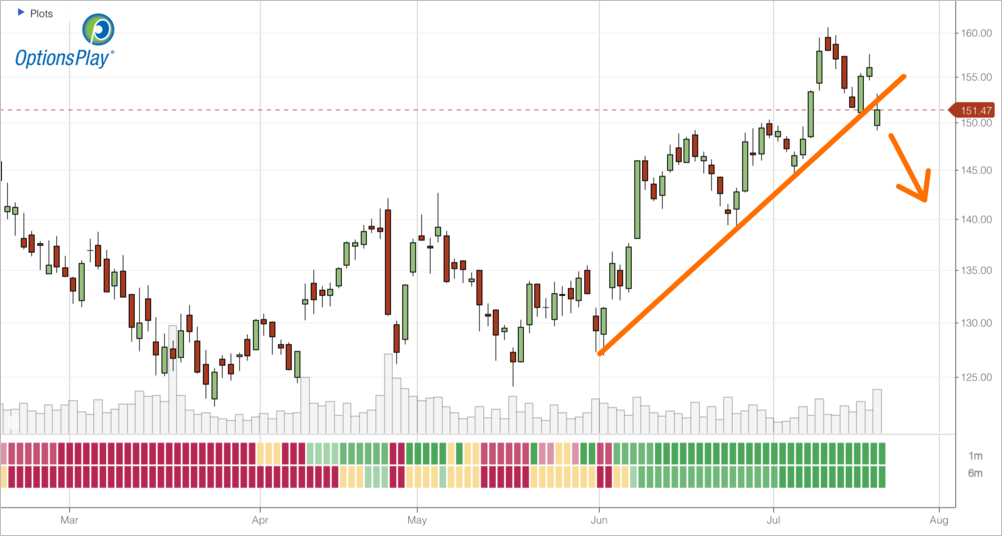
After closing out 2 of our earnings play yesterday for a profit, let’s look at other opportunities for next week. During our Earnings Education session, we reviewed metrics that showed the average beats rising less than 1% higher, but misses declined by more than 5% on average. With this data, we prefer to seek bearish opportunities this earnings season. Reviewing the OptionsPlay’s Earnings Calendar we see WHR reports after the close on Monday. WHR recently rallied up to its key $160 resistance level and failed to break higher. Moreover, its relative chart to the consumer discretionary sector is poor and trading near 52-week lows, suggesting potential weakness ahead. And Electrolux’s earnings announcement yesterday sent the stock down 20%, warning us of significant weakness from consumer appliance purchases. With CPI appliance prices lower in Q2 by 10%, we expect both revenue and margin compression from companies such as WHR. To take advantage of a potential move lower we are using a simple put option to capture significant downside. Buy to Open Aug 11 $149 Puts for $4.65 Debit. With a hypothetical portfolio of $100,000 we recommend risking 2% of it on this trade, which is 4 Contracts for $1,860 in total risk. Set a stop loss on the put at 50% of the premium paid, about $2.30 Credit.
WHR – Daily
$KRE

DailyPlay – Closing Trade (KRE) – July 19, 2023
Closing Trade
- KRE – 91.57% Loss: Buy to Close 8 Contracts (or 100% of your Contracts) Aug 18th $40/$44 Call Vertical Spreads @ $3.41 Debit. DailyPlay Portfolio: By Closing all 8 Contracts, we will be paying $2,728.
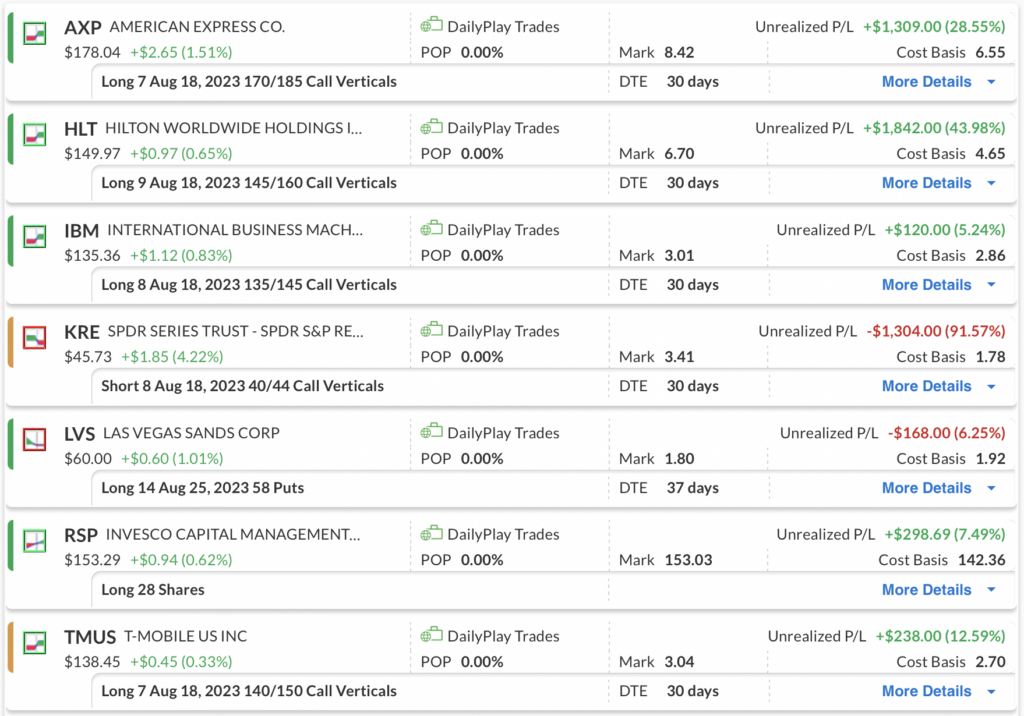
Current DailyPlay Positions
Investment Rationale
With earnings season in full swing, we have a number of open positions that report earnings this week and next. As we wait for those results, we must keep our eyes on positions that are not working out. Out of the 7 positions, KRE has surprised to the upside, turning positive despite an inverted yield curve and triggered our stop loss levels. As a reminder, our DailyPlay process is designed to help you instill the discipline of a profitable trader. Despite showing strong gains on a few positions, we must maintain our exposure in those winning positions, while cutting losers when they are still small. It’s tough to fight the urge to take profits on our winners and keep our losers open and hope that they “come back”. But that is the counterintuitive nature of profitable trading. So we are going to close out our entire 8 Contracts of KRE Aug $40/$44 Call Vertical @ $3.40 Debit.
$IBM
DailyPlay – Opening Trade (IBM) – July 18, 2023
IBM Bullish Opening Trade Signal
View IBM Trade
Strategy Details
Strategy: Long Call Vertical Spread
Direction: Bullish
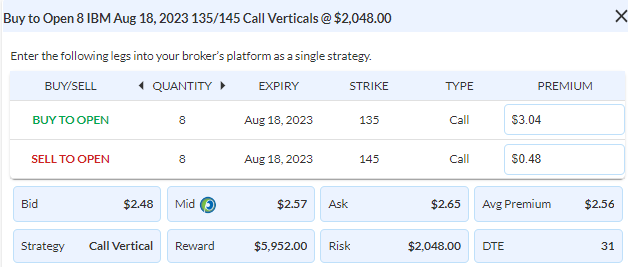
Details: Buy to Open 8 Contracts Aug 18th $135/$145 Call Vertical Spreads @ $2.56 Debit per contract.
Total Risk: This trade has a max risk of $2,048 (8 Contracts x $256) based on a hypothetical $100,000 portfolio risking 2%. We suggest using 2% of your portfolio value and divide it by $256 to select the # shares for your portfolio.
Trend Continuation Signal: This stock has been bullish and is expected to break higher.
1M/6M Trends: Bullish/Bullish
Technical Score: 4/10
OptionsPlay Score: 126
Stop Loss: @ $1.28 Credit (50% loss).
Entering the Trade
Use the following details to enter the trade on your trading platform. Please note that whenever there is a multi-leg option strategy, it should be entered as a single trade.
Please note that these prices are based on Monday’s closing prices. Should the underlying move significantly during the pre-market hours, we will likely adjust the strikes and prices to reflect a more accurate trade entry.
Investment Rationale
As we ramp up earnings season with equities in a full bullish setup and tech overextended, opportunities to enter AI stocks with decent risk/rewards are rare. However, IBM reports this week on Wednesday (PM) and trades at both a reasonable valuation and price with upside potential. IBM’s poor relative performance is a reflection of its failure to capture recent cloud computing trends, but its AI and cloud products are starting to show signs of catching up. Earnings this week could be the catalyst for IBM to start trading closer to the valuations of its faster growing peers. It currently trades at 14.3x forward earnings, which is a massive 40% discount to its group and represents the upside. With IV Rank currently sitting at 35%, options aren’t inexpensive, so I’m inclined to buy an OTM call spread. Buy to Open the Aug $135/145 Call Vertical @ $2.56 Debit. With a hypothetical portfolio of $100,000 we recommend risking 2% of it on this trade, which is 8 Contracts for $2,050 in total risk. Set a stop loss on the vertical spread at 50% of the premium paid, about $1.25 Credit.
IBM – Daily

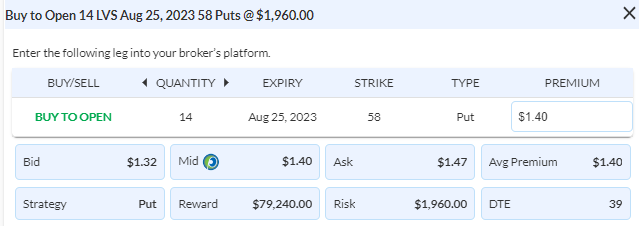
DailyPlay – Opening Trade (LVS) – July 17, 2023
LVS Bearish Opening Trade Signal
View LVS Trade
Strategy Details
Strategy: Long Put
Direction: Bearish
Details: Buy to Open 14 Contracts Aug 18th $58 Puts @ $1.40 Debit per contract.
Total Risk: This trade has a max risk of $1,960 (14 Contracts x $140) based on a hypothetical $100,000 portfolio risking 2%. We suggest using 2% of your portfolio value and divide it by $140 to select the # shares for your portfolio.
Counter Trend Signal: This stock has been bullish but is expected to trade lower with a top of around $60 in place.
1M/6M Trends: Bullish/Bullish
Technical Score: 8/10
OptionsPlay Score: 67
Stop Loss: @ $0.70 Credit (50% loss).
Entering the Trade
Use the following details to enter the trade on your trading platform. Please note that whenever there is a multi-leg option strategy, it should be entered as a single trade.
Please note that these prices are based on Friday’s closing prices. Should the underlying move significantly during the pre-market hours, we will likely adjust the strikes and prices to reflect a more accurate trade entry.
Investment Rationale
With last week’s important CPI print and upbeat earnings pushing markets above their double-top resistance, all signs seem to be positive. However, as markets grind higher, we start to see opportunities where the risk/reward favors bearish exposure. One opportunity that I see is LVS with upcoming earnings on Wednesday after the close. LVS has rallied over 80% since Oct and since the beginning of the year has been forming a head & shoulders formation, which suggests that rally is at risk of a pullback. Currently trading at nearly 31x forward earnings, its priced based on the optimism of China’s reopening. LVS has exposure primarily in to Singapore and Macau and economic data out of China continues to disappoint over the past few months, suggesting soft travel demand to these destinations. My hunch is that guidance for LVS may come in light and become a catalyst for LVS to trade back down toward its $54 neckline. Look to buy an Aug 25 $58 Put @ $1.40 Debit with a stop loss at $0.70.
LVS – Daily