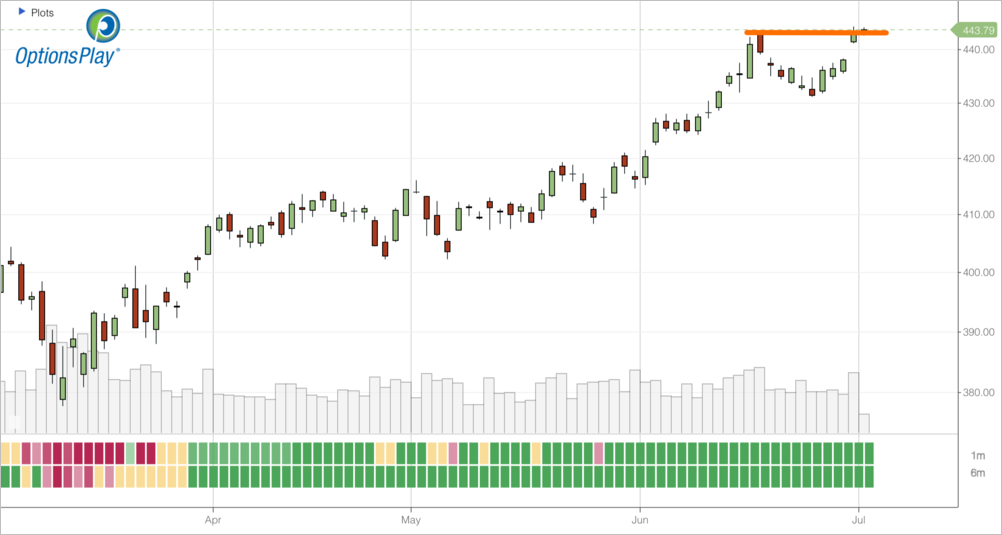
$JPM

DailyPlay – Closing Trade (JPM) – July 14, 2023
Closing Trade
- JMP – 79.74% Gain: Sell to Close 4 Contracts (or 100% of your remaining Contracts) July 21st $140 Calls @ $9.38 Credit. DailyPlay Portfolio: By Closing the remaining 4 Contracts, we will receive $3,752. We closed 50% of this trade at 98%, resulting in an average gain of 88.87%.
Investment Rationale
JPM reported earnings this morning beating expectations and raising forward guidance for 2023 and the stock is now trading about $3.50 higher than the close yesterday. With 1 week left to expiration it is time for us to close out this trade at the open. Sell to Close the remaining 4 contracts of the July $140 Calls for about $12.50 Credit (we will update the portfolio price after the open). This would close out our entire JPM position for a total gain of roughly $4,400 on the 8 contracts we had exposure in. This is a prime example of how adding further exposure to a position when we were confirmed with the breakout gives us the opportunity to hit home runs, gaining over 440% return on the original roughly $1,000 (with a 50% stop loss) that we risked with the original 4 contracts.
$AXP

DailyPlay – Opening Trade (AXP) Closing Trade (NEM) – July 13, 2023
Closing Trade
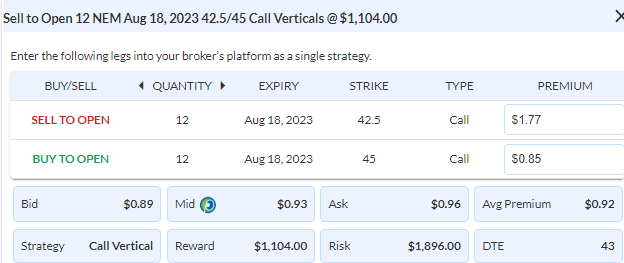
NEM – 102.53% Loss: Buy to Close 12 Contracts (or 100% of your Contracts) Aug 18th $42.50/$45 Calls @ $1.60 Debit. DailyPlay Portfolio: By Closing all 12 Contracts, we will be paying $1,920. We opened this trade @ $0.79 Credit and, resulting in an average Credit of $79 per contract. The average loss per contract is therefore $81.
AXP Bullish Opening Trade Signal
View AXP Trade
Strategy Details
Strategy: Long Call Vertical Spread
Direction: Bullish
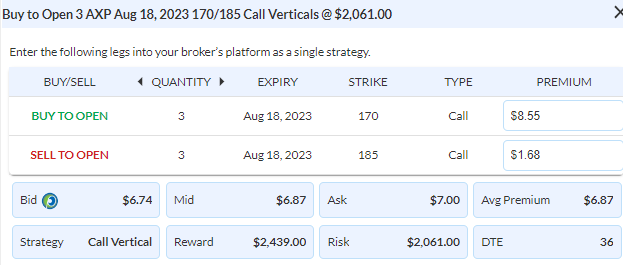
Details: Buy to Open 3 Contracts Aug 18th $170/$185 Call Vertical Spreads @ $6.87 Debit per contract.
Total Risk: This trade has a max risk of $2,061 (3 Contracts x $687) based on a hypothetical $100,000 portfolio risking 2%. We suggest using 2% of your portfolio value and divide it by $687 to select the # shares for your portfolio.
Trend Continuation Signal: This stock is in a bullish trend and further upside is expected.
1M/6M Trends: Bullish/Bullish
Technical Score: 8/10
OptionsPlay Score: 92
Stop Loss: @ $3.44 Credit (50% loss).
Entering the Trade
Use the following details to enter the trade on your trading platform. Please note that whenever there is a multi-leg option strategy, it should be entered as a single trade.
Please note that these prices are based on Wednesday’s closing prices. Should the underlying move significantly during the pre-market hours, we will likely adjust the strikes and prices to reflect a more accurate trade entry.
Investment Rationale
Earnings seasons kick off with a bang as Delta and Pepsi beat earnings and announce upbeat guidance for 2023. Equity markets continue to trade higher in pre-markets and seems to have confirmed a break of recent double-top formation which is a very bullish signal. With this in mind, we are adjusting two of our open positions. We are going to add additional exposure to AXP and close out our NEM position. With the AXP position now up 20%, we take this opportunity to add further exposure going into its earnings next week. Buy to Open 3 Contracts (2% of our $100,000 portfolio) of the Aug $170/185 Call Vertical @ $6.87. We also need to cut losses when trades are not panning out, with NEM reaching our stop loss level of 100% of the max gain, so we are closing out the full position.
As a reminder, our DailyPlay mandate is focused on helping you become a profitable trader. The only path to profitability is have your winners outweigh your losers. We show you how to achieve this by turning small winners into large winners while cutting losses quickly. Join me later today for our July Summit where I teach the skills to Grow Your Trading Account and how the DailyPlay provides daily examples of how to achieve this.
$JPM
DailyPlay – Partial Closing Trade (JPM, SBUX) – July 12, 2023
Partial Closing Trade
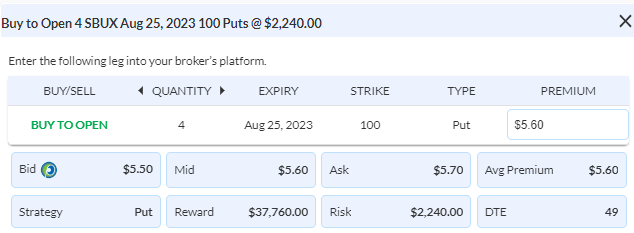
- SBUX – 32% Loss: Sell to Close 6 Contracts Aug $100 Puts @ $3.15 Credit and Sell to Close 4 Contracts Aug 25 $100 Puts @ $3.28 Credit.
- JPM – 98% Gain: Sell to Close 4 Contracts July $140 Call @ $8.20 Credit.
Investment Rationale
Today’s CPI print will be pivotal with the market currently expecting the Fed to raise rates during their July meeting. With inflation expected to continue to decline, the decline is a potential catalyst for the Fed to hike only one more time before the end of the year, which would be a bullish tailwind for both equities and bonds. Viewing our positions with multiple long exposure positions that we have open, we are just a few cents from our stop loss levels on SBUX of $3.00 and may close that position today if SBUX continues to show strength. Ahead of this important CPI print it’s time to take profits on half of our JPM position that we have added to. Sell to Close 4 Contracts July $140 Calls @ $8.20 Credit and keep the other 4 contracts into earnings.

DailyPlay Updates – July 11, 2023
Investment Rationale
As we head into the CPI print that everyone has eyes on due to its impact on Fed policy, we review our open positions and feel that we have enough exposure going into a potentially volatile week. I am not inclined to add any further exposure to our numerous positions, nor are any of our current positions at a point where we are ready to close. The only noted name is SBUX which has reversed back into its trading range after we added to the position when it broke below its $98 support. We will be monitoring this one for a potential close if the options on them trade for less than $3.00 each. Otherwise we are going to wait until the CPI print and the earnings this week to help us gain some clarity regarding the direction of the market.
$HLT
DailyPlay – Opening Trade (HLT) – July 10, 2023
HLT Bullish Opening Trade Signal
View SBUX Trade
Strategy Details
Strategy: Long Call Vertical Spread
Direction: Bullish
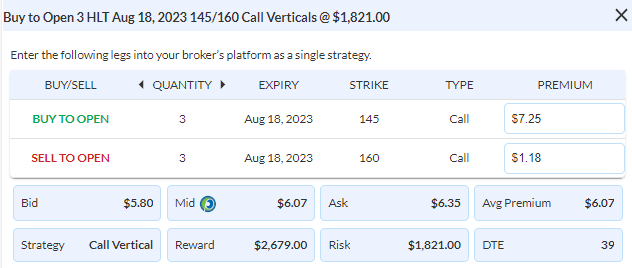
Details: Buy to Open 3 Contracts Aug 18th $145/$160 Call Vertical Spreads @ $6.07 Debit per contract.
Total Risk: This trade has a max risk of $1,821 (3 Contracts x $607) based on a hypothetical $100,000 portfolio risking 2%. We suggest using 2% of your portfolio value and divide it by $607 to select the # shares for your portfolio.
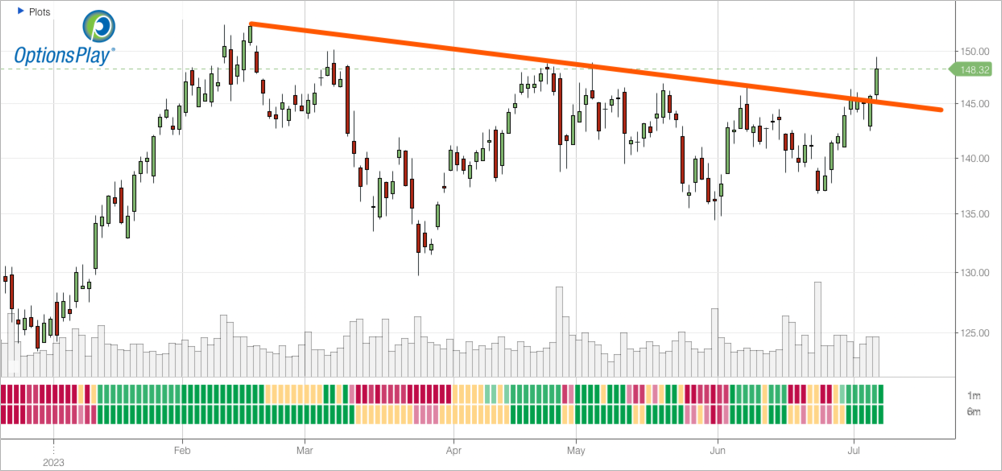
Trend Continuation Signal: This stock is in a bullish trend and further upside is expected as it broke above a trendline.
1M/6M Trends: Bullish/Bullish
Technical Score: 9/10
OptionsPlay Score: 101
Stop Loss: @ $3.00 Credit (50% loss).
Entering the Trade
Use the following details to enter the trade on your trading platform. Please note that whenever there is a multi-leg option strategy, it should be entered as a single trade.
Please note that these prices are based on Friday’s closing prices. Should the underlying move significantly during the pre-market hours, we will likely adjust the strikes and prices to reflect a more accurate trade entry.
Investment Rationale
We’re heading into a big week ahead of the important CPI print the kickoff of Q2’s earnings season. Markets have been in pause awaiting data this week that could be the catalyst of either the next leg higher in equities or the start of a pullback. The bond markets have shifted its tone last week, but equities continues to play chicken with the Fed. As we review our positions, our HLT position stands out as showing early signs of promise on the back of incredible strength in the travel sector. As HLT breaks out above its trading range we want to add to this position while raising our stops. Buy 3 Contracts (another 2% of our $100,000 total portfolio value) of HLT Aug $145/$160 Call Vertical @ $6.07 Debit while raising stops on all 9 contracts up to $3.00 Credit. This skews the risk/reward in our favor, risking a total of roughly $1,200 (if stopped out) for the increased position size and a profit potential of roughly $7,800 if HLT were to close above $160 at the August expiration.
HLT – Daily
$SBUX

DailyPlay – Opening Trade (SBUX) – July 7, 2023
SBUX Bearish Opening Trade Signal
View SBUX Trade
Strategy Details
Strategy: Long Put
Direction: Bearish
Details: Buy to Open 4 Contracts Aug 25th $100 Puts @ $5.60 Debit per contract.
Total Risk: This trade has a max risk of $2,240 (4 Contracts x $560) based on a hypothetical $100,000 portfolio risking 2%. We suggest using 2% of your portfolio value and divide it by $560 to select the # shares for your portfolio.
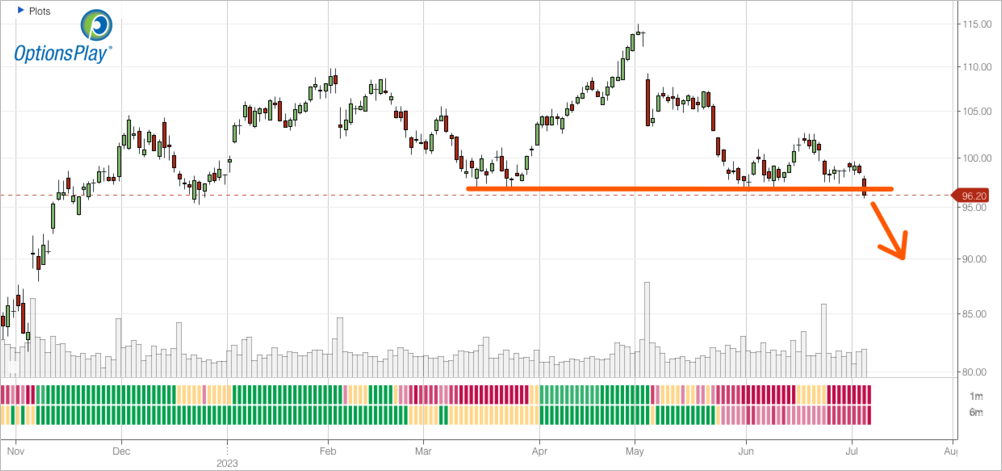
Trend Continuation Signal: This stock is in a bearish trend and further downside is expected as it broke below a key support level.
1M/6M Trends: Bearish/Bearish
Technical Score: 3/10
OptionsPlay Score: 94
Stop Loss: @ $3.00 Credit (50% loss).
Entering the Trade
Use the following details to enter the trade on your trading platform. Please note that whenever there is a multi-leg option strategy, it should be entered as a single trade.
Please note that these prices are based on Thursday’s closing prices. Should the underlying move significantly during the pre-market hours, we will likely adjust the strikes and prices to reflect a more accurate trade entry.
Investment Rationale

I hope that many of you reading this were able to attend my session last night on How to Grow a Trading Account (click on the image above to open the recording), or are able to watch the recording today. We are going to adjust our SBUX trade exactly as we had laid out in the session last night as to how we grow our DailyPlay portfolio in the long run. As SBUX breaks below a key support level and starts to show that our outlook is correct, we are taking this opportunity to add to this position instead of taking profits. You may be included to take some profit here, but that is no way to grow an account, we would rather risk this small win back into a loser if it means we have the chance to hit a home run. It’s uncomfortable and painful to potentially see a win turn back into a loss when you had a chance to take profits, but that’s a counterintuitive requirement of profitable trading. We are going to purchase another 2% of our account on more SBUX puts. Buy 4 Contracts Aug $100 Puts @ $5.60 Debit. However, we are also going to move our stops from the original $2.00 up to $3.00. This would risk a total of $1,200 on the entire 10 contracts if we end up being stopped out with unlimited downside exposure on double our initial trade size.
SBUX – Daily
$NEM
DailyPlay – Opening Trade (NEM) – July 6, 2023
NEM Bearish Opening Trade Signal
View NEM Trade
Strategy Details
Strategy: Short Call Vertical Spread
Direction: Bearish
Details: Sell to Open 12 Contracts Aug 18th $42.50/$45 Calls @ $0.93 Credit per contract.
Total Risk: This trade has a max risk of $1,896 (12 Contracts x $158) based on a hypothetical $100,000 portfolio risking 2%. We suggest using 2% of your portfolio value and divide it by $158 to select the # shares for your portfolio.
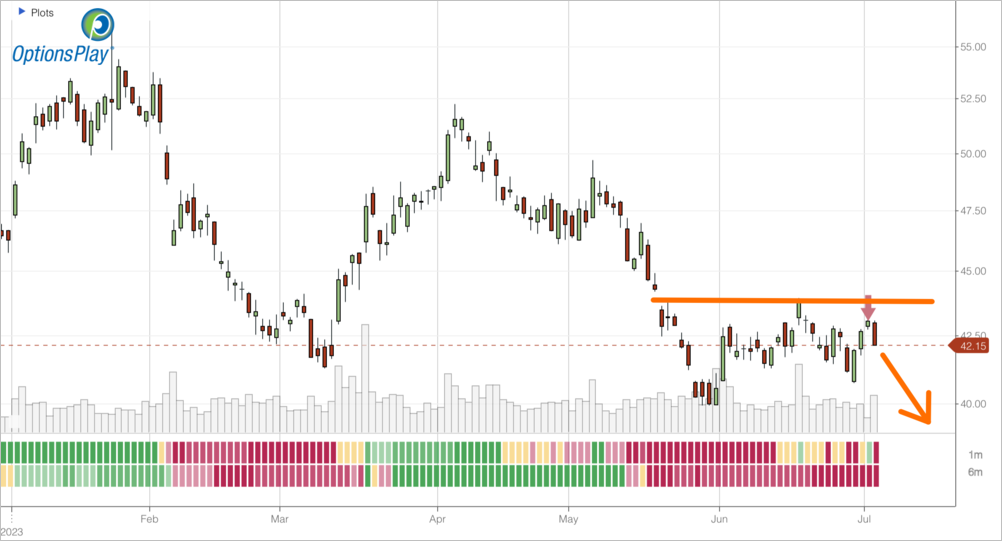
Trend Continuation Signal: This stock is in a bearish trend and further downside is expected.
1M/6M Trends: Bearish/Bearish
Technical Score: 2/10
OptionsPlay Score: 98
Stop Loss: @ $1.86 Debit (100% loss).
Entering the Trade
Use the following details to enter the trade on your trading platform. Please note that whenever there is a multi-leg option strategy, it should be entered as a single trade.
Please note that these prices are based on Wednesday’s closing prices. Should the underlying move significantly during the pre-market hours, we will likely adjust the strikes and prices to reflect a more accurate trade entry.
Investment Rationale
As equities continue to trade sideways on higher interest rate expectations, we turn our attention to Gold. The precious metal has continued to trade below its $1940 support level towards its $1866 support, and we see further downside. It also happens that NEM recently triggered both our sell signal on our Trade Ideas yesterday as well as an optimal bearish credit spread last night. With its recent rejection at its $43 resistance level and NEM’s underperformance relative to the gold miners I see an opportunity to add some short exposure in an asset class that is less correlated to equities. Look to sell the Aug $42.5/45 Call Vertical @ $0.92 Credit.
NEM – Daily
DailyPlay Updates – July 5, 2023
Investment Rationale
With equities opening up lower on the back of weak industrial data out of China and a light week of volume, we are taking a pause from adding any additional positions in our DailyPlay portfolio. At the moment the $444 resistance level on SPY is holding alongside the major resistance levels are the ones we are paying attention to this week. A close below those levels suggests the rally momentum is waning and starting to show signs of exhaustion.
SPY – Daily
$JPM
DailyPlay – Opening Trade (JPM) Closing Trade (AAPL) – July 3, 2023
Closing Trade
- AAPL – 107.74% Loss: Buy to Close 6 Contracts (or 100% of your Contracts) July 28th $190/$195 Call Vertical Spreads @ $3.22 Debit. DailyPlay Portfolio: By Closing all 6 Contracts, we will pay $1,932.
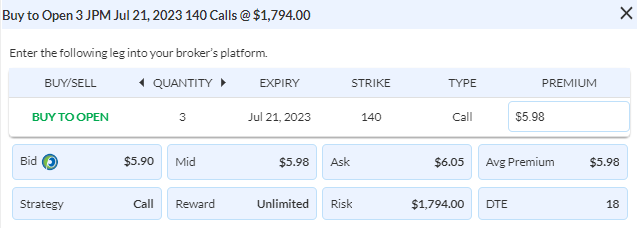
JPM Bullish Opening Trade Signal
View JPM Trade
Strategy Details
Strategy: Long Call
Direction: Bullish
Details: Buy to Open 3 Contracts July 21st $140 Calls @ $5.98 Debit per contract.
Total Risk: This trade has a max risk of $1,794 (3 Contracts x $598) based on a hypothetical $100,000 portfolio risking 2%. We suggest using 2% of your portfolio value and divide it by $598 to select the # shares for your portfolio.
Trend Continuation Signal: This stock is in a bullish trend and further upside is expected.
1M/6M Trends: Bullish/Bullish
Technical Score: 7/10
OptionsPlay Score: 99
Stop Loss: @ $2.99 Credit (50% loss).
Entering the Trade
Use the following details to enter the trade on your trading platform. Please note that whenever there is a multi-leg option strategy, it should be entered as a single trade.
Please note that these prices are based on Friday’s closing prices. Should the underlying move significantly during the pre-market hours, we will likely adjust the strikes and prices to reflect a more accurate trade entry.
Investment Rationale
As US equities powers higher and even broadens a bit, there is a risk-on sentiment, despite a dislocation with underlying fundamentals and economic numbers. One of our long holdings JPM has started to breakout above its recent trading range high of $144. We are taking this opportunity to add to our position for further upside and raising our stops on all contracts to the original breakeven price of $4.30. Adding 3 contracts of the July $140 Calls @ $5.98 Debit. By raising our stops an adding to a position we would risk a total of only roughly $500 for unlimited upside with a position size that is roughly 4% of our total portfolio value.
We also need to close AAPL from our portfolio as it marches past the $3 Trillion mark and losses exceed 100% of the premium collected.
$AXP
DailyPlay – Opening Trade (AXP) Closing Trade (ORCL) – June 29, 2023
Closing Trade
- ORCL – 59.25% Loss: Sell to Close 8 Contracts (or 100% of your Contracts) July 7th $111/$120 Call Vertical Spreads @ $1.96 Credit. DailyPlay Portfolio: By Closing all 8 Contracts, we will receive $1,568. We opened this trade @ $2.70 Debit and, resulting in an average cost of $270 per contract. The average loss per contract is therefore $141.50.
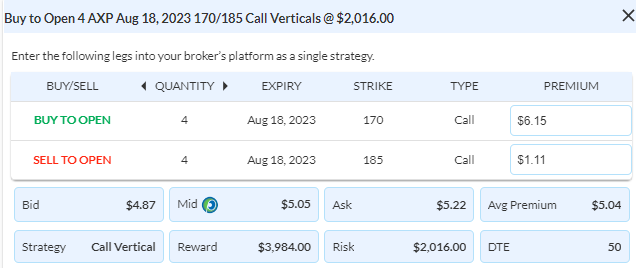
AXP Bullish Opening Trade Signal
View AXP Trade
Strategy Details
Strategy: Long Call Vertical Spread
Direction: Bullish
Details: Buy to Open 4 Contracts August 18th $170/$185 Call Vertical Spreads @ $5.05 Debit per contract. per contract.
Total Risk: This trade has a max risk of $2,016 (4 Contracts x $504) based on a hypothetical $100,000 portfolio risking 2%. We suggest using 2% of your portfolio value and divide it by $504 to select the # shares for your portfolio.
Trend Continuation Signal: This stock is in a bullish trend and is expected to continue higher over the duration of this trade.
1M/6M Trends: Bullish/Bullish
Technical Score: 8/10
OptionsPlay Score: 109
Stop Loss: @ $2.52 Credit (50% loss).
Entering the Trade
Use the following details to enter the trade on your trading platform. Please note that whenever there is a multi-leg option strategy, it should be entered as a single trade.
Please note that these prices are based on Wednesday’s closing prices. Should the underlying move significantly during the pre-market hours, we will likely adjust the strikes and prices to reflect a more accurate trade entry.
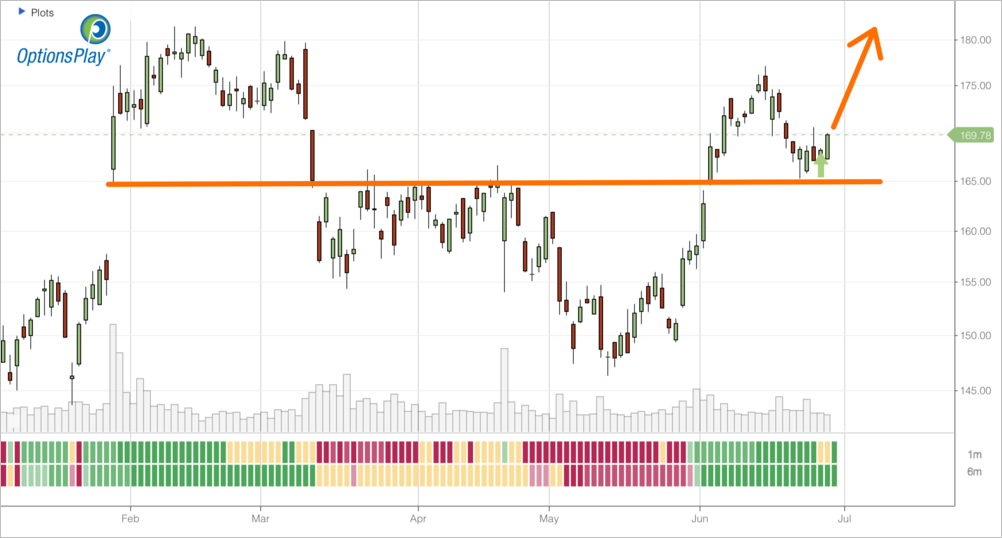
Investment Rationale
As consumers pull back with spending, they have become more selective, but travel remains one area where spending continues to rise. At the heart of this spending are with airlines and the credit card providers that benefit from this spend. American Express’s premium credit cards are the preferred card of travelers with the their Delta partnership driving nearly 1% of the US’s GDP in spending alone. AXP recently pulled back to its $165 breakout level and now provides an opportunity to buy on a pullback to an important support level. I’m looking to purchase the Aug $170/185 Call Vertical @ $5.04 Debit to play for a breakout higher. We also have been monitoring our ORCL position and it is now at risk of filling the earnings gap, so we are closing out our adjusted trade at a loss of $1,425, bringing the net gain on ORCL trade to $4,015 on the net position.
AXP – Daily