$BSX

DailyPlay – Opening Trade (BSX) – March 15, 2023
BSX Bullish Opening Trade Signal
View BSX Trade
Strategy Details
Strategy: Long Call
Direction: Bullish
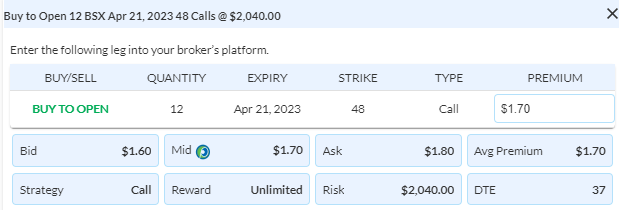
Details: Buy to Open 12 Contracts April 21st $48 Call @ $1.70 Debit per contract.
Total Risk: This trade has a max risk of $2,040 (12 Contracts x $170) based on a hypothetical $100,000 portfolio risking 2%. We suggest using 2% of your portfolio value and divide it by $170 to select the # contracts for your portfolio.
Trend Continuation Signal: This is a bullish stock that is expected to continue its uptrend.
1M/6M Trends: Bullish/Bullish
Technical Score: 9/10
OptionsPlay Score: 82
Entering the Trade
Use the following details to enter the trade on your trading platform. Please note that whenever there is a multi-leg option strategy, it should be entered as a single trade.
Please note that these prices are based on Tuesday’s closing prices. Should the underlying move significantly during the pre-market hours, we will likely adjust the strikes and prices to reflect a more accurate trade entry.
Investment Rationale
The SPX rose 1.7% on Tuesday as investors got an inline CPI number that created more comfort that the Fed may actually pause their rate hikes next week, while also getting a sense that the banking issue that hit the markets last week is subsiding. Badly beaten-down regional banks made substantial gains yesterday, recouping significant losses seen over the past few days. Using the weekly SPX chart, the trading range from the bullish and bearish Propulsion Momentum levels continue to be evident, and remains so barring a Friday close this week beneath last week’s close of 3862.
Yesterday we added to our morning Daily Play when I put out a midday update to exit a trim/exit a few more ideas we had on that moved enough to act on, given their proximity to expiration. We were also able to buy the TLT recommendation I put out yesterday morning, as it pulled back into the $104.50/$104 zone I was willing to get long a $104.5/$114 April 6th call spread. We got filled near $2.20.
For today, I see an idea to enter in a long call spread on a S&P 500 stock that is a hair shy from its all-time high. (Obviously, we don’t come across too many SPX names making that statement.) The name is Boston Scientific (BSX), and its chart suggests that a surge higher is likely coming, as price has repeatedly bottom over the past 4-6 weeks on the same level that stood as an almost 20-year resistance level, and more recently as a 3-year resistance level.
BSX – Weekly
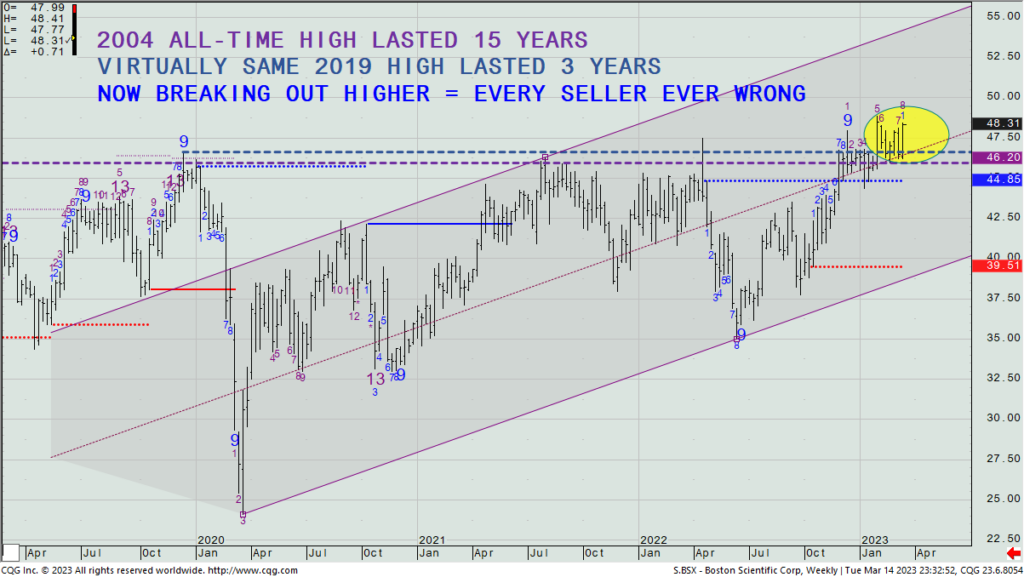
The next major catalyst is its earnings report in late-April, but given no seller has ever made money being a seller (as compared to a long-term holder), I’d look to buy a bullish call spread. The best way to play this, in my view, is to simply buy the April 21st $48 call for what yesterday closed at $1.70 mid (Selling the $55 call against it only yields a nickel, and there’s no strikes in between the $150 and $155.) So, this is basically a bet that the stock will close above $49.70 by then, and that’s only $1.40 (or 2.8%) above yesterday’s close. I think that’s reasonable.
$TLT
DailyPlay – Opening Trade (TLT) Closing Trade (SLV) Partial Closing Trades (GLD, SPOT) – March 14, 2023
Closing Trade
- SLV – 49.09% Gain: Buy to Close 1 Contract (or 100% of your Contracts) Mar 17th $20 Cash Secured Put @ $0.28 Debit. DailyPlay Portfolio: By Closing this Contract, we will be paying $28 Debit.
Partial Closing Trades
- GLD – 187.24% Gain: Sell to Close 2 Contracts (or 50% of your remaining Contracts) Mar 17th $168.50/$176.50 Call Vertical Spreads @ $6.98 Credit. DailyPlay Portfolio: By Closing 2 of the remaining 4 Contracts, we will receive $1,396 Credit.
- SPOT – 10.53% Loss: Buy to Close 2 Contracts (or 50% of your remaining Contracts) Mar 17th $125/$130 Call Vertical Spreads @ $2.10 Debit. DailyPlay Portfolio: By Closing 2 of the remaining 4 Contracts, we will be paying $420 Debit.
TLT Bullish Opening Trade Signal
View TLT Trade
Strategy Details
Strategy: Long Call Vertical Spread
Direction: Bullish
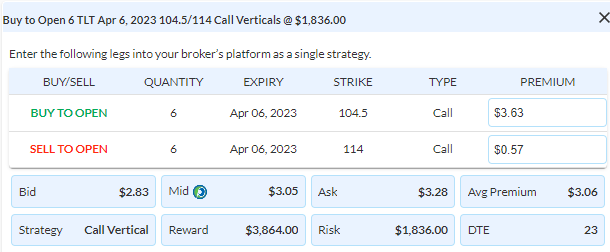
Details: Buy to Open 6 Contracts April 6th $104.50/$114 Call Vertical Spreads @ $3.05 Debit per contract.
Total Risk: This trade has a max risk of $1,836 (6 Contracts x $306) based on a hypothetical $100,000 portfolio risking 2%. We suggest using 2% of your portfolio value and divide it by $306 to select the # contracts for your portfolio.
Trend Continuation Signal: This is a bullish stock that is expected to continue its uptrend.
1M/6M Trends: Bullish/Bullish
Technical Score: 8/10
OptionsPlay Score: 109
Entering the Trade
Use the following details to enter the trade on your trading platform. Please note that whenever there is a multi-leg option strategy, it should be entered as a single trade.
Please note that these prices are based on Monday’s closing prices. Should the underlying move significantly during the pre-market hours, we will likely adjust the strikes and prices to reflect a more accurate trade entry.
Investment Rationale
Here’s the good and the bad from yesterday’s price action: Despite the market closing lower on the day, buyers were actually evident with the day posting an “open” candle, meaning that the close was above the open. That suggests institutional buying was seen into the weakness. The “bad” (in the case of overall market direction), is that the lower open relative to last Friday’s close and the lower weekly low gives us two of three steps needed to confirm the last Friday’s qualified weekly close beneath the bearish Propulsion level of 3864. Though this actually helps better define the likely next bigger move, should this Friday close beneath last Friday’s close, we’d see a new bearish qualified and confirmed bearish Propulsion Momentum level triggered, suggesting there’s enough new downside momentum at hand to set up a further decline to 3532, the bearish Propulsion Exhaustion target price. And from my perspective, the more significantly the 3864 level would be breached this Friday, the more likely that 3532 target is a good one.
SPX – Weekly
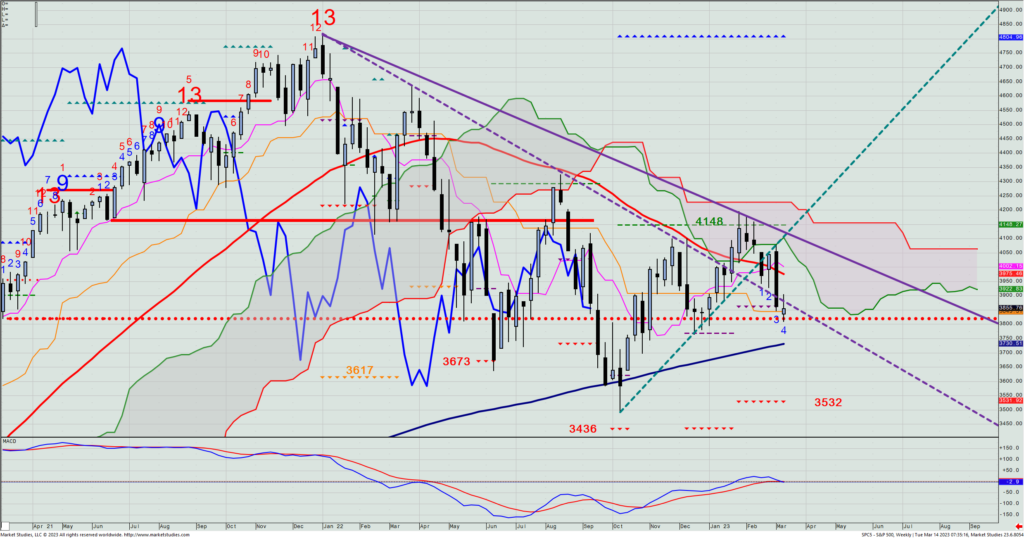
I write this now – only Tuesday of this week – to help give you my overall thinking of where odds change from what could still be a trading range market. If we see the SPX close above 3864 on Friday, then the signal is not officially triggered, and we may still be in the trading range bounded by that level and 4148 on top.
For now, we still have to deal with the inflation numbers coming out today and tomorrow, and of course, that means we can see the market move sharply depending upon how they come in versus expectations. Certainly, volatility has picked up with the VIX in the mid-20s from what was recently under 20.
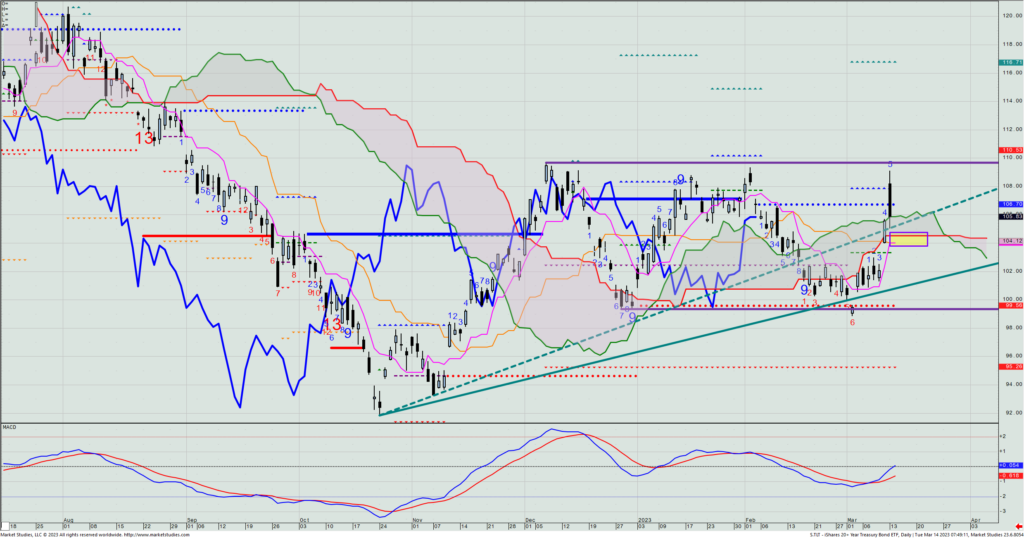
For a new Daily Play idea, I do think bond yields will not get back over 3.80% on this current move, and as such, I want to buy a minor pullback in the TLT. Looking at the daily chart, I would aim to get long into the highlighted yellow box, which is $104.50 to $104. This level could be seen today or tomorrow, so that if that occurs, we’ll want to buy the April 6th $104.5/$114 call spread for what is the then current bid/offer mid-price. (Yesterday, this closed at $3.06, or 32% of the strike differential).
TLT – Daily
$ADM
DailyPlay – Opening Trade (ADM) Partial Closing Trades (SPOT, GLD, CLX) – March 13, 2023
Partial Closing Trades
- SPOT – 31.58% Gain: Buy to Close 3 Contracts (or 40% of your Contracts) Mar 17th $125/$130 Call Vertical Spreads @ $1.30 Debit. DailyPlay Portfolio: By Closing 3 of the 7 Contracts, we will be paying $390.
- GLD – 98.77% Gain: Sell to Close 2 Contracts (or 1/3 of your remaining Contracts) Mar 17th $168.50/$176.50 Call Vertical Spreads @ $4.83 Credit. DailyPlay Portfolio: By Closing 2 of the remaining 6 Contracts, we will receive $966.
- CLX – 48.97% Gain: Sell to Close 2 Contracts (or 25% of your Contracts) Apr 21st $155/$145 Put Vertical Spreads @ $4.32 Credit. DailyPlay Portfolio: By Closing 2 of the 8 Contracts, we will receive $864.
ADM Bullish Opening Trade Signal
View ADM Trade
Strategy Details
Strategy: Short Put Vertical Spread
Direction: Bullish
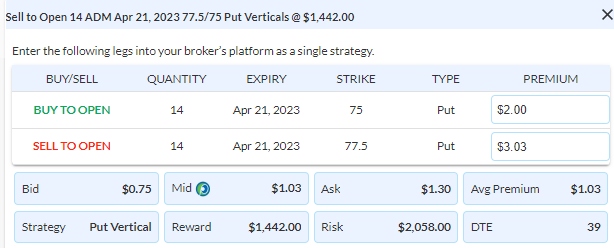
Details: Sell to Open 14 Contracts April 21st $77.50/$75 Put Vertical Spreads @ $1.03 Credit per contract.
Total Risk: This trade has a max risk of $2,058 (14 Contracts x $147) based on a hypothetical $100,000 portfolio risking 2%. We suggest using 2% of your portfolio value and divide it by $147 to select the # contracts for your portfolio.
Counter Trend Signal: This stock is currently trading lower but is expected to bounce higher from support.
1M/6M Trends: Bearish/Bearish
Technical Score: 3/10
OptionsPlay Score: 85
Entering the Trade
Use the following details to enter the trade on your trading platform. Please note that whenever there is a multi-leg option strategy, it should be entered as a single trade.
Please note that these prices are based on Friday’s closing prices. Should the underlying move significantly during the pre-market hours, we will likely adjust the strikes and prices to reflect a more accurate trade entry.
Investment Rationale
Stocks got rocked on Friday as the SVB story got worse, and California shut the bank. Regional bank stocks were walloped for significant losses, and all the mess dragged ths SPX down to 3862 – two points beneath the key support level I’ve targeted for a few weeks already as what needs to hold up to reduce the odds increasing of a test of the 2022 lows. Two points is just two close to make the call, but with last week’s downmove already qualified (by a lower Friday close two weeks ago relative to three Fridays ago), if this week sees a lower open on Monday morning; a lower low this week beneath last week’s low; and a lower Friday close relative to last Friday – we’d get a qualified and confirmed breakdown of that weekly bearish Propulsion Momentum level of 3864, with a Prop. Exhaustion level measured to 3532 (essentially, by chance, last year’s low area).
As I write this Sunday night, I see S&P futures up 50 points from their 4:15 settlement on Friday. This is no surprise, given just how close the SPX hugged that very important support level on Friday’s close. (If today doesn’t open lower at 9:30am, then the bearish Prop. Momentum signal cannot be made this Friday, regardless of how the market trades this week.) So, those who are in the bull camp got their ideal entry point right on the close Friday.
I’ve declared that we are likely in a trading range, bounded by approx. 4148 on the top and 3864 on the bottom. We’ve now seen both those levels trade in the past six weeks, so right now, we’ve got the main resistance and support levels pegged correctly.
I’m still in the camp that the market will likely ultimately head lower to test those 2022 lows – mostly from my belief that earnings revisions will fall sharply before all is said and done. And that will not come while seeing stocks hang out near being unchanged on the year; they will fall on those earnings estimates downward revisions when analysts realize that “The king has no clothes”.
We are up 32% on our short SPOT call spreads. They expire on Friday this week. Let’s take off 3 of 7 today.
We are up 99% on our long GLD trade. Let’s exit 2 of 6 of the long call spreads today.
We are up 49% on our long CLX put spreads. Let’s exit 2 of 8 of them today.
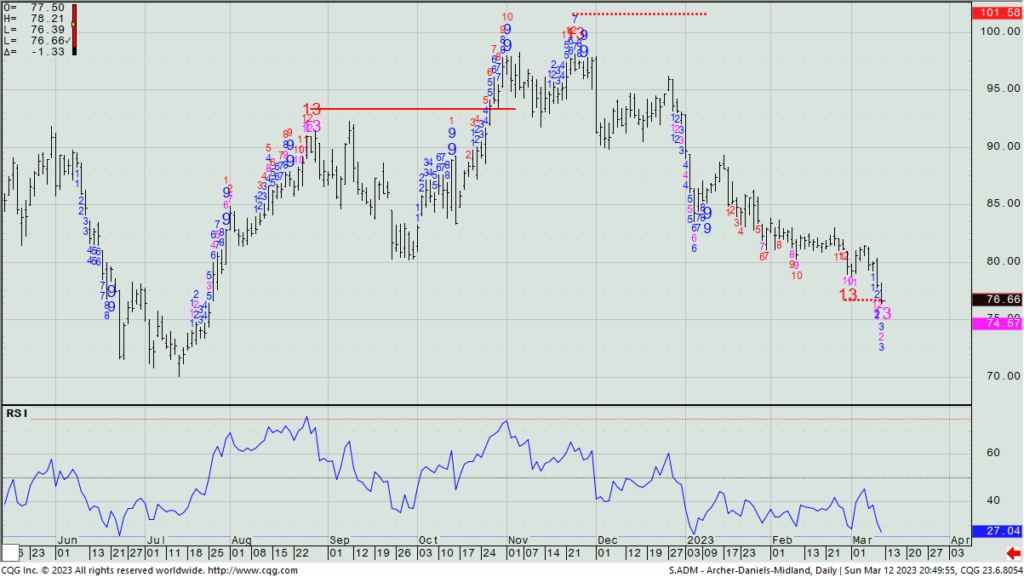
For a new trade idea, let’s play for a quick trading bounce in beaten down Archer Daniels Midland (ADM) as it had an active daily Sequential -13 signal from early March that has slid to its Risk level while also marking a new Combo -13 signal on Friday. Calls are too pricey, so let’s look to sell the April 21 $77.5/$75 put spread for what was priced on Friday’s close at $1.03 mid. It collects 41%.
ADM– Daily

DailyPlay Updates – March 10, 2023
Investment Rationale
Investors faced new bearish news on Thursday, with Silicon Valley Bank (SIVB) coming under selling pressure that you rarely see from a S&P 500 name. It dragged other financial stocks lower on concerns of spillage to other banks, and the SPX closed down 74 points in what proved to be a very ugly session.
SPX – Daily
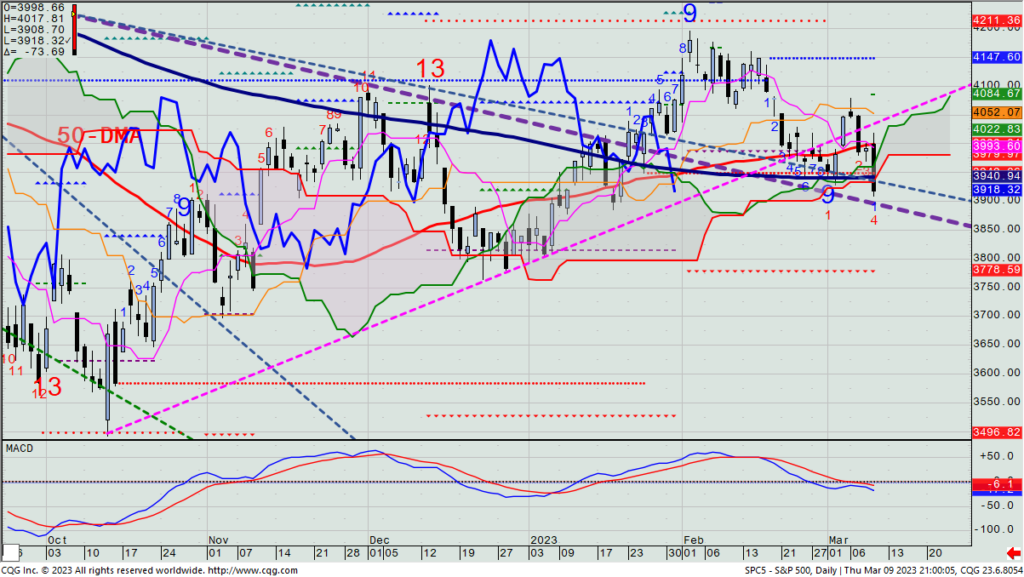
This picture is a worsening one, now trading lower than the early March low, and potentially heading next to test the December lows and the Propulsion Exhaustion target at 3779. Obviously, today’s unemployment report and next week’s inflation numbers will materially affect the Fed’s rate change on Wednesday March 21. The one thing I can tell you is that I will continuously look to fade market rallies so long as the SPX remains beneath 4148. In SPY terms, that resistance is likely now in the 401 to 404.50 zone. Should we get up there today or any day next week, I’d be leaning into that rally to stay with the idea of reducing overall long-term exposure to the market – something I’ve personally been continuously doing for the past 12 months.
DailyPlay Updates -March 9, 2023
Investment Rationale
Stocks see-sawed most of yesterday’s session, but in the end, the SPX closed up 6 points. Fed Chair Powell is done with his testimony, and today may be a quiet one as most investors will wait for tomorrow’s unemployment report before potentially making new commitments to the market. Powell made it clear that the jobs report and next week’s CPI figure will influence their rate decision next Wednesday.
I have now just spent over 45 minutes looking for a new DP for today, and almost every name I looked at is above near-term support and beneath near-term resistance, just as the SPX is. With a big number coming out tomorrow, I will reiterate what I said in Monday’s webinar: Don’t push to trade this week. (In fact, I did a video on the subject “Sometimes the Best Trade is Not to Trade” for my InTheKnowTrader.com site on Tuesday. It’s available for anyone to watch for free on YouTube. Here’s the link: https://youtu.be/F4tcBUzFX_Y.)
If you’ve been watching the market movement this week, other than the decline after Powell’s comments on Tuesday, it’s been very choppy and directionless. Tomorrow will be the next catalyst for a potential decent directional move, and much of it will likely be done before the NYSE even opens. Again, unless you think that you personally have a major edge over some of the smartest people and computers on the Street, trying to guess which way the market will move tomorrow, today, is not a game I want to play while we’re in between important support and resistance levels. I hope you’re not disappointed that I’m not putting out a new idea today, but I can tell you that I have absolutely no plans to trade today knowing how important tomorrow’s number will be. I look at it as preservation of my capital, but I’m also waiting for the market to get out of its trading range and make a more definitive directional move that we then have a greater chance of further exploiting.
Any market pundit who tells you with high confidence which way the market is going is simply hoping they are correct (and is silently very much worrying that they are not). But the reality is that right now, no one can really know if the strength of the economy will be offset by the bond market’s indication of a recession. So, take the bullish bias of the Tom Lee’s of the world and the bearish stance of the Mike Wilson’s of the world, and put them on the backseat. Neither has been right at all this year, nor even been willing to adapt to what the market is actually saying. Right now, I’m neutral the market, and staying with that call until I have evidence that the next real move is at hand.
$BYND

DailyPlay – Closing Trade (BYND) – March 8, 2023
Closing Trade
- BYND – 9.78% Gain: Sell to Close 2 Contracts (or 100% of your remaining Contracts) Mar 17th $17.50/$22.50 Call Vertical Spreads@ $1.01 Credit. DailyPlay Portfolio: By Closing the remaining 2 Contracts, we will receive $202. We partially closed this trade on Feb 17 at @ $1.15 Credit when we closed 50% of our Contracts, then again on Feb 23 at $1.16 Credit. Our average cost basis on this trade is, therefore $1.12 and our average gain is 21.47%.
Investment rationale
“Economic data have come in stronger than expected, which suggests that the ultimate level of interest rates is likely to be higher than previously anticipated,” was not what bulls wanted to hear from Fed Chair Powell. Stocks sold off and never recovered, edging lower as the day wore on, with the SPX closing right near its daily low and down 62 points. Yesterday’s chart created a bearish “evening star” pattern, while also filling the closing gap from last Thursday and Friday’s price action – something I had previously stated would likely happen this week barring very bullish Powell comments.
SPX – Daily
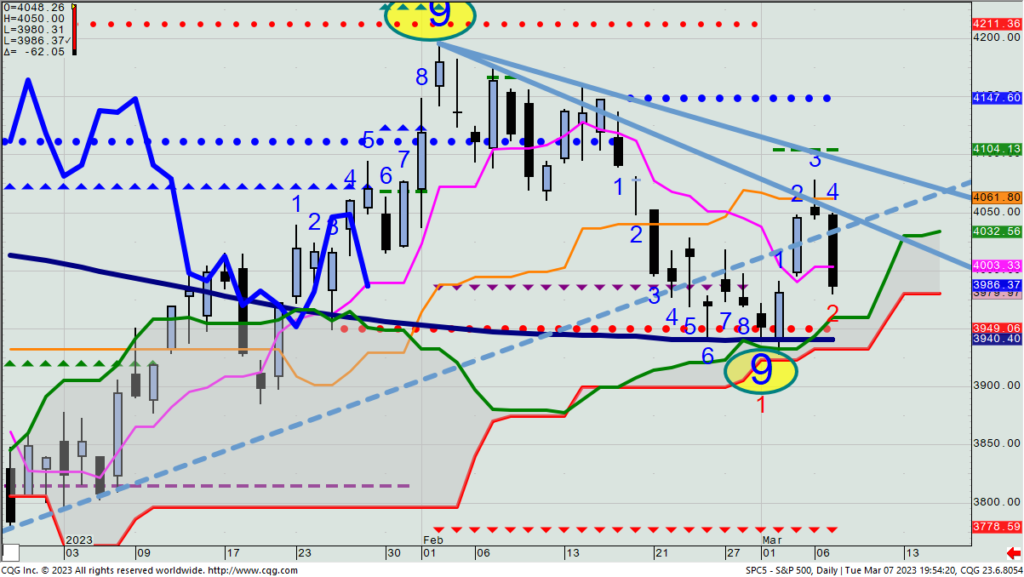
Before we get too bearish, today is another day of Powell testimony, and we need see what investors do with yesterday’s downmove. Friday is the key unemployment report (directly relating to not only the Fed’s mandate to maximize employment, but as they claim they are “data dependent”, will be a major input into deciding what to do with rates next week, along with the upcoming CPI figure that directly relates to their other mandate of lowering inflation). So, as much as we think we got a clue on Tuesday as to what direction the market is now going to move, I want you to also be aware that there is lots more info coming in the next week that can materially influence market direction – potentially enforcing yesterday’s downmove, or potentially moving things in the opposite direction.
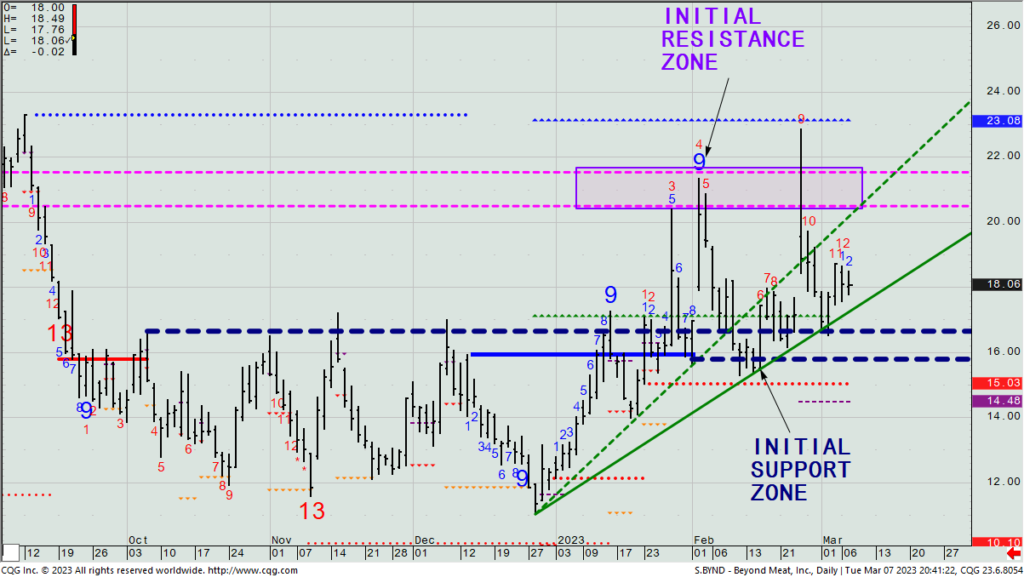
We are long 2 BYND March 17th $17.5/$22.5 call spreads, up just 10%. The stock closed yesterday at $18.06. We paid $0.92 cents for our position, and it went out yesterday at $1.01 mid. With it sitting in between the two trendlines drawn below, and 9 days to go with no major catalyst from now till then, I have no issue with you exiting this trade now.
BYND – Daily
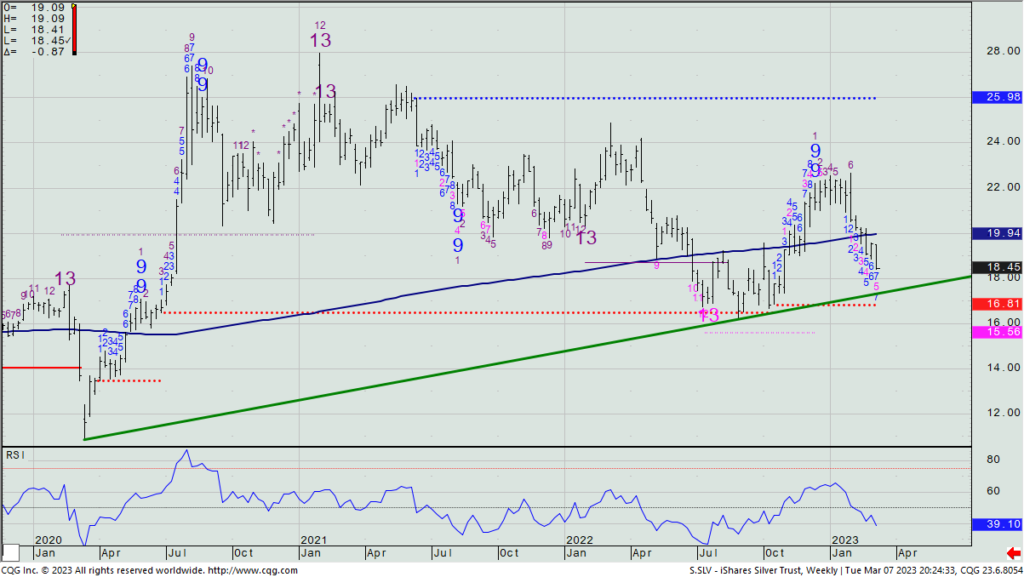
Yesterday’s fears of still higher-to-come rates pushed the dollar higher and knocked the recent gold rally right back down to where it was before last week’s bottom was made. Silver lost substantially more, as it often does when economic fear pulls metals lower, as it is far more of an industrially-used metal than is gold.
We are also short an SLV March 17th $20 put that we sold for 55 cents. With SLV trading $18.45, we’re down about $100 on the option position. Personally, I don’t have a problem getting exercised in 9 days and taking ownership of the 100 shares; I like silver over time. It’s up to you if you just want out and take a $100 loss, as it does look like it can head lower to finish the Setup -9 count in two more weeks.
SLV – Weekly
$COIN, $GLD, $GE
DailyPlay – Closing Trade (COIN) Partial Closing Trades (GLD, GE) – March 7, 2023
Closing Trade
- COIN – 3.07% Loss: Buy to Close 1 Contract (or 100% of your remaining Contracts) Mar 10th $70/$54 Put Vertical Spread @ $7.71 Debit. DailyPlay Portfolio: By Closing the remaining Contract, we will be paying $771. We partially closed this trade on Feb 23 at 9.70 Debit when we closed 50% of our Contracts. Our average cost basis on this trade is, therefore $8.71 and our average loss is 16.38%.
Partial Closing Trades
- GLD – 50.21% Gain: Sell to Close 3 Contracts (or 1/3 of your Contracts) Mar 17th $168.50/$176.50 Call Vertical Spreads@ $3.65 Credit. DailyPlay Portfolio: By Closing the 3 of the 9 Contracts, we will receive $1,095.
- GE – 68.13% Loss: Sell to Close 3 Contracts (or 50% of your remaining Contracts) Mar 24th $83/$77 Put Vertical Spreads @ $0.51 Credit. DailyPlay Portfolio: By Closing 3 of the remaining 6 Contracts, we will receive $153.
Investment rationale
Stocks were higher most of the day, but then a late decline actually took the SPX in lower territory before closing up 3 pts. No surprise; I don’t expect much to happen before Fed Chair Powell testifies today and Wednesday, and the big employment report comes out Friday morning. So, as I made it abundantly clear in yesterday’s weekly webinar, don’t push to trade until you have more sense of which direction the market is likely going to make its real move.
Yesterday’s daily SPX chart is below. Notice it stopped against the first of two downtrend lines that can be drawn and the Base Line. It would not surprise me if this backfills to the gap area from last Thursday to last Friday unless Powell makes investors very bullish this week.
SPX – Daily
Looking at open positions, let’s look to close the remaining COIN trade that expires on Friday. It’s hard to think that it can go back up to and past $70 in the next few days with it just under $63 now, and we’re virtually breakeven on them.
Let’s take profits on 3 of 9 GLD March 17th $168.5/$176.5 long call spreads as we’re up 50% on them.
Let’s also remove 3 of 6 GE March 24th $82/$77 long put spreads. We’re down 66% on them with 17 days to go, and the stock is trading near $87.
We’ll see if Powell moves markets at all later today, and potentially adjust more positions tomorrow. Don’t forget that even after this week’s Fed-speak and data comes out, next week we get the all-important CPI and PPI numbers. So, even a move this week can potentially get unwound next week depending upon how the numbers come in.
$AKAM
DailyPlay – Opening Trade (AKAM) – March 6, 2023
AKAM Bullish Opening Trade Signal
View AKAM Trade
Strategy Details
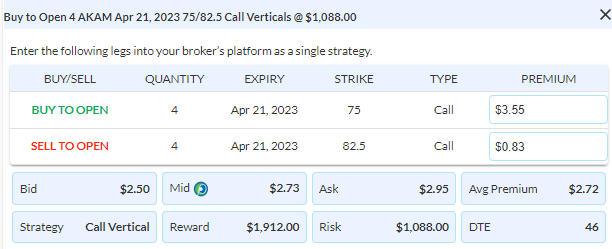
Strategy: Long Call Vertical Spread
Direction: Bullish
Details: Buy to Open 4 Contracts April 21st $75/$82.50 Call Vertical Spreads @ $2.73 Debit per contract.
Total Risk: This trade has a max risk of $1,088 (4 Contracts x $272).
Counter Trend Signal: This sock is currently trading lower but is expected to bounce higher from support.
1M/6M Trends: Bearish/Bearish
Technical Score: 2/10
OptionsPlay Score: 106
Entering the Trade
Use the following details to enter the trade on your trading platform. Please note that whenever there is a multi-leg option strategy, it should be entered as a single trade.
Please note that these prices are based on Friday’s closing prices. Should the underlying move significantly during the pre-market hours, we will likely adjust the strikes and prices to reflect a more accurate trade entry.
Investment Rationale
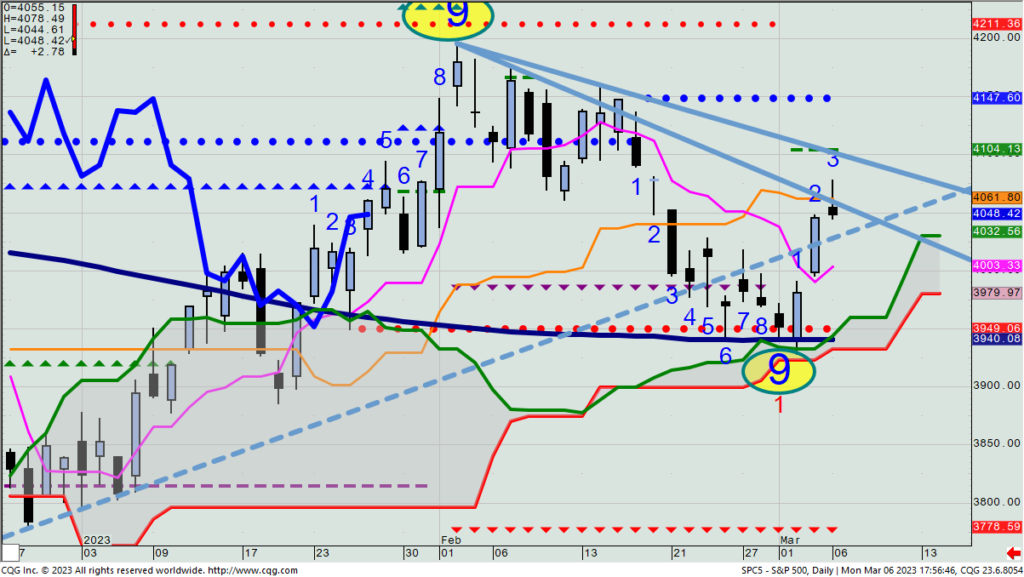
The rally that started on Thursday continued throughout Friday, as stocks posted a significant two-day gain right from where I called it would likely come from. At this point, I look at both last week’s low and February’s high as significant levels to key on in the short term. As of now, no one with a strong bullish or bearish view has been rewarded in 2023, but those who have traded the range – as we have – have been in much better shape.
Here’s a new idea: With Akamai (AKAM) having marked a daily Sequential -13 and Setup -9 at the very end of February, the three-day rally has taken it out of further near-term danger. Right now, the calls are a bit expensive, and selling ATM put spreads yields only 30% — hardly ideal.
AKAM – Daily
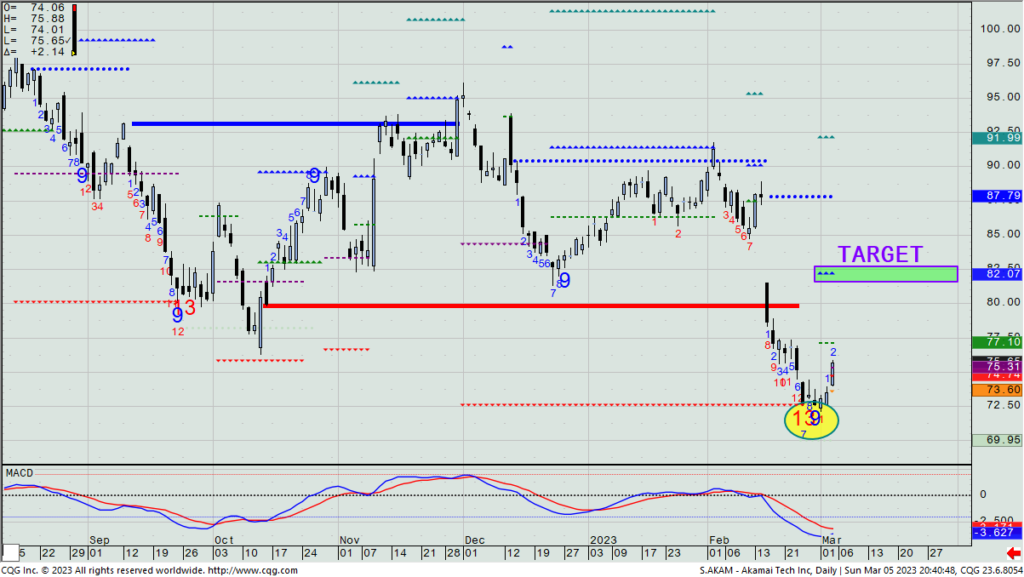
So, let’s get a bit more tactical by buying only a 1% position (vs. the standard 2%) in a bullish April 21 $75/$82.5 call spread. (This closed at $2.73 mid on Friday, or about 36% of the strike differential.) Then, let’s also look to buy the other half position of the same series and strikes if we see a pullback any day this week to the unfilled gap between $74 and $73.50. We’ll buy this at what the then current mid-price is. My upside target is when the stock reaches ~$87.79 (where we see the green highlighted Propulsion Exhaustion level).
$IBB
DailyPlay Updates – March 3, 2023
Investment Rationale
Stocks did a solid turnaround yesterday from early weakness, and it was pretty much on cue, as yesterday’s DP suggested a trading bottom was very possible – given the lineup of concentrated support levels between 3950 and 3923 – along with a daily Setup -9 count.
SPX – Daily
We have an XLF long $35.5/$32.5 put that expires today. Yesterday’s decline in it finally put the $35.5 put in the money – albeit by only a small amount. I leave it in your hands whether you want to exit early today or hold this late into today’s session to have a chance of those $35.5 puts being worth something to recoup the bulk of the time premium we saw erode from our original purchase price. (I’d not worry about exiting the $32.5 put as it’s some 8-9% away from price.)
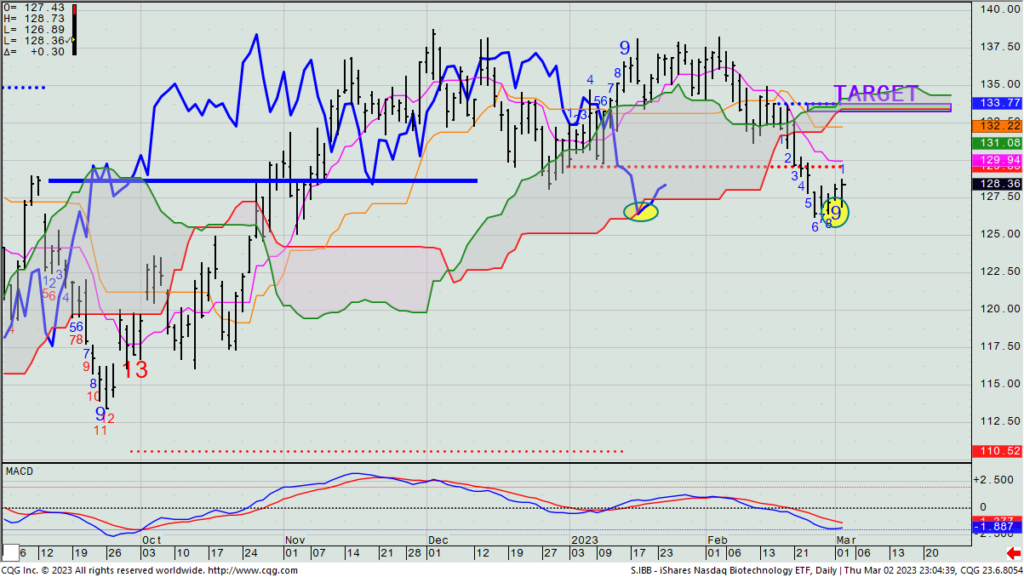
Here’s an idea that we might be able to make some quick money on, but as calls are too expensive and selling puts aren’t taking in enough credit, consider buying the iShares Nasdaq Biotechnology ETF (IBB). Wednesday marked a Setup -9 and its Lagging Line bounced right from the bottom of its cloud. At ~$126 per share, stay in our guidelines of approx. 2% of your portfolio for position sizing. Stop out the long on a close or consecutive daily ones (your choice) under $127.39. Play for a move up to $133.25/.75.
IBB – Daily
$CRWD
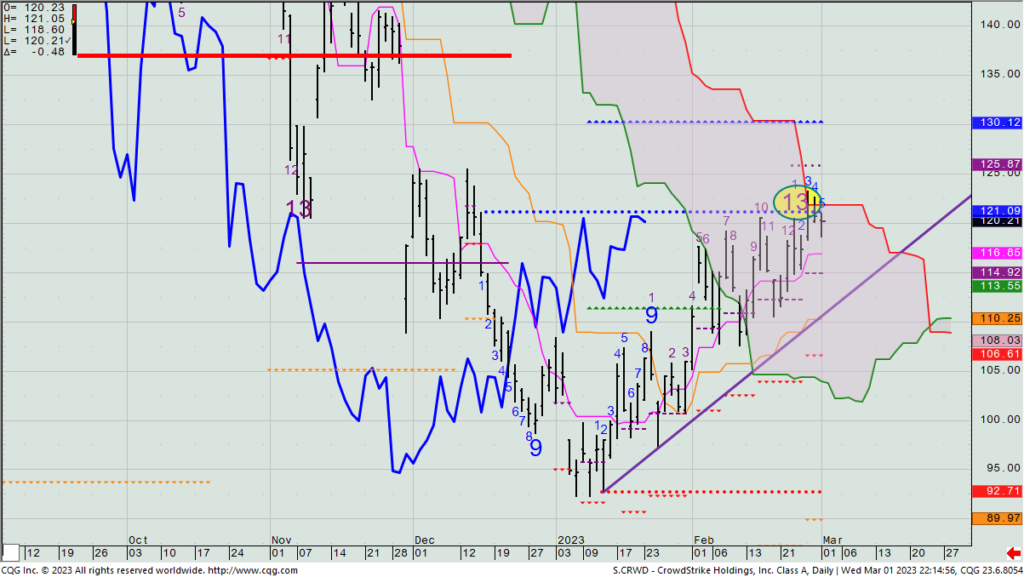
DailyPlay – Closing Trade (CRWD) – March 2, 2023
Closing Trade
- CRWD – 30.15% Gain: Sell to Close 1 Contract (or 100% of your Contracts) Mar 10th $94/$130 Call Vertical Spread @ $23.18 Credit. DailyPlay Portfolio: By Closing the 1 Contract, we will receive $2,318.
Investment rationale
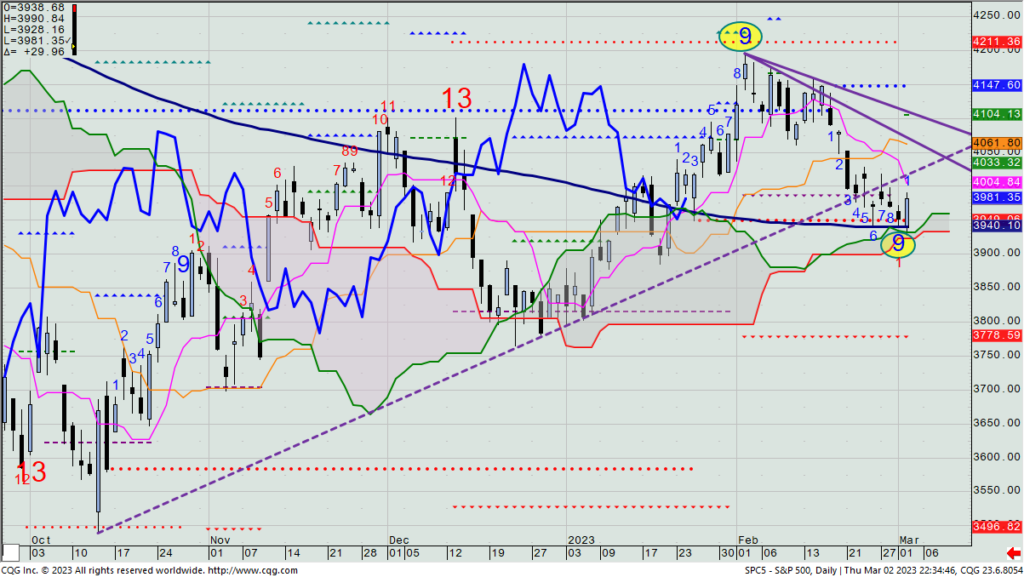
UST 10-yr. rates are now just a tick under the 4.0% level, and equity investors are not taking kindly to the recent surge in yields. Yesterday saw further S&P 500 selling, with the benchmark index down to 3951, just 11 points above its 200-DMA and now only about 110 points above the Dec. 31 closing mark – meaning that investors have now seen the market give up 240 points from its 2023 closing high. Those who have stayed bullish have paid the price of sticking with their conviction in a market that I do not think will yet pay steadfast bulls or bears.
SPX – Daily
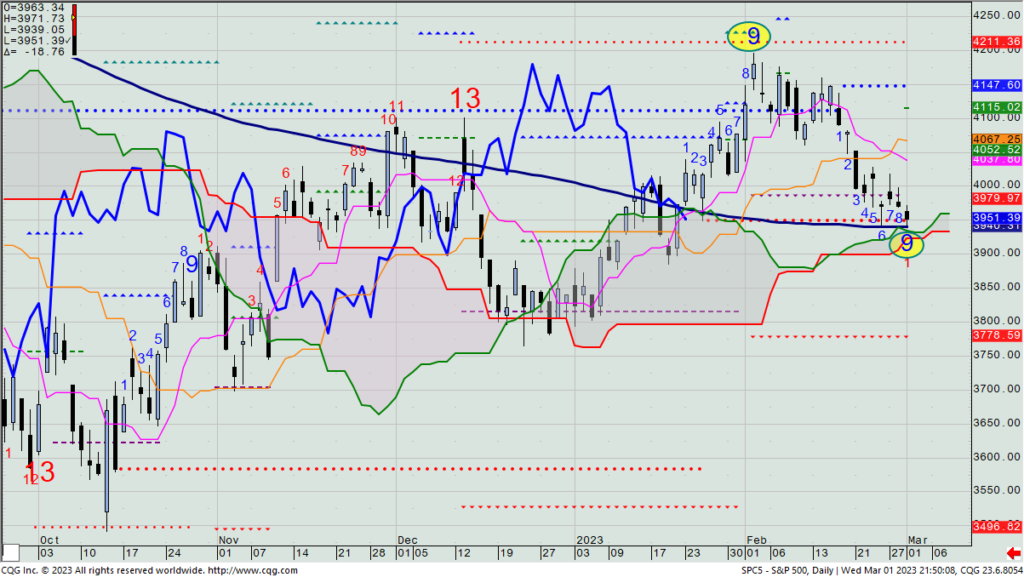
As I mentioned yesterday morning, the SPX would likely mark a daily Setup -9 count on Wednesday, and with it also having sold down to its TDST Line support (3949) and near its 200-DMA (3940) and cloud high and low (3933 and 3923, respectively), we are at an important inflection point.
I don’t know which way this is going to trade from here, but I’d be carefully watching the dollar and fixed income markets for clues, because I don’t think the SPX is gonna stick around here very long at all. Either a kerplunk comes in the next few days, or a rally back to 4025-4050 will likely occur. (BTW- the ICE BofA credit spread we always watch has widened out 10 bps. from its recent low. That came right from its major uptrend line, suggesting some increased macro concerns.)
We have an XLF option that expires tomorrow. We’ve lost the bulk of the debit cost on the put spread, but price ($35.60) is right near our long strike price of $35.50, so I think we need hold this position till tomorrow to have a chance of recouping some of the premium paid.
We are also long a single CRWD March 10th $94/$130 call spread. The stock marked a +13 signal three days ago, and these past three days has also stalled right at the top of the daily cloud as well as against its TDST Line. If we had multiple contracts on, I’d be taking half off, but as we only have one, you need make a decision as to possibly seeing this breakout upside now and running to $126/$130, or seeing it fall to $115ish. (Personally, I’d now exit on any daily close that is less than the close from four days prior.)
CRWD – Daily