
$WBA

DailyPlay – Conditional Opening Trade (WBA) Closing Trade (LEN) – December 15, 2022
Closing Trade
- LEN – 91.02% Gain: Buy to Close 1 Contract Dec. 16th $82.50/$77.50 Put Vertical Spreads @ $0.15 Debit. DailyPlay Portfolio: By Closing the remaining 1 Contract, we will be paying $15. We took partial profit on this trade on December 2 when we Closed 1 Contract @ $0.59 Debit, and then again on December 12 when we Closed 1 Contract @ $0.62 Debit. Our average gain on this trade is 72.85% and our average cost basis to exit this trade is $0.45 Debit.
WBA Bearish Opening Trade
View WBA Trade
Strategy Details
Strategy: Short Call Vertical Spread
Direction: Bearish
Details: Sell to Open 26 Contracts Dec. 30th $41.50/$42.50 Calll Vertical Spreads @ $0.27 Credit.
Total Risk: This trade has a max risk of $1,898 (26 Contracts x $73).
Counter Trend Signal: This is a Bearish trade on a stock that is experiencing a neutral to bullish trend.
1M/6M Trends: Neutral /Bullish
Technical Score: 6/10
OptionsPlay Score: 97
Entering the Trade
Use the following details to enter the trade on your trading platform. Please note that if there is a multi-leg option strategy, it should be entered as a single trade.
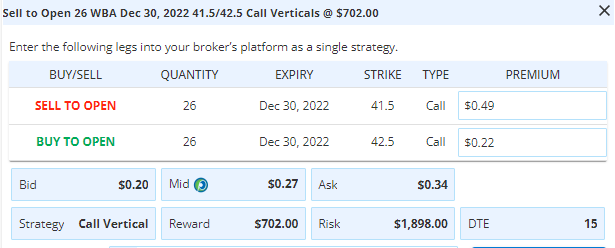
Please note that this is a CONDITIONAL trade. We will only enter the trade when the condition is met, which is IF we see a MOVE UP TO $41.45. Also note that the cost basis, premium paid, as well as the number of contracts when we open this trade will therefore be different from what we post today. This condition is only valid for a week unless advised otherwise.
Investment Rationale
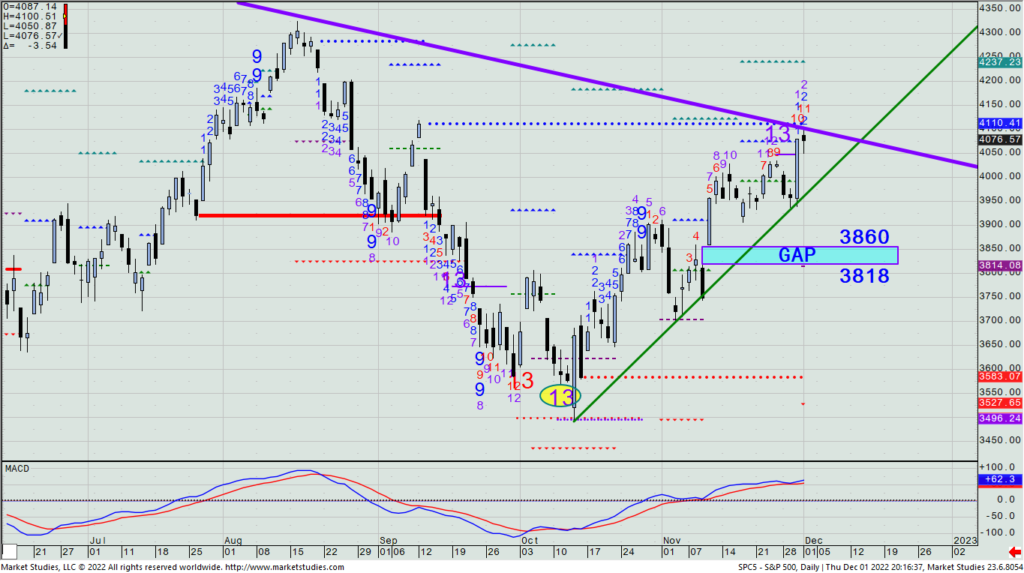
The Fed’s 50 bp. rate hike was expected; Chair Powell’s comments were not unexpected (i.e., “rates stay higher for longer”; “won’t stop until the job gets done”); and yet, the SPX sold off from near a 35-pt. gain and turned into a day with a 24-pt. loss. My view on why the turnaround? Because bulls heard nothing particularly positive from Powell, and this rally has largely been based upon hearing just that tone.
We now have gotten the key economic data that we’re going to get between now and year’s end. And yet, we find the market is very close to where it was going into Tuesday’s CPI release, meaning that neither bull nor bear has any more decided edge than they did two 48 hours ago. Which to me, makes it less clear as to what the market will do between now and New Years. But what I will say is that my bearish stance does not get shaken until and if it’s proven wrong. With the SPX resistance area I’ve highlighted several times still capping the rally – and the spike high on Tuesday failing right by the daily bullish Propulsion Momentum level (4148) – I still have a decent sense of where I want to see the SPX hold beneath.
Lennar reported after the bell yesterday, and last I looked the stock was down about $2 near $88.50, and well-above the $82.50 short strike we have on in a Dec. 16th $82.5/$77.5 put spread. his expires tomorrow, so let’s exit today the last spread we have on. It’s been a good trade for us.
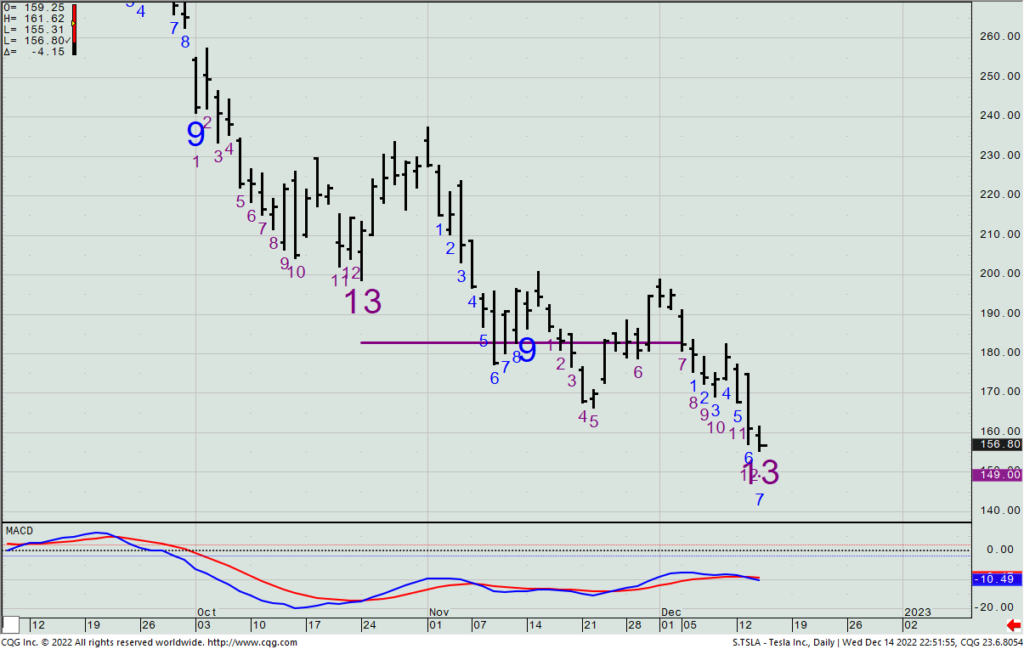
But we also need look at a bad one we have, too. We are long a TSLA Dec. 30th $190/$225 call spread. We’re down 93% on it, and I’m hoping that in the next few days it sees some type of bounce from a new daily -13 signal yesterday to help reduce the loss. This one never went our way. (It happens.) It’s another good reason why we keep our trades to a max. 2% on any single trade.
TSLA – Daily
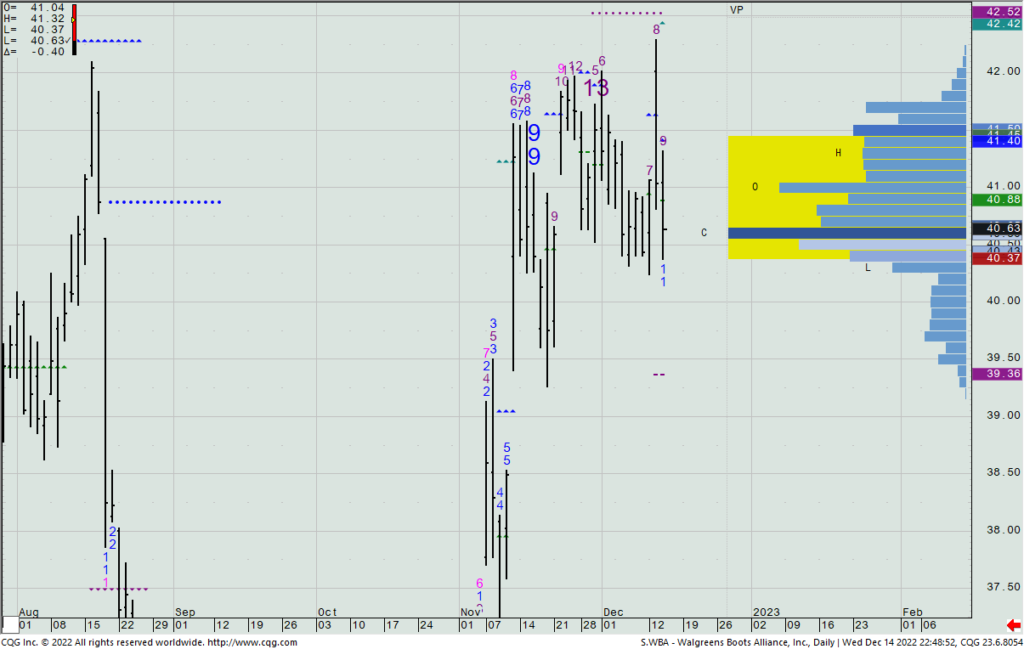
After spending over two hours tonight looking for a new trade I can live with, I see one potentially lining up in Walgreens Boots (WBA). The below chart shows a Volume at Price indicator for the past month of trading, with the highlighted yellow zone representing where the first standard deviation (~68%) of the volume was traded. Given the range over the last two days, I would think that in the next few trading days (let’s say by Tuesday’s close next week), it is not a stretch to think that the top of that yellow zone (currently $41.45) may very well trade again. If it does, I’ll then want to short a Dec. 30th $41.50/$42.50 call spread (my assumption being that this will not make a new December high before Dec. 30th expiration). Based upon where the current ATM/$1 OTM call spread is trading, if you can then collect the same ~50% of the strike differential that one can get now – a fair but not necessarily an advantageous price for the spread – we’d look to do that as a short-term trade into year’s end.
THIS IS A CONDITIONAL TRADE NEEDING A MOVE UP TO ~$41.45 TO ENTER THE SHORT CALL SPREAD.
WBA – Daily
$V

DailyPlay – Closing Trade (V) – December 14, 2022
Closing Trade
- V -85.4% Loss: Sell to Close 4 Contracts Dec. 16 $205/185 Put Vertical Spreads @ $0.74 Credit. DailyPlay Portfolio: By Closing all 4 Contracts, we will be receiving $296.
Investment Rationale
The better-than-expected CPI figure gave the market an instant boost when it got released yesterday at 8:30am, taking S&P futures from about a 30-pt. gain to over a 100-pt. gain in very short order. The bulls seemingly had their reckoning, and the Tom Lee’s of the world were celebrating their believed prescient bullish calls.
But, as I wrote you yesterday in the DP email, a bullish move today would mark a Sequential +13 signal, potentially getting many bulled up at precisely the wrong time. Later in the morning, I sold the largest single trade position I have ever put on in the fund I trade for, shorting $5mm worth of S&P futures. I plan on holding them for several days if today’s Fed announcement doesn’t force me out of the trade, but having sold higher I also have some cushion to play with.
SPX – Daily
We have two option positions on that expire on Friday: one in Visa and one in Lennar. As mentioned yesterday, Tony suggested getting out of the Visa trade yesterday. Added my own thoughts to that it might just pay – at this point and the large loss – that perhaps it made sense to hold on till today to see if for any reason the market plunked after the Fed announcement. Either way, you want to be out of it by no later than Thursday’s close.
Lennar reports today after the close. We still have one of three short put spreads on in it, and with it having closed at $90.59 yesterday and our being short a Dec. 16th $82.5/$77.5 put spread, we have almost a 10% cushion to the downside before the remaining spread would move against us. Thus, we’ll take our chances and hold this through tomorrow, but will exit it fully by Thursday’s close.
Lastly, look at how the market bottomed in October after the bearish CPI report came out, and what possibly could be how it topped yesterday after a bullish CPI report came out. They look very mirror-like – but inverted. So, I continue to be a bear up here until proven wrong.
S&P 500 Futures – Daily

DailyPlay Updates – December 13, 2022
Investment Rationale
A solid up day yesterday brought the SPX from recent support to a 50-point gain, and as much as this looks good to the average eye, it also marked a daily Standard Sequential +12 count, meaning that all today need do is open or close above 3977.02 AND also trade as high as 4027.26 to mark the +13 today. It should not go unnoticed by institutional players who know this model. However, they may not do anything until Wednesday’s Fed announcement/press conference, BUT, if the news is bad the 13 count is going to bring on even heavier selling than if it wasn’t there. (Something to keep note of.)
SPX – Daily
Yesterday we significantly trimmed several positions; most of them longs. As I explained on Monday’s webinar, anytime you have a big outside catalyst to meaningfully push a market one way or another, I often take down trading exposure so that a bad result wouldn’t kill all the hard work/profits put in and made over the past several weeks. Successful trading is about risk management, and I much rather be cautious than hope that a number comes out in a way that helps my positions. (Which also means that if you like what you hear tomorrow from the Fed, you can always put back on what you took off. That’s much easier to do than get out of something when it’s moving quickly against you.)
With today’s CPI number released at 8:30 am ET today, we’ll have a good clue as to investors’ take on what the Fed may very well do tomorrow. We certainly could see an SPX 100-pt. move happen tomorrow – even in just in the last 90 minutes of trading – so make sure you are on top of positions that need to be monitored.
Though I know this could disappoint some, I am not putting on any new option positions until after tomorrow’s Fed statement. I think it the prudent thing to do, given the possibility of them either creating or killing the chance for a Santa Claus rally. And as none of us have a clue as to which way they are going to lean on that choice, I don’t need to put on new exposure today that could possibly be down or up 50-100% a day later. (But of course, you are always free to do as you see fit that best suits your own risk tolerance.)
I spoke with Tony yesterday and he suggests taking off the long Visa Dec. 16th $205/$185 put spread we have on that expires on Friday. (At this point, I’d personally wait until we see what happens Wednesday afternoon on the odd chance that the market dives.) Also, Lennar (LEN) reports after the close on Wednesday. As we have 1 of 3 remaining bullish spreads in it and have made good money on the two spreads we’ve already exited, I will likely hold it until we see what it does on Thursday. It expires on Friday and will be out of it by Thursday’s close regardless.
$UNG, $LEN, $GNRC, $GE, $MDT
DailyPlay – Partial Closing Trades (UNG, LEN, GNRC, GE, MDT) – December 12, 2022
Partial Closing Trades
- UNG – 71.15% Gain: Sell to Close 10 Contracts October 21, 2022 $27/$24 Put Vertical Spreads @ $0.89 Credit. DailyPlay Portfolio: By Closing 10 of 20 Contracts, we will be receiving $890.
- LEN – 62.87% Gain: Buy to Close 1 Contract Dec. 16th $82.50/$77.50 Put Vertical Spreads @ $0.62 Debit. DailyPlay Portfolio: By Closing 1 of 2 Contracts, we will be paying $62.
- GNRC – 65.00% Loss: Buy to Close 2 Contracts Dec 23rd $100/$95 Put Vertical Spreads @ $3.30 Debit. DailyPlay Portfolio: By Closing 2 of 3 Contracts, we will be paying $660.
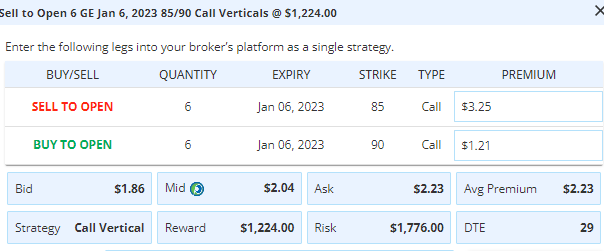
- GE – 48.98% Gain: Buy to Close 2 Contracts Jan. 6th $85/$90 Call Vertical Spreads @ $1.00 Debit. DailyPlay Portfolio: By Closing 2 of 6 Contracts, we will be paying $200.
- MDT – 23.65% Loss: Sell to Close 4 Contracts Jan 20th $80/87 Call Vertical Spreads @ $1.55 Credit. DailyPlay Portfolio: By Closing 4 of 10 Contracts, we will be receiving $620.
Investment Rationale
With the big CPI number out tomorrow and FOMC rate announcement/press conference on Wednesday, investors are poised for a potential game-changing move into year’s end. (These numbers will likely be THE driver of which direction we see trade through New Year’s.)
I remain in the camp that the Fed is not likely going to provide a Santa Claus rally, as I think they are lacking in enough data to make any type of pivot that staunch bulls are looking for. And without that potential bull move from positive numbers/comments, I think the bulls’ calls for a move to 4400 or even 4500 by year’s end is simply farcical.
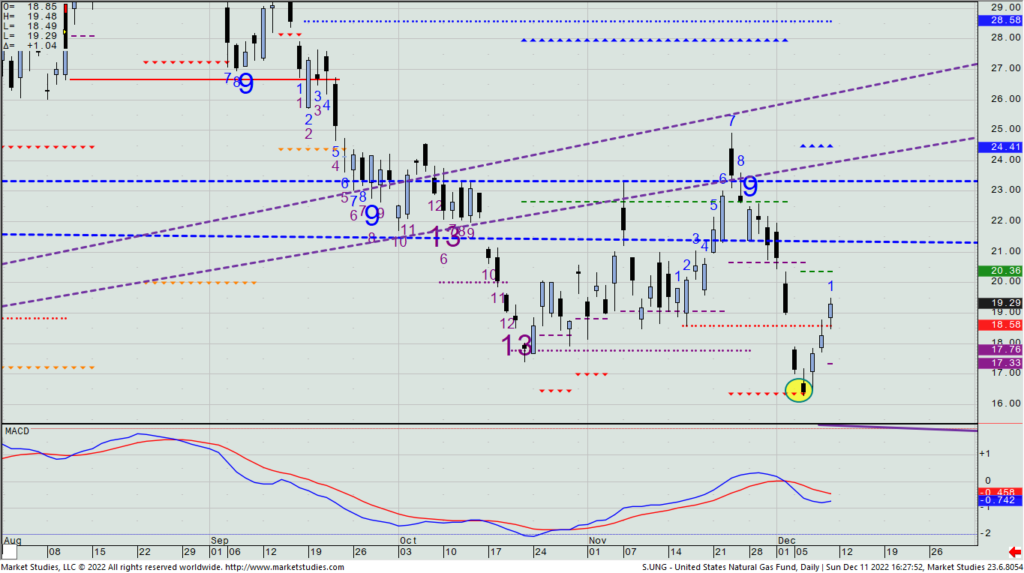
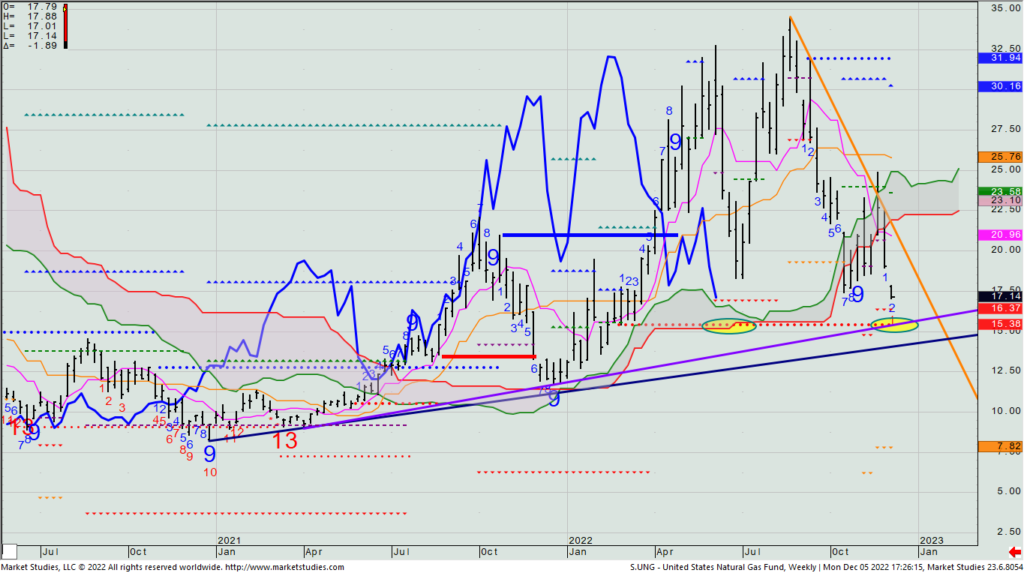
I do want to reduce some exposure before these numbers come out, making today the day to make the bulk of adjustments. Firstly, let’s remove 50% of our 20 long UNG Jan. 6th $16.50/$18.00 calls that we bought at 52 cents on the low of the move last week. The UNG closed on Friday at $19.29, so price is well-above the hedge strike price, and we’ll happily lock in a 65% partial profit in just four days of holding this spread.
UNG – Daily
Secondly, let’s remove 1 of 2 LEN short Dec. 16th $82.5/$77.5 put spreads. We’re up 63% on this and it expires on Friday.
Thirdly, let’s remove 2 of 3 GNRC short Dec. 23rd $100/$95 put spreads. We’re down 65% on this and I want to take the exposure well down before Wednesday’s FOMC statement.
We’re short 6 GE Jan. 6th $85/$90 call spreads, up 49%. Let’s take 2 of 6 off today.
We’re long 10 MDT Jan. 20th $80/$87 call spreads, down 26%. Let’s take 4 of 10 off today.
DailyPlay Updates – December 9, 2022
Investment Rationale
After several down days, stocks got a lift on Wednesday. The SPX is still down over 100 points this week, and would need quite a lift today to get it back into the black. I’d still be leaning toward a move down to near 3814 in the next several sessions, but I can’t tell if that would happen before or after the Fed’s rate change next Wednesday.
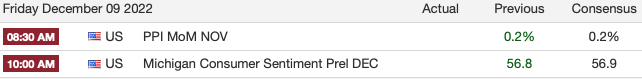
Today is Friday, so it’s weekly option expiration, along with the following economic releases for investors to wrangle with:
I have further trimmed some of my own holdings this week, as well as look to sell some losers to offset winners I’ve taken off the table this year, with the goal of reducing taxable gains. Consider doing the same, most especially if you’ve already taken gains on winners.
Most PMs won’t be doing much till next Tuesday’s and Wednesday’s big CPI and FOMC statements. I suggest you think similarly.
$GE
DailyPlay – Opening Trade (GE) Closing Trades (USO, ZTS) – December 8, 2022
Closing Trades
- USO – 94.82% Loss: Buy to Close 2 Contracts Dec. 9th $67/$65 Put Vertical Spreads @ $1.63 Debit. DailyPlay Portfolio: By Closing the remaining 2 Contracts, we will be paying $168. We took partial profit on this trade on December 5 when we Closed 4 Contracts @ $0.35 Debit, and then again on December 6 when we closed 6 Contracts @ 0.58 Debit, and then on December 7 when we closed 4 Contracts @ $1.15 Debit Our average gain on this trade is –5.04% and our average cost basis to exit this trade is $0.80 Debit.
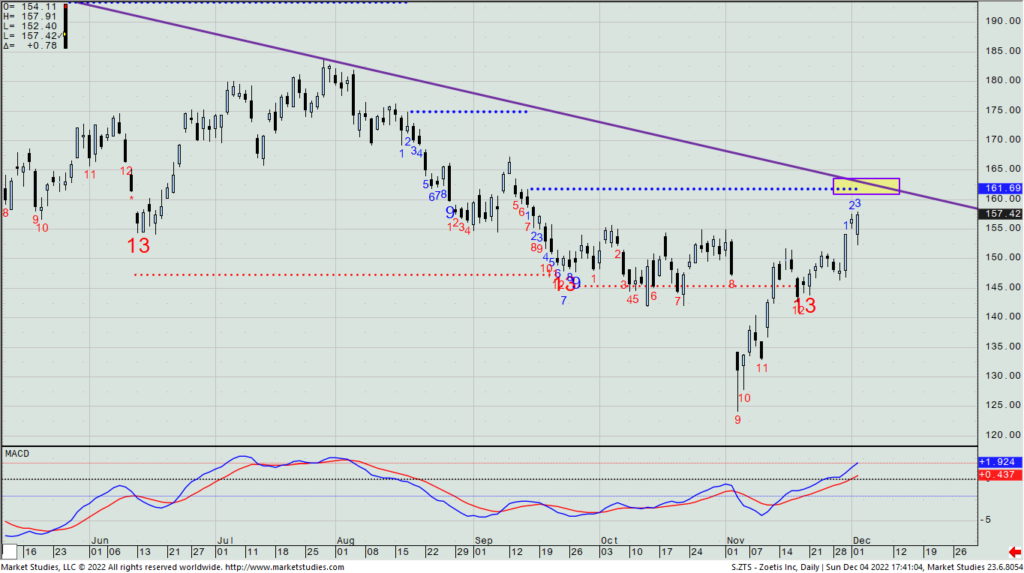
- ZTS – 1.05% Gain: Sell to Close 4 Contracts Dec. 16th $150/$160 Call Vertical Spreads @ $2.90 Credit. DailyPlay Portfolio: By Closing the remaining 4 of 6 Contracts, we will be receiving $1,160. We took partial profit on this trade on December 5 when we Closed 2 Contracts @ $6.32 Credit. Our average gain on this trade is 40.77% and our average cost basis to exit this trade is $4.04 Credit.
GE Bearish Opening Trade
View GE Trade
Strategy Details
Strategy: Short Call Vertical Spread
Direction: Bearish
Details: Sell to Open 6 Contracts Jan. 6th $85/$90 Call Vertical Spreads @ $2.04 Credit.
Total Risk: This trade has a max risk of $1,776 (6 Contracts x $296).
Counter Trend Signal: This is a Bearish trade on a stock that is experiencing a neutral to bullish trend.
1M/6M Trends: Neutral /Bullish
Technical Score: 9/10
OptionsPlay Score: 104
Entering the Trade
Use the following details to enter the trade on your trading platform. Please note that if there is a multi-leg option strategy, it should be entered as a single trade.
Please note that these prices are based on the previous day’s closing prices. Should the underlying move significantly during the pre-market hours, we will likely adjust the strikes and prices to reflect a more accurate trade entry.
Investment Rationale
Stocks had a quiet session on Wednesday, as most PMs are waiting till next week’s CPI and Fed news to make their next key decisions. Before I get to a new idea for today, let’s make sure you get out of the last two USO Dec. 9th put spreads we have on that expire tomorrow. What was a good bottom-fishing trade quickly turned around this week to turn into a loser, as oil has fallen to new 2022 lows.
We also have a long ZTS $150/$160 call spread that has done a turnaround after having initially worked. We’re back to breakeven on it (luckily, we had already reduced some of the position with a profit), so let’s just get out of the rest today. Roundtrips back to where we first got into a call spread is usually not something that I want to hold.)
For a new trade, I have one that not only looks like it offers a 2:1 reward-to-risk ratio going out one month from now, but surprisingly, it also lets us short the ATM call spread I want to while collecting 41% of the strike differential to the hedge strike above it that I’ll use (based on yesterday’s closing mid prices).
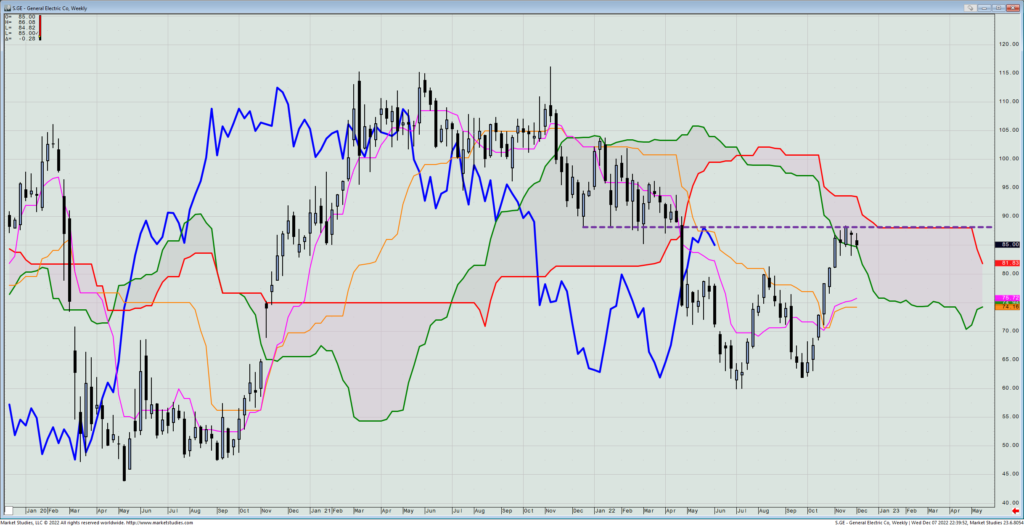
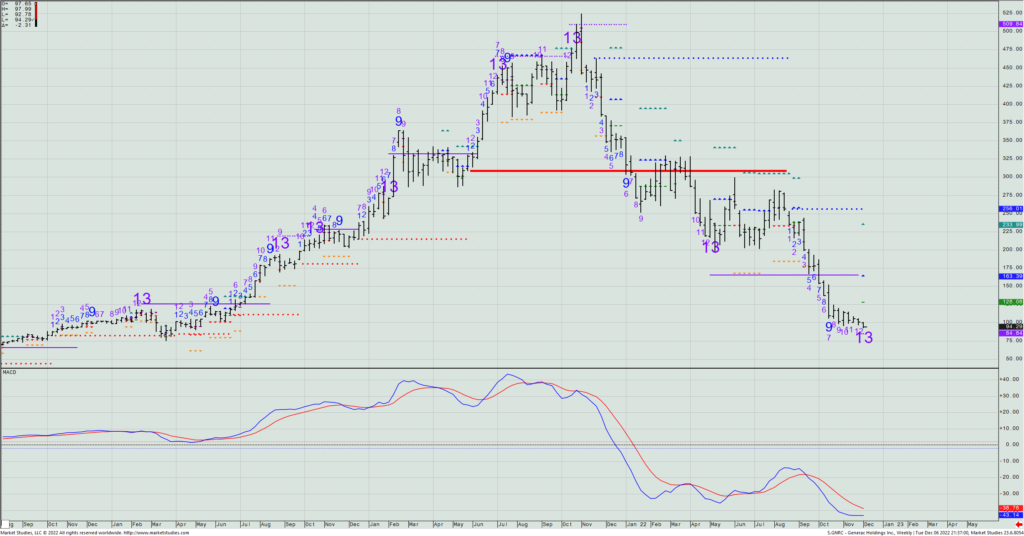
Earlier this year, we had a very successful short play in GE, when prices were much higher. As I have not looked at the name in months, I still had the chart open on one of my hundreds of chart pages. When I came across it today, I saw that the rally off the bottom has stalled right against its prior resistance area (i.e., the dashed horizontal, purple-colored line). I then saw that its weekly cloud bottom starts to dramatically tail off starting next week, and falls to the $75 area about a month from now. Its cloud top – this week at $93.45 – falls over the next four weeks to flatten out to $88, virtually the same level it has so far stopped at on this rally.
GE – Weekly
The way I am looking at this is that going one month out, the likelihood that this can fall to next major support is twice the price decline than what would be lost if it got a breakout above $90. Therefore, this all lines up well to short a GE Jan. 6th $85/$90 call spread today, collecting my desired 40% strike differential credit – and being able to do so even in an environment that I’d really prefer to be buying options (because of cheap volatility cost relative to where it’s been this year).
$UNG

DailyPlay – Conditional Opening Trade (UNG) Partial Closing Trade (USO) – December 6, 2022
Partial Closing Trade
- USO – 25.64% Gain: Buy to Close 6 Contracts Dec. 9th $67/$65 Put Vertical Spreads @ $0.58 Debit. DailyPlay Portfolio: By Closing 6 of 12 Contracts, we will be paying $348.
UNG Conditional Bullish Opening Trade
View UNG Trade
Strategy Details
Strategy: Long Call Vertical Spread
Direction: Bullish
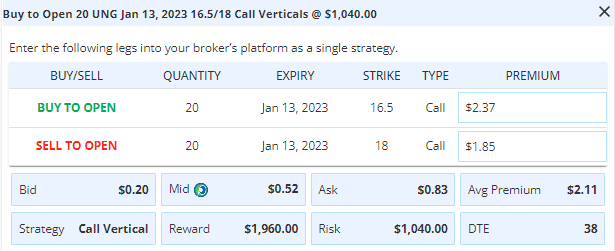
Details: Buy to Open 20 Contracts Jan. 13h $16.50/$18 Call Vertical Spreads @ $0.52 Debit.
Total Risk: This trade has a max risk of $1,040 (20 Contracts x $52).
Counter Trend Signal: This is a Bullish trade on a stock that is experiencing a bearish trend.
1M/6M Trends: Bearish/Bearish
Technical Score: 1/10
OptionsPlay Score: 126
Entering the Trade
Use the following details to enter the trade on your trading platform. Please note that if there is a multi-leg option strategy, it should be entered as a single trade.
Please note that this is a CONDITIONAL trade. We will only enter the trade when the condition is met, which is IF UNG gets to the $16.50 – $16.25 zone. Also note that the cost basis, premium paid, as well as the number of contracts when we open this trade will therefore be different from what we post today. This condition is only valid for a week unless advised otherwise.
Investment Rationale
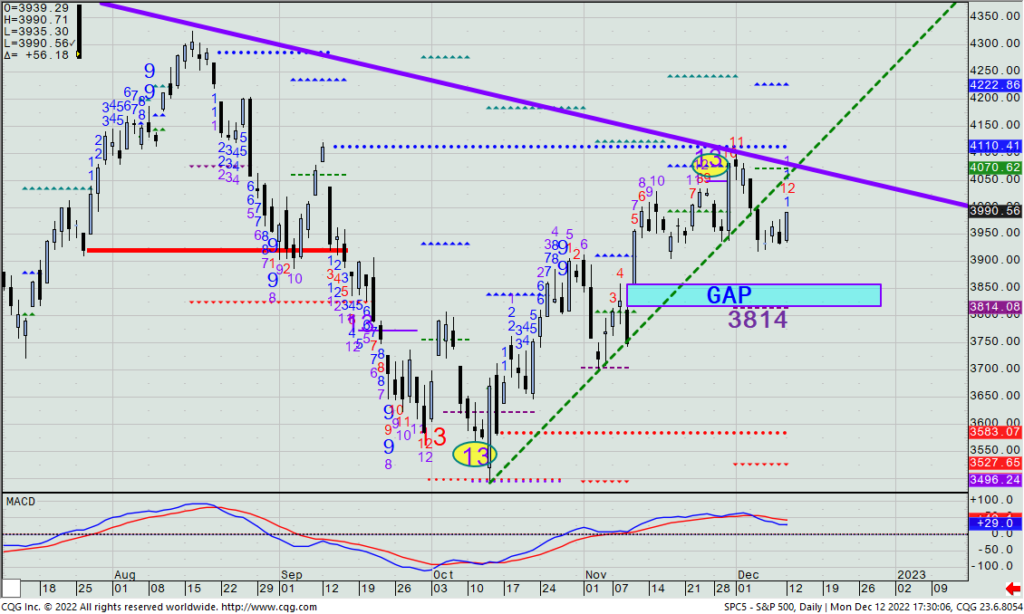
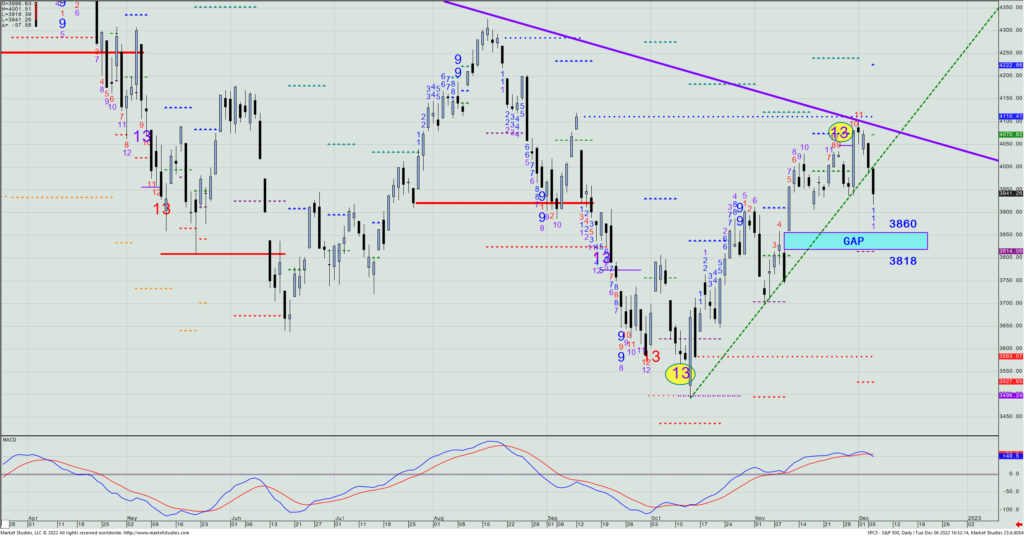
Stocks got hit hard yesterday while rates and the dollar moved higher. A surprise? Nope. The major downtrend is still in effect on the SPX, and along with the recent active Aggressive Sequential +13 signal has still shown itself to be a place that the risk of a decline was higher than the chance of a further upmove. That, at least, is what has proven to be the right way to play in all of 2022, and as I recently wrote you, “You play what’s been working until it doesn’t”.
As I mentioned in Monday morning’s webinar, the SPX is now stuck between its major downtrend line and minor uptrend line – the former being more important than the latter (based upon time in effect and times the lines have been touched).
SPY – Daily
If the week closes beneath 3906 (the mid-November low), I think we have seen the labeled gap get filled along with the bearish Propulsion Momentum level (3814) getting tested, which to me will be very important for bulls to defend. If they can’t, then I think that 2022 lows will get tested and likely be exceeded in the first quarter of ’23.
As per open positions, let’s take off another 6 USO Dec. 9th $67/$65 short put spreads today. (We took the first 4 off yesterday.) They expire on Friday, and we are taking pieces off each day this week thru Thursday.
We are also long a 50% position in a TSLA Dec. 30th $195/$225 call spread, and then yesterday got filled on the second half of the trade by buying a Dec. 30th $190/$225 call spread when the stock got to $190. That means we got filled near the open at about $9.70. I will likely keep this on unless we see a stock close beneath $181.11.
Now, as per a new trade, I do not want to be initiating any significant new standard equity positions until we get next week’s CPI and Fed data. However, I am willing to play a name that’s not in the regular corporate security world – more specifically, in the commodity space. And I’ve even picked one that is not dollar-correlated area of commodities, namely, natural gas. (This market trades on fundamentals and technicals, and is in many ways a uniquely different commodity to trade, as the influences that affect most commods do not impact this one.)
Yesterday, Natgas futures were down 10+ percent, and the chart shows that its associated ETF (UNG) looks headed for a move to its weekly TDST line at $16.38, which also happens to be where the uptrend line comes in from the April 2021 low and is where the weekly cloud’s Lagging Line would hit the bottom of its cloud. As such, as a conditional trade, when and if UNG gets to the $16.50 to $16.25 zone, we’ll then look to buy a 1% position in the Jan. 13th $16.50/$18 call spread at the then bid/offer mid-price. (Consider this and all conditional trades to be an active recommendation from me for a week after I publish it unless told otherwise.)
UNG – Weekly
$TSLA, $USO, $GNRC
DailyPlay – Partial Closing Trades (TSLA, USO, GNRC) – December 7, 2022
Partial Closing Trades
- TSLA – 44.22% Loss: Sell to Close 1 Contract Dec 30th $195/$225 Call Vertical Spreads @ $4.29 Debit. DailyPlay Portfolio: By Closing the 1 Contract, we will receive $429.
- USO – 47.44% Loss: Buy to Close 2 Contracts Dec. 9th $67/$65 Put Vertical Spreads @ $1.15 Debit. DailyPlay Portfolio: By Closing 2 of the remaining 6 Contracts, we will be paying $230. Close another 2 Contracts before Market Close today, and another 2 Contracts by tomorrow.
- GNRC – 50% Loss: Buy to Close 3 Contracts Dec 23rd $100/$95 Put Vertical Spreads @ $3.00 Debit. DailyPlay Portfolio: By Closing 3 of 6 Contracts, we will be paying $900.
Investment Rationale
Stocks took it on the chin again. The press reports it’s from growing recession concerns, but really, they’re no more so now than they were a few days ago. The reality is that the SPX stalled right at its major downtrend line that had just before then seen a daily +13 signal, and all the post-Powell talk rally from last week has completely disappeared. Seems like we’ve seen this same story happen recently… because we did.
Yesterday’s downmove also significantly broke the uptrend line from the 2022 low, and now opens the door for a potential test of the unfilled highlighted gap zone from 3860 to 3818. With 3814 being the bearish Propulsion Momentum level, that 4-point zone along with the gap bottom becomes critical support for those bullish. At this point, I think the only way you see a Santa Claus rally is from a bullish CPI number and/or pivoting Fed next week.
SPY – Daily
Yesterday’s decline took out the TSLA $181.10 level that I wanted to see hold as support. As such, we will remove the $195/$225 call spread that we have on, leaving us with the long $190/$225 spread. I will monitor closely and potentially exit that piece by week’s end.
Crude oil settled down on the year on Tuesday. Who would have thought would be a possibility after earlier this year we saw it trading at $120/bbl. As for our trade in its associated ETF, we’ve already exited 10 of 16 short USO $67/$65 put spreads we have on. With today having the weekly oil inventory report released at 10:30am ET, let’s take 2 more spreads off around 10am before the number comes out, and we’ll exit another two just before today’s close – leaving the last two to exit tomorrow.
Our GNRC short $100/$95 Dec. 23rd put spread has now reached just beneath our $95 hedge strike. Though it is showing a weekly -13 this week (and not generally a time I’d sell), having discipline to exit half the trade when we’ve reached a 50% loss is more important to me than hoping that it holds here. So, we’ll buy back 3 of the 6 short spreads we have on today, and if we do shortly see a decent rally, we’ll still be able to make money on the trade.
GNRC – Weekly
DailyPlay – Partial Closing Trades (USO, ZTS) – December 5, 2022
Partial Closing Trades
- USO – 55.13% Gain: Buy to Close 4 Contracts Dec. 9th $67/$65 Put Vertical Spreads @ $0.35 Debit. DailyPlay Portfolio: By Closing 4 of 16 Contracts, we will be paying $140.
- ZTS – 120.21% Gain: Sell to Close 2 Contracts Dec. 16th $150/$160 Call Vertical Spreads @ $6.32 Credit. DailyPlay Portfolio: By Closing 2 of 6 Contracts, we will be receiving $1,264.
Investment Rationale
With the VIX down to near 20, I think we’re safe in thinking that the bulk of what we’ll be doing now will be buying option positions. This is clearly the lower end of where we’ve seen this vol index trade in 2022.
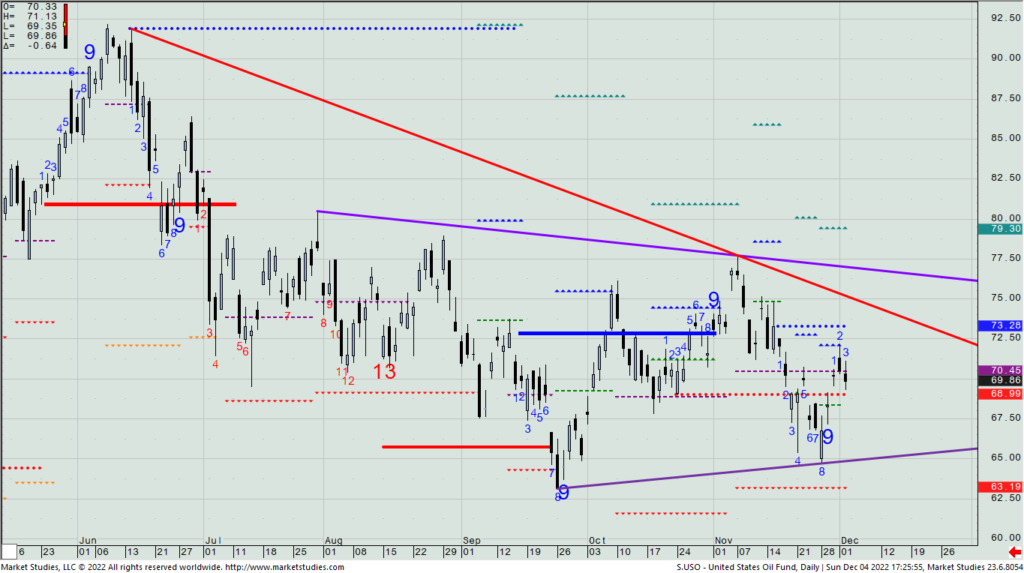
We deftly got into the Nov. 22 conditional USO short put spread a day later, when price got down to our target entry price of $67.10. We are short the Dec. 9th $67/$65 put spread from about 78 cents, and it closed at $0.345 mid on Friday. Let’s take 4 of those 16 spreads off today as they expire on Friday, and I’ll be looking to unwind the balance in pieces over the next several days.
USO – Daily
We are also long the ZTS Dec. 16th $150/$160 call at $2.87. With it having closed at $6.32 mid on Friday, today let’s take off 2 of the 6 spreads we have on to partially lock in the 120% profit we have in this position.
ZTS – Daily
$VALE, @LEN
DailyPlay – Closing Trade (VALE) Partial Closing Trade (LEN) – December 2, 2022
Closing Trade
- VALE – 200% Gain: Sell to Close 5 Contracts Dec. 2nd $13.50/$15.50 Call Verticals @ $1.92 Credit. DailyPlay Portfolio: By Closing the remaining 5 of 10 Contracts, we will be receiving $960. We partially closed this trade on November 30 with 5 Contracts at a $0.64 Credit. Our average gain for this trade is therefore 189.85% and our average cost basis to exit this trade is $2.56 Credit.
Partial Closing Trade
- LEN – 64.67% Gain: Buy to Close 1 Contract Dec. 16th $82.50/$77.50 Put Vertical Spread @ $0.59 Debit. DailyPlay Portfolio: By Closing 1 of 3 Contracts, we will be paying $59.
Investment Rationale
Yesterday was a pretty non-descript day in the market, right? But did you know that volume was significantly larger than it was on Wednesday’s massive upmove? That means there was real selling on Thursday vs. a light-volumed runaway upmove the day before. So, which day is more significant? Well, I continually hear that long-onlys are not buying this rally; they’re more so selling into it.
Price has hit the major downtrend line from the all-time high, and that’s been the right place and time to be selling earlier this year. Don’t be afraid to do some again. (It’s not wrong until it is.)
SPY – Daily
Today is the key monthly employment report. Consensus non-farm payrolls is 200K and a 3.7% unemployment number. Will higher payrolls be taken as bullish or bearish? This year, I’d say higher is bearish, but maybe bulls will say that a higher number says the economy is humming and nicely handling the higher rate environment. At the same time, today could be a day that completely unwinds Wednesday’s rally if the numbers come in really hot.
With the VIX down near 20, I can pretty much tell you that despite my wanting to be an option buyer (vs. being a seller), I will virtually never buy a new option position on a Friday (as you automatically lose two days of theta because of the weekend). Today is also a weekly option expiration, so with the jobs numbers coming out, too, it’s more of a day to tweak your portfolio than it is to add to it.
Make sure you are out of our very profitable VALE $13.50/$15.50 call spreads that expires today. Let’s also reduce our position in the short LEN Dec. 16th $82.5/$72.5 put spread. We have three of these spreads on; let’s take off one today with us being up ~65% on it.