
$TSLA

DailyPlay – Opening Trade (TSLA) – December 1, 2022
TSLA Bullish Opening Trade
View TSLA Trade
Strategy Details
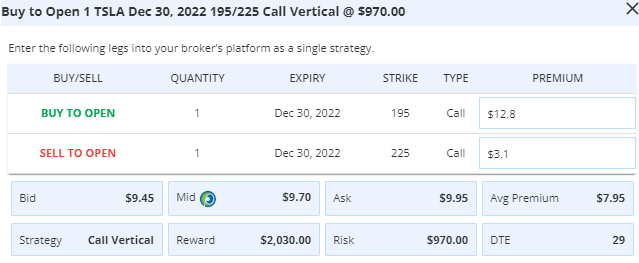
Strategy: Long Call Vertical Spread
Direction: Bullish
Details: Buy to Open 1 Contract Dec 30th $195/$225 Call Vertical Spreads @ $9.70 Debit.
Total Risk: This trade has a max risk of $970 (1 Contract x $970).
Counter Trend Signal: This is a Bullish trade on a stock that is experiencing a neutral to bearish trend.
1M/6M Trends: Neutral/Bearish
Technical Score: 2/10
OptionsPlay Score: 106
Entering the Trade
Use the following details to enter the trade on your trading platform. Please note that if there is a multi-leg option strategy, it should be entered as a single trade.
Please note these prices are based on the previous day’s closing prices. Should the underlying move significantly during the pre-market hours, we will likely adjust the strikes and prices to reflect a more accurate trade entry.
Investment Rationale
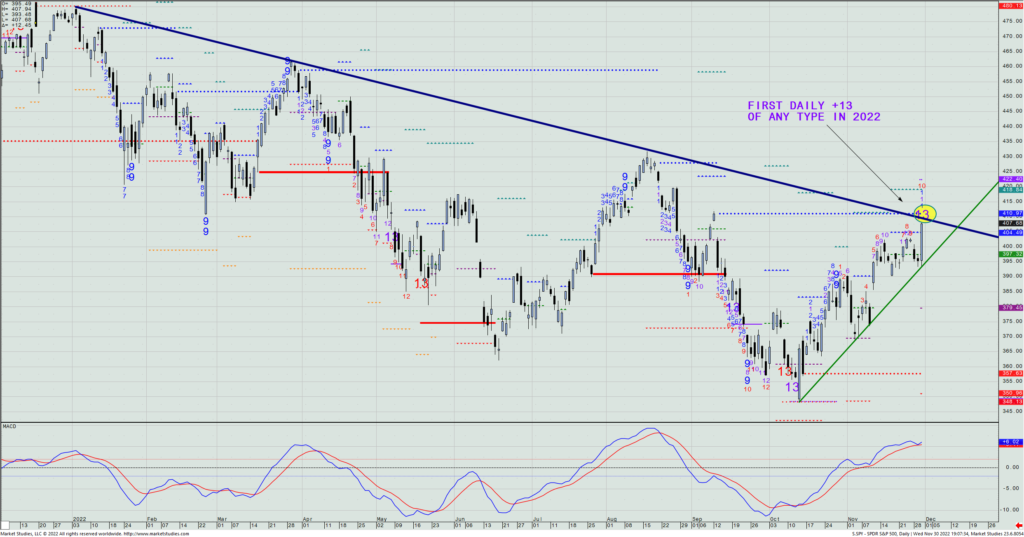
The Fed Chairman spoke; investors took what he said bullishly; and the SPX ran almost 3% to its best close since early September. So, everything is fine again, right? Well, Wednesday’s move higher also marked the SPY’s first daily +13 signal of the year (in this case, an Aggressive Combo signal) on a day that bulls got all they wanted to hear. To me, that’s not what you want to see to first now be getting bullish. (Almost all of our trades have been bullish ones since the October low was made.)
SPY – Daily
But here’s what you really need to ask yourselves: Did Fed Chair Powell just repeat a similar mistake to what he did in July – when investors badly misinterpreted his intentions to keep rates high and not pivot – or did he actually just tell the world that things have improved enough that their pace of raises can materially decline. (BTW: the market has figured that December would only see a 50 bp. hike for weeks already, so was yesterday’s overkill?
The Fed is now in a quiet period for the next two weeks until their next rate change announcement comes on Dec. 14th. That means Powell (nor his other governors) can walk back yesterday’s comments. It would have to come from some other source of theirs that they could potentially get the word out without actually stating them. (He often uses a WSJ reporter for just that situation.)
This also puts further meaning into Friday’s employment numbers: Will the data support or conflict how bulls have just positioned themselves? (I’m hearing that the job creation number could be well above what’s Street consensus. If that’s the case, we could see today’s rally completely erased – and then some – on Friday.
Personally, I find it hard to think that Powell had the intention of his words coming across as dovishly as the market took them. Time will tell.
———
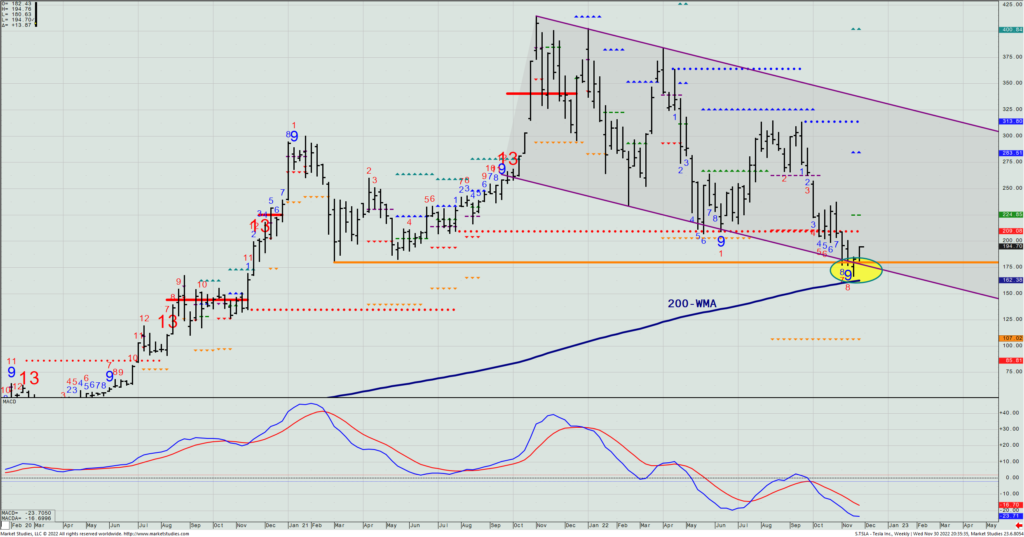
A new option idea to consider playing is in Tesla (TSLA), which like many names yesterday did a complete turnaround. The weekly chart shows four unrelated reasons that this may have put in a trading low:
- Last week’s low came within a few percent of its 200-WMA;
- Three weeks ago was Setup -9;
- Price held support in the mid-$170s from the double-bottom in 2021; and
- Price held against the bottom of the channel drawn against the downtrend line.
With the VIX collapsing to near 20, let’s look to buy a HALF POSITION (+- 1% risk on your total portfolio) in a TSLA Dec. 30th $195/$225 call spread today, and ANOTHER HALF POSITION IF the stock trades down to $191 to $189 by week’s end, in which case we’ll buy the $190/$225 call spread at the then current bid/offer mid price for these strikes.
TLSA – Weekly
$MDT
DailyPlay – Opening Trade (MDT) – November 28, 2022
MDT Bullish Opening Trade
View MDT Trade
Strategy Details
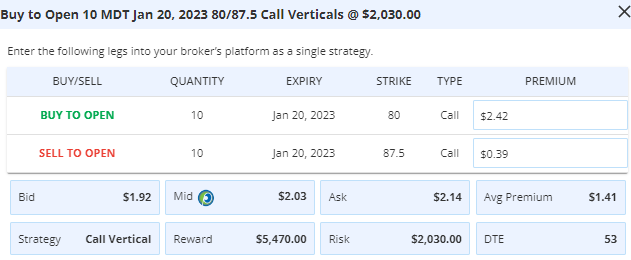
Strategy: Long Call Vertical Spread
Direction: Bullish
Details: Buy to Open 10 Contracts Jan 20th $80/87 Call Vertical Spreads @ $2.03 Debit.
Total Risk: This trade has a max risk of $2,030 (10 Contracts x $203).
Counter Trend Signal: This is a Bullish trade on a stock that is experiencing a bearish trend.
1M/6M Trends: Bearish/Bearish
Technical Score: 2/10
OptionsPlay Score: 113
Entering the Trade
Use the following details to enter the trade on your trading platform. Please note that if there is a multi-leg option strategy, it should be entered as a single trade.
Please note these prices are based on the previous day’s closing prices. Should the underlying move significantly during the pre-market hours, we will likely adjust the strikes and prices to reflect a more accurate trade entry.
Investment Rationale
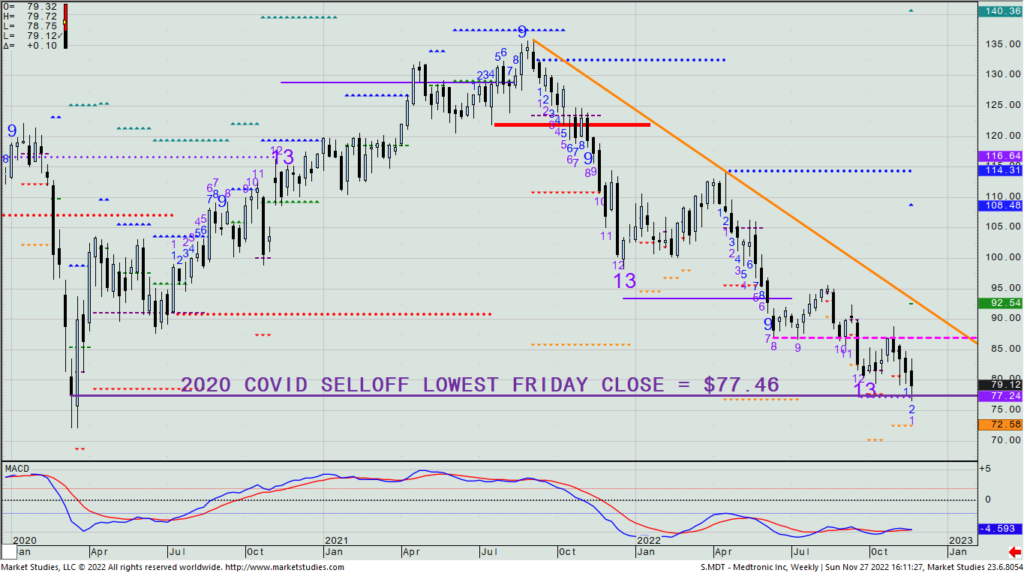
Medical device maker Medtronic (MDT) has had nothing but hard times in the past 15 months, being in a straight down bear market since its all-time high of Summer 2021. As bulls have continuously lost money, I’ve read that CNBC’s Jim Cramer “no longer recommends the name”. That’s the type move and public commentary that can really wash out what is already a badly beaten down name.
With that in mind, here’s what I see: Last week’s low bounced on the same level of what was the lowest Friday close of 2020 ($77.46), when the Covid sell-off crushed global equity markets. (I’ve displayed that line on the weekly chart below.) In addition, that same low also bounced on the recent weekly -13’s Risk level of $77.24. to me, this sets up a bullish counter-trend trade worth putting on. As such, let’s look to buy the Jan. 20th $80/$87.50 call spread today. On Friday, the spread closed at $2.03 mid, which represents about 27% of the strike differential – a very agreeable cost to absorb from an expiration that has just north of 50 days to go.
MDT – Weekly
$ZTS
DailyPlay – Opening Trade (ZTS) – November 23, 2022
ZTS Bullish Opening Trade
View ZTS Trade
Strategy Details
Strategy: Long Call Vertical Spread
Direction: Bullish
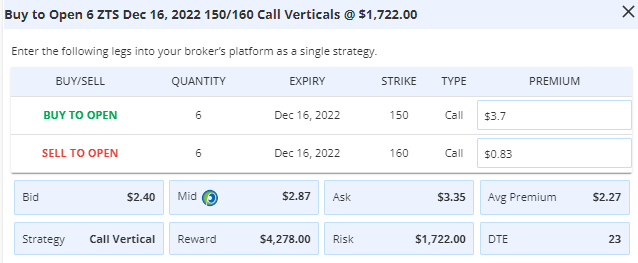
Details: Buy to Open 6 Contracts Dec. 16th $150/$160 Call Vertical Spreads @ $2.87 Debit.
Total Risk: his trade has a max risk of $1,722 (6 Contracts x $287).
Trend Continuation Signal: This is a Bullish trade on a stock that is experiencing a neutral to bullish trend.
1M/6M Trends: Bullish/Neutral
Technical Score: 3/10
OptionsPlay Score: 100
Entering the Trade
Use the following details to enter the trade on your trading platform. Please note that if there is a multi-leg option strategy, it should be entered as a single trade.
Please note these prices are based on the previous day’s closing prices. Should the underlying move significantly during the pre-market hours, we will likely adjust the strikes and prices to reflect a more accurate trade entry.
Investment Rationale
Stocks moved well-higher on Tuesday as the pre-holiday slowdown has already started. Less than 19 billion shares traded so far this week, the quietest two-day period in all of 2022. Though dollar and rate weakness might have helped fuel yesterday’s gains, Goldman Sachs was out with a note stating that they expect that next year’s close will be at SPX 4000 – essentially unchanged from exactly where that benchmark index is now trading.
American pet and livestock drug manufacturer Zoetis (ZTS) is the largest of its kind in the world. I’m interested in the long side of the name, because the weekly chart posted a -13/-9 bottom shortly before this year’s low was made, with subsequent price action to those signals halting right at the Risk level for the -13 (i.e., $132.87), with this year’s lowest weekly close at $133.67).
ZTS – Weekly
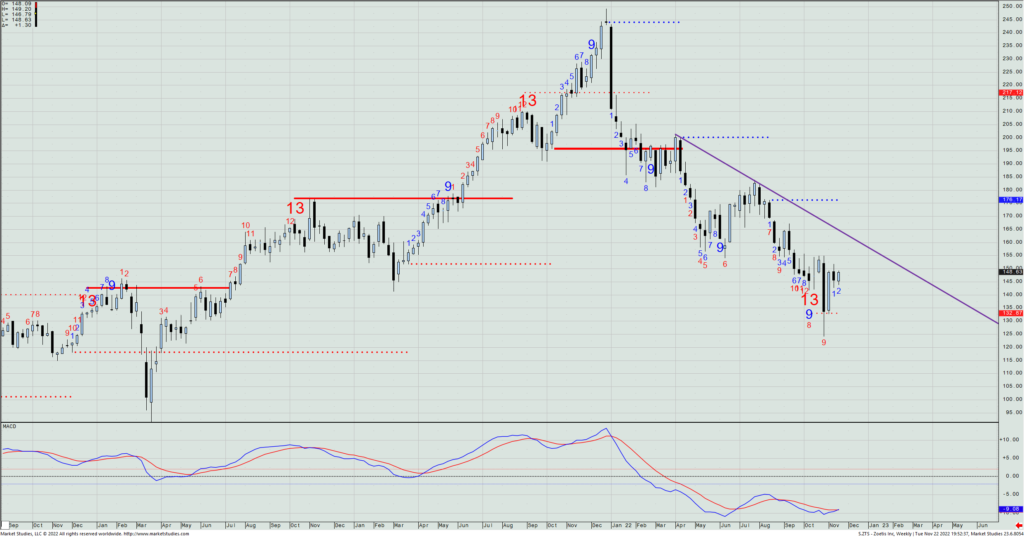
Then, when I look at its daily chart, I see a -13 count made last Friday that even without that signal makes me think there’s shortly going to be a move higher up to test its TDST Line at $161.69. Thus, let’s look to buy the ZTS Dec. 16th $150/$160 call spread. Yesterday, it closed at $2.875 mid, which is about 29% of the strike differential and generally in line with what I’m willing to pay for a slight OTM call spread.
$USO
DailyPlay – Conditional Opening Trade (USO) – November 22, 2022
USO Conditional Bullish Opening Trades
View USO Trade
Strategy Details
Strategy: Short Put Vertical Spread
Direction: Bullish
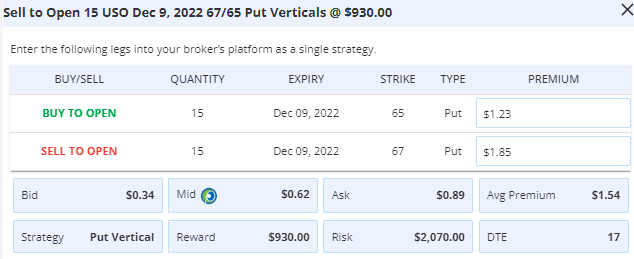
Details: Sell to Open 15 Contracts Dec. 9th $67/$65 Put Vertical Spreads @ $0.62 Credit.
Total Risk: This trade has a max risk of $2,070 (15 Contracts x $138).
Counter Trend Signal: This is a Bullish trade on a stock that is experiencing a bearish trend.
1M/6M Trends: Bearish/Bearish
Technical Score: 3/10
OptionsPlay Score: 91
Entering the Trade
Use the following details to enter the trade on your trading platform. Please note that if there is a multi-leg option strategy, it should be entered as a single trade.
Please note that this is a CONDITIONAL trade. We will only enter the trade when the condition is met, which is IF USO trades towards the $66.70 and $67.50 range. Also note that the cost basis, premium paid, as well as the number of contracts when we open this trade will therefore be different from what we post today. This condition is only valid until Friday this week.
Investment Rationale
China announcing some significant Covid cases and return to lockdown was not taken well by investors yesterday, though by the close we only saw the SPX fall 39 bps., but the NDX lost 1.06%. Crude oil made an early real decline on news that Saudi Arabia and OPEC+ were going to increase production, sending WTI down almost $5. Then headlines came out that they denied ever saying that, and crude reversed to settle at $80.04/bbl., just 7 cents lower on the day. (This is part of the reason why I both love and hate trading the crude oil market.)
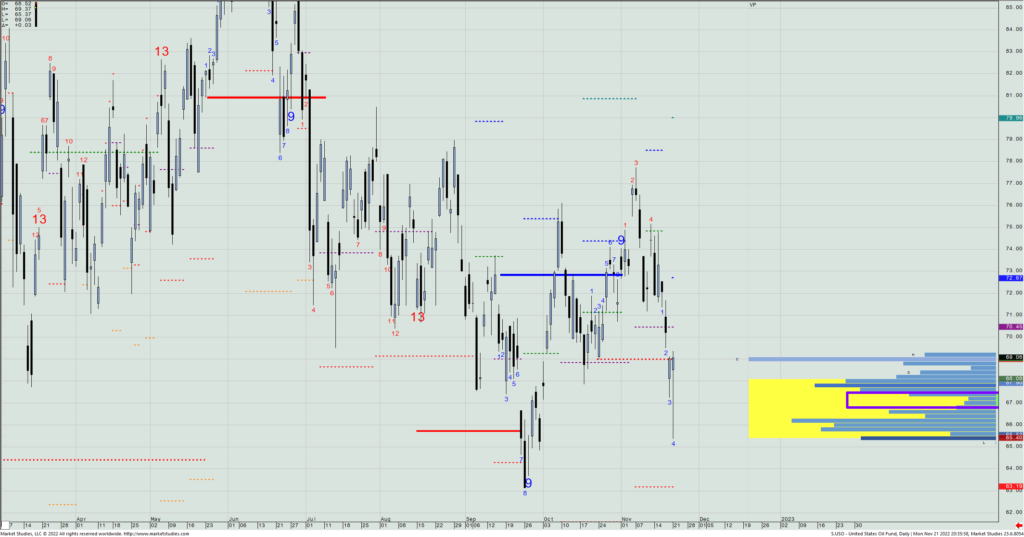
In Monday’s Technical Outlook webinar, we talked a fair amount about the oil market, and that if one were going to use the US Oil Fund ETF (USO) to play the oil market, that one need especially understand that this ETF does not track the front-month price of WTI oil like you see quoted on your TV, but a weighted average of futures contracts going out a full year from that front-month, whereby the front-month’s weighting is only 15% of the total ETF price calculation. That means you can see oil show a higher quote on the day, but the USO actually have a negative move for that day because the back months in oil were trading lower that particular day. (This is what the whole spread market is about in futures markets, as in playing one month vs. another instead of trying to simply directionally bet on the price of a commodity.)
Now that I’ve explained that to you, I do think yesterday’s decline and then upmove had to wash out some shorts, and thus, maybe a near-term trading low was made. When I look more closely at where USO saw its heavy volume – and where it didn’t – I can get a clue into where within yesterday’s range players made the bulk of their bets. What I see is that from $67.10 +/- 40 cents, hardly anything traded relative to just about everywhere else in Monday’s range. That low-volume area often acts as a support or resistance level, and as such, if we see USO trade down to that level anytime between now and Friday’s close, we will look to sell the USO Dec. 9th $67/65 put spread for what is the then current bid/offer spread mid-price. Right now, the ATM/ $2 OTM put spread yields about 40% of the strike differential, a number I am usually very comfortable selling a credit spread for. I suspect we should get something like that same 40% credit-to-strike differential if we get a chance to buy this on a pullback into that range around $67.10.
USO – Daily
Next, please note as a general rule – and unless I state otherwise in a DP write-up – assume any conditional trade is good to enter for up to one week after I write the recommendation.
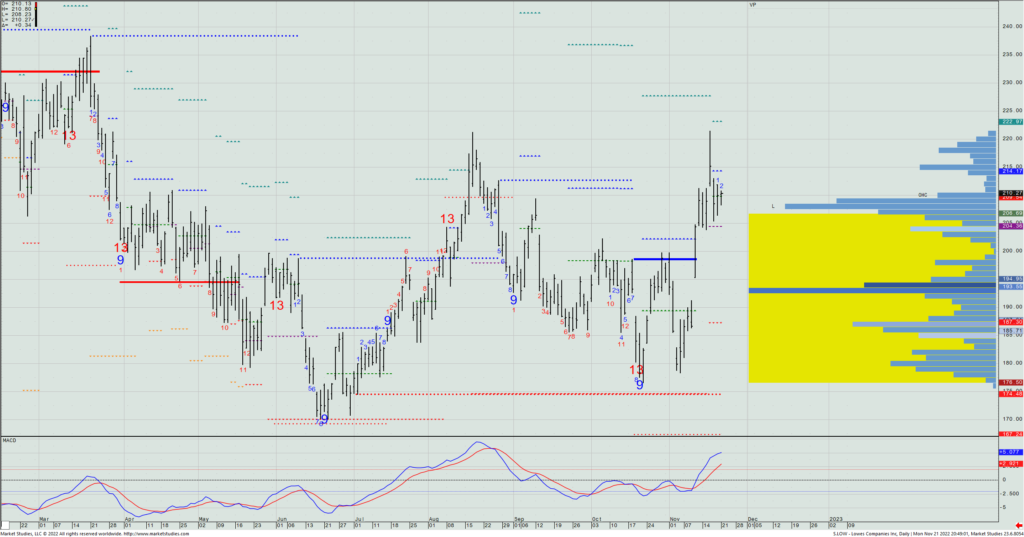
We do have an open conditional trade in LOW, which was to short a Dec. 9th $200/$190 put spread if we saw a pullback to near $200. (The low since I put that recommendation out on 11/16 has been $205.37.) I will adjust this recommendation to instead wait to put on a Dec. 16th $195/$185 put spread if the $195 area comes into play in the underlying stock (and not do the $200/$190 put spread). Note: I’ve also changed the expiration by a week.
LOW – Daily
$QQQ
DailyPlay – Conditional Opening Trade (QQQ) – November 21, 2022
QQQ Conditional Bullish Opening Trades
View QQQ Trade
Strategy Details
Strategy: Long Call Vertical Spread
Direction: Bullish
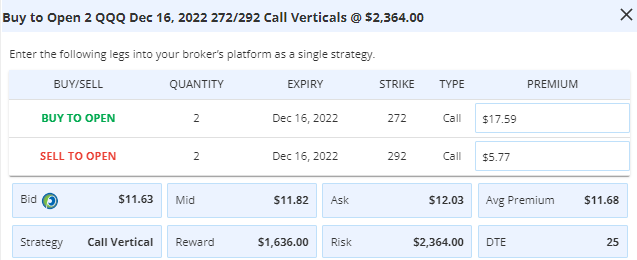
Details: Buy to Open 2 Contracts Dec. 16th $272/$292 Call Vertical Spreads @ $11.82 Debit.
Total Risk: This trade has a max risk of $2,364 (2 Contracts x $1,182).
Trend Continuation Signal: This is a Bullish trade on a stock that is experiencing a neutral to bullish trend.
1M/6M Trends: Bullish/Neutral
Technical Score: 5/10
OptionsPlay Score: 85
Entering the Trade
Use the following details to enter the trade on your trading platform. Please note that if there is a multi-leg option strategy, it should be entered as a single trade.
Please note that this is a CONDITIONAL trade. We will only enter the trade when the condition is met, which is IF between today and Wednesday the Qs sell down to within 25 cents on either side of $273.22. Also note that the cost basis, premium paid, as well as the number of contracts when we open this trade will therefore be different from what we post today. This condition is only valid until Wednesday this week.
Investment Rationale
I’m clearly no bull, but I don’t mind tactically playing the long side if a name pulls back to where I’d be a willing buyer. So, let’s look at the daily QQQ chart, which last week stalled against one of two downtrend lines that can be drawn from the all-time high.
QQQ – Daily
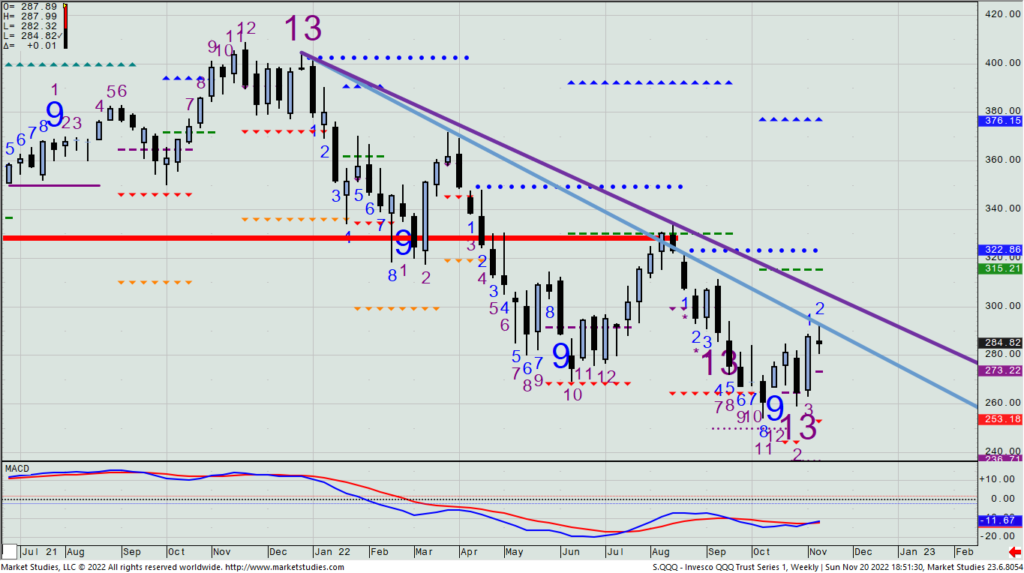
Note the bearish Propulsion Momentum level is at $273.22 this week. Thus, if between today and Wednesday the Qs sell down to within 25 cents on either side of that number, we’ll then look to buy a Dec. 16th $272/$292 call spread for the then-current bid/offer mid-price.
$CNC

DailyPlay – Closing Trade (CNC) – November 17 2022
Partial Closing trade
- CNC-96.84% Gain: Buy to Close 4 Contracts Nov. 18th $75/$72.50 Put Verticals @ $0.95 Debit. DailyPlay Portfolio: By Closing the remaining 4 of 8 Contracts, we will be paying $380. We partially closed this trade on November 2 with 4 Contracts at a $0.05 Debit. Our average gain for this trade is therefore 95.79% and our average cost basis to exit this trade is $0.50 Debit.
Investment Rationale
Stocks took a breather yesterday, despite lower rates and a lower dollar. Target’s (TGT) warning of slower things to come put pressure on the broad market, even though Lowes’ CEO said he doesn’t see any sense of slowing. SF Fed President Mary Daly also commented saying that there is no Fed pivot even being discussed, so that probably kept a lid on buyers coming in on Wednesday.
Yesterday’s decline still posted a daily SPX Setup +7 count (towards a +9), though the Countdown remained on a +10 (towards a +13). That would still indicate that we are nearing a potential trading top – possibly even by sometime next week.
SPX – Daily
We still have on the CNC Nov. 18th short $75/$72.5 put spread, up 97% on this remaining portion. With it expiring Friday, let’s exit the balance today.
$LOW
DailyPlay – Conditional Opening Trades (LOW) – November 16, 2022
LOW Conditional Bullish Opening Trades
We list the two Conditional trades for LOW separately.
View LOW Conditional (1) Trade
Strategy Details
Strategy: Short Put Vertical Spread
Direction: Bullish
Details: Sell to Open 1 Contract Dec. 9th $200/$190 Put Vertical Spreads @ $2.43 Credit.
Total Risk: TThis trade has a max risk of $757 (1 Contract x $757).
Trend Continuation Signal: This is a Bullish trade on a stock that is experiencing a neutral to bullish trend.
1M/6M Trends: Bullish/Bullish
Technical Score: 9/10
OptionsPlay Score: 89
Entering the Trade
Use the following details to enter the trade on your trading platform. Please note that if there is a multi-leg option strategy, it should be entered as a single trade.
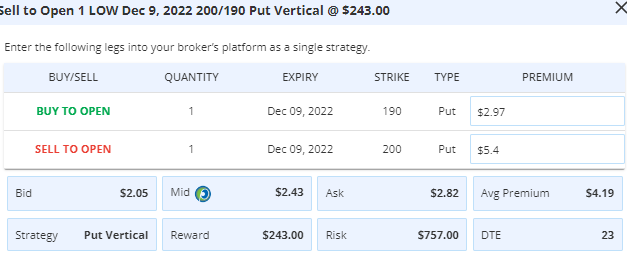
Please note that this is a CONDITIONAL trade. We will only enter the trade when the condition is met, which is IF we see LOW trading down near $200. Also note that the cost basis, premium paid, as well as the number of contracts when we open this trade will therefore be different from what we post today. This condition is only valid for this week.
View LOW Conditional (2) Trade
Strategy Details
Strategy: Short Put Vertical Spread
Direction: Bullish
Details: Sell to Open 3 Contracts Dec. 9th $195/$190 Put Vertical Spreads @ $1.08 Credit.
Total Risk: This trade has a max risk of $1,176 (3 Contracts x $392).
Trend Continuation Signal: This is a Bullish trade on a stock that is experiencing a neutral to bullish trend.
1M/6M Trends: Bullish/Bullish
Technical Score: 9/10
OptionsPlay Score: 93
Entering the Trade
Use the following details to enter the trade on your trading platform. Please note that if there is a multi-leg option strategy, it should be entered as a single trade.
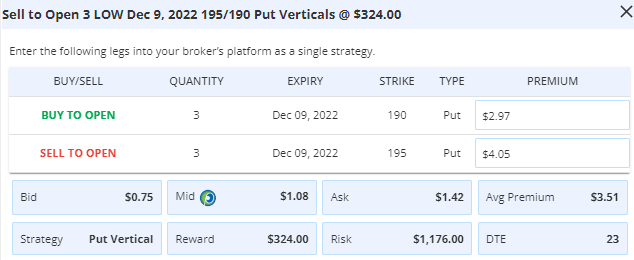
Please note that this is a CONDITIONAL trade. We will only enter the trade when the condition is met, which is IF we see LOW trading down to $195. Also note that the cost basis, premium paid, as well as the number of contracts when we open this trade will therefore be different from what we post today. This condition is only valid for this week.
Investment Rationale
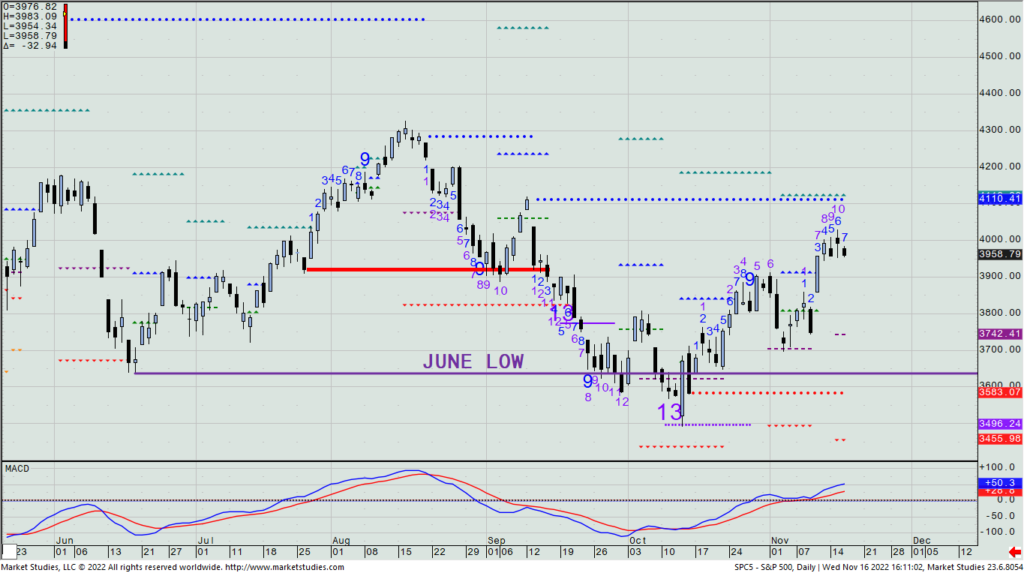
A better than expected PPI number again gave bulls a reason to buy stocks, with the SPX gaining another 34 pts. on Tuesday to 3992, its highest close since early September. Nine of eleven macro sectors were up, led by Communication Services and Consumer Discretionary names. (Almost half of these combined sector weightings come from just 4 stocks: META, GOOGL, AMZN, and TSLA).
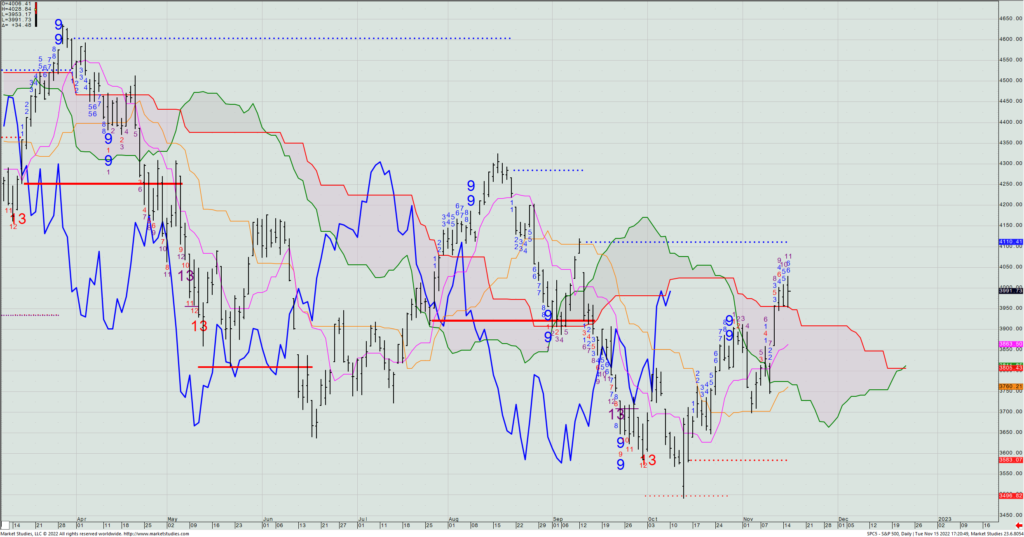
I disagree with those who think that we’ve started a whole new bull market. In my opinion, the Fed will not pivot; 2023 earnings estimates still need to decline; recession is still a distinct possibility, and the general trend remains lower. In fact, when I look at the daily SPX chart, I see a Setup +6 and a Countdown +11, suggesting that by week’s end we could already be starting to top this move out. Also note the daily TDST line at 4110 and the most recent Propulsion Full Exhaustion target at 4118 – both potential resistance trading targets, too.
SPX – Daily
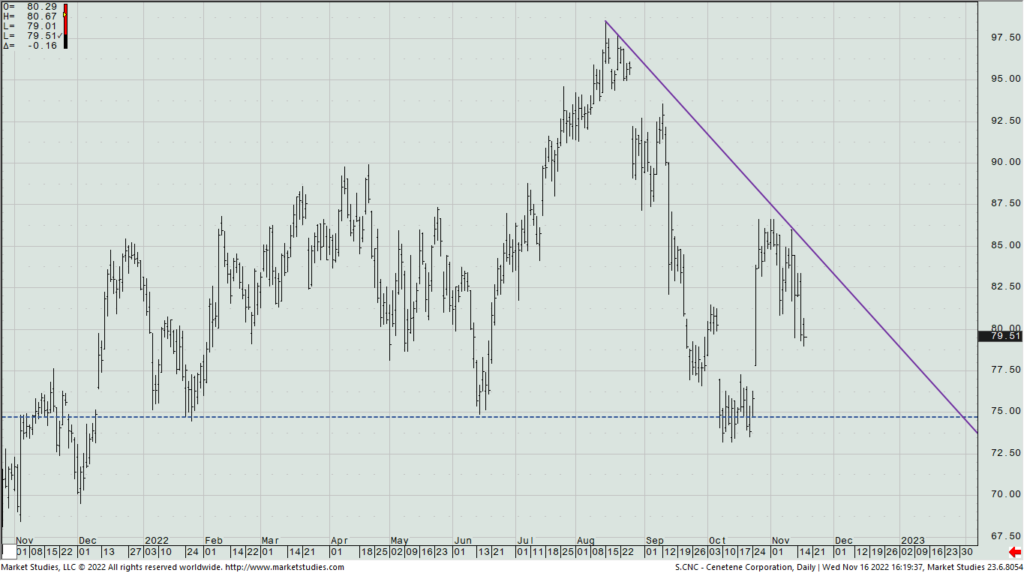
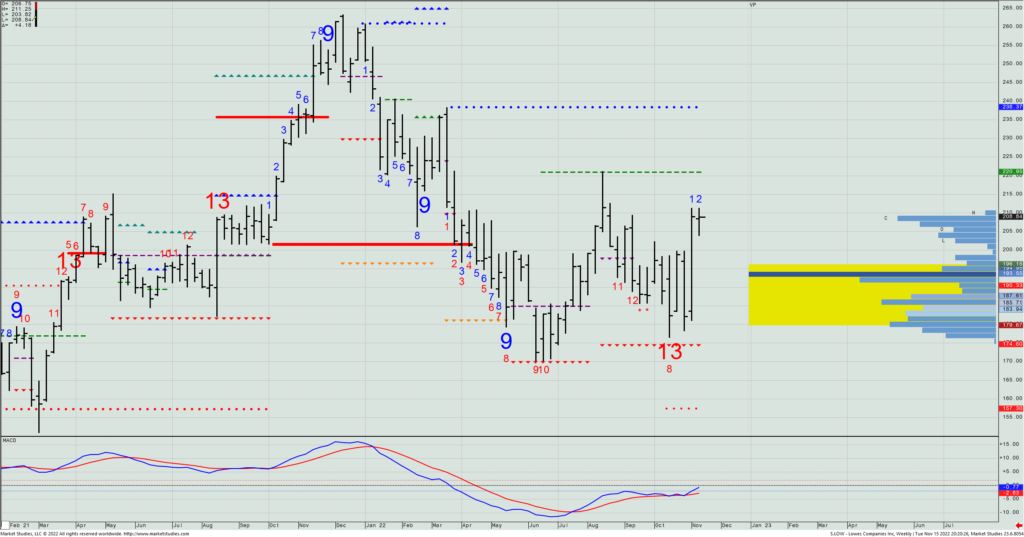
Lowes (LOW) reports today before the open, and will hold its conference call at 9am ET. So by the open, we should get a pretty good sense of initial reactions to the data and guidance. Looking at its chart, and what Tony identified as decent fundamentals for it in yesterday’s webinar, I think we could see the $200 to $195 area tested on a pullback. Given the recent low volume near that price, should we see LOW trading down near $200 today, let’s look to sell a Dec. 9th $200/$190 put spread (on half the amount of exposure we normally do) for whatever the current bid/offer mid price is on the spread at the time. Should it get down to near $195, we’ll put on the other half of the trade by selling a Dec. 9th $195/$190 put spread for whatever the then current bid/offer mid price is at the time. So, two potential sales of put spreads (to possibly enter during the balance of the week) to equal the total exposure you’d normally put on for one option spread trade IF and only if we see a decent pullback.
LOW – Weekly
$GLD
DailyPlay – Conditional Opening Trade (GLD) – November 15, 2022
GLD Conditional Bullish Opening Trade
View GLD Trade
Strategy Details
Strategy: Short Put Vertical Spread
Direction: Bullish
Details: Sell to Open 5 Contracts Dec. 16th $160/$155 Put Vertical Spreads @ $0.74 Credit.
Total Risk: This trade has a max risk of $2,130 (5 Contracts x $426).
Trend Continuation Signal: This is a Bullish trade on a stock that is experiencing a neutral to bullish trend.
1M/6M Trends: Bullish/Mildly Bullish
Technical Score: 6/10
OptionsPlay Score: 107
Entering the Trade
Use the following details to enter the trade on your trading platform. Please note that if there is a multi-leg option strategy, it should be entered as a single trade.
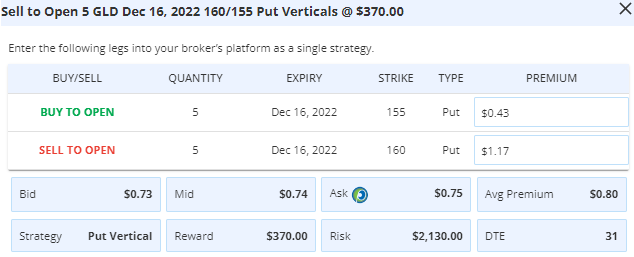
Please note that this is a CONDITIONAL trade. We will only enter the trade when the condition is met, which is IF GLD sells down to $161.50 to $160. Also note that the cost basis, premium paid, as well as the number of contracts when we open this trade will therefore be different from what we post today. This condition is only valid for this week.
Investment Rationale
Stocks were holding recent gains through much of yesterday’s trading, but a late sell-off fueled by Amazon announcing layoffs sent the SPX down some 36 points, virtually on the low of the session. But after the close, the Berkshire Hathaway newest holdings file was released, showing a $4B investment in Taiwan Semiconductor amongst others, helping push futures higher to get back about 1/3 of what they lost yesterday (as of Monday night as I write this).
Running multiple scans yesterday that I do to come up with potential new Daily Play trade ideas yielded no help, as the price is beneath levels I really want to sell at, and are higher than support levels. Thus, we will be patient and look for opportunities that may present themselves to us if they appear at our preferred price.
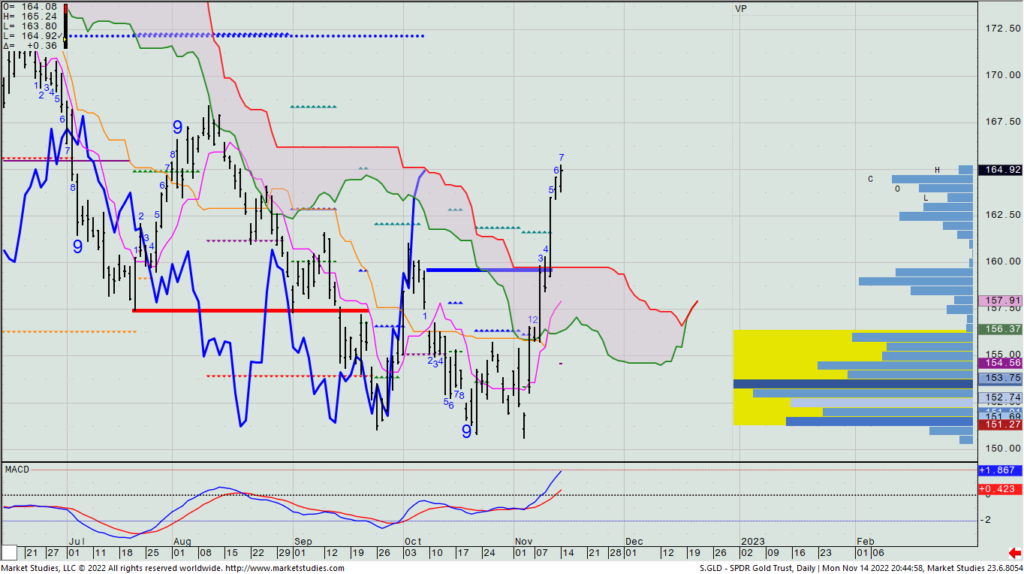
One such idea is to look for a pullback in gold (via the GLD ETF). Yesterday, we saw the cloud’s Lagging Line close right on the top of its cloud, perhaps giving an indication that it can pull back after the $100+ rally that spot gold has made in the past week. Looking at where the daily cloud top shows up for the current price (just north of $160), along with the volume distribution over the last month (shown with horizontal bars on the right side of the chart), should we see the GLD sell down to $161.50 to $160, we’ll sell the Dec. 16th $160/$155 put spread for the then bid/offer mid-price, looking for gold to bottom there and turn back higher. THIS IS A CONDITIONAL TRADE DEPENDING UPON UPCOMING PRICE ACTION AND MAY NOT BE EXECUTED.
GLD – Daily
$IEF
DailyPlay – Partial Closing Trade (VALE) Conditional Bullish Opening Trade (IEF) – November 14, 2022
Partial Closing trade
- VALE -115.63% Gain: Sell to Close 10 Contracts Dec. 2nd $13.50/$15.50 Call Vertical Spreads @ $0.64 Credit. DailyPlay Portfolio: By Closing 10 of the original 20 Contracts, we will be receiving $640.
IEF Conditional Bullish Opening Trade
View IEF Trade
Strategy Details
Strategy: Short Put Vertical Spread
Direction: Bullish
Details: Sell to Open 12 Contracts Dec. 16th $95/$93 Put Vertical Spreads @ $0.47 Credit.
Total Risk: This trade has a max risk of $1,836 (12 Contracts x $153).
Trend Continuation Signal: This is a Bullish trade on a stock that is experiencing a neutral to bullish trend.
1M/6M Trends: Bullish/Neutral
Technical Score: 3/10
OptionsPlay Score: 86
Entering the Trade
Use the following details to enter the trade on your trading platform. Please note that if there is a multi-leg option strategy, it should be entered as a single trade.
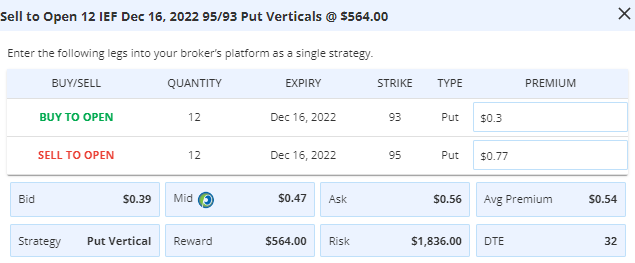
Please note that this is a CONDITIONAL trade. We will only enter the trade when the condition is met, which is IF the TNX rallies to the 3.97% to 4.01% range anytime this week. Also note that the cost basis, premium paid, as well as the number of contracts when we open this trade will therefore be different from what we post today. This condition is only valid for this week.
Investment Rationale
UST 10-yr. rates will adjust today to include what would have been Friday’s move, given the fixed income market was closed then for Veteran’s Day. Last week’s large downdraft in yields did break key support at 3.94%, but they also stopped at one (3.80%) of two downside targets I highlight in today’s weekly webinar.
Since they are trading very technically, let’s look to take advantage of a potential rate rise sometime this week back to ~4%, where I note first level resistance now lies. So, as a conditional trade, let’s look to sell an IEF (that’s the ETF that most closely inversely tracks the TNX’s direction) Dec.16th $95/$93 put spread when/if the TNX rallies to the 3.97% to 4.01% range (anytime this week) at what is then its mid bid/offer spread price. Bond bulls should be supporting the ETF in that $2 zone on a pullback.
IEF – Daily

Our conditional bullish call spread recommendation in VALE was entered on last Thursday’s decline, when we were able to buy the Dec. 2nd $13.50/$15.50 call spread at 64 cents when the stock got into our $13.75 to $13.50 bidding zone. On Friday, the stock closed at $15.45 (with a high of $15.53), and the spread has already doubled in value. Let’s take half off today.
$LEN
DailyPlay – Conditional Bullish Opening Trade (LEN) – November 11, 2022
LEN Conditional Bullish Opening Trade
View LEN Trade
Strategy Details
Strategy: Short Put Vertical Spread
Direction: Bullish
Details: Sell to Open 5 Contracts Dec. 16th $82.50/$77.50 Put Vertical Spreads @ $1.10 Credit.
Total Risk: This trade has a max risk of $1,950 (5 Contracts x $390).
Trend Continuation Signal: This is a Bullish trade on a stock that is experiencing a neutral to bullish trend.
1M/6M Trends: Bullish/Bullish
Technical Score: 9/10
OptionsPlay Score: 89
Entering the Trade
Use the following details to enter the trade on your trading platform. Please note that if there is a multi-leg option strategy, it should be entered as a single trade.
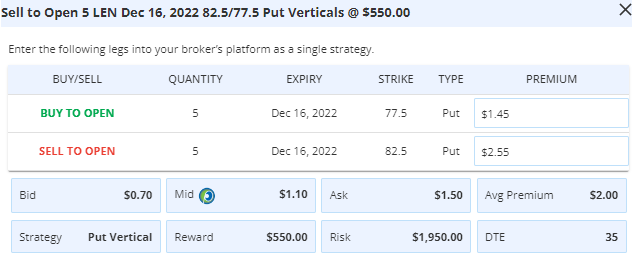
Please note that this is a CONDITIONAL trade. We will only enter the trade when the condition is met, which is If we see a decline to that $84.26 to $81.62 zone. Also note that the cost basis, premium received, as well as the number of contracts when we open this trade will therefore be different from what we post today.
Investment Rationale
Stocks ripped higher, yesterday, while bond rates and the dollar fell sharply, all on the heels of a less than expected inflation number. Ms chased all day long to buy – whether covering shorts or getting long – but was it too much too soon on a single piece of data?
We know that this time of year is a particularly favorable period for stocks (i.e., Nov. thru Apr.), and that the mid-term elections is usually a sweet spot for investing. Now this CPI figure gave bulls everything they wanted to see to believe that the market will rally into year’s end.
Before I jump to that conclusion, let’s see what transpires over the next week. The dollar (DXY), which I have recently been bearish to sell down to 108 to 105.50, is nearing that higher number. Here’s a PPI number out next week that would need to confirm lower levels, or that could put a real damper on the bull party, too. And, heck, inflation is still running at 7.7% — hardly a victory for Americans.
I suspect the Fed will raise rates 50 bps. in December, and with all 6 of Fed governors yesterday making public speeches that did not give bulls anything new to celebrate, let’s not get too enthusiastic about a Fed pivot occurring. (I still don’t think it likely, regardless of yesterday’s inflation number.)
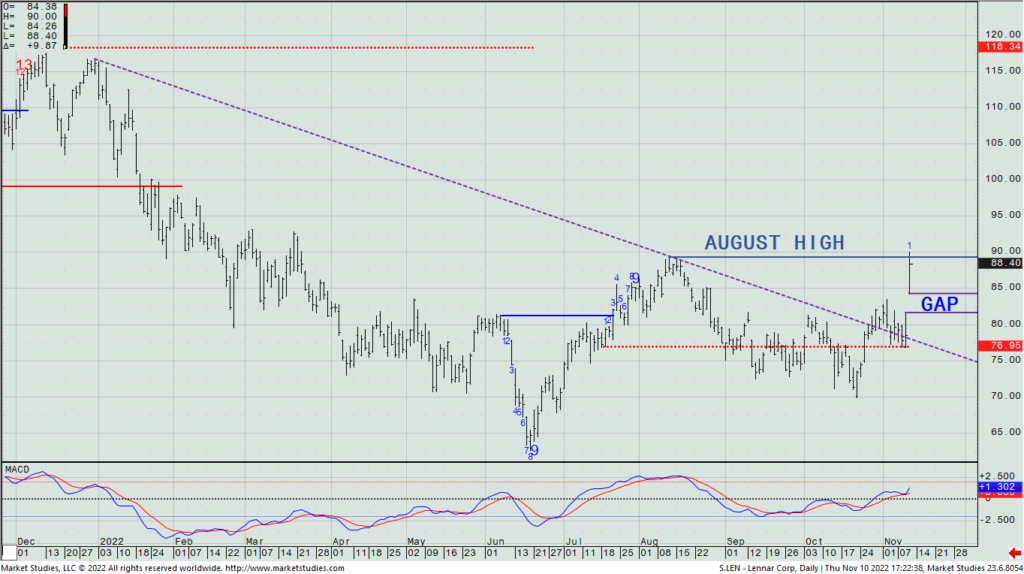
Given the massive upmove yesterday, I can look to buy stocks on a pullback over the next week or so. One name to consider in the homebuilder space (a potential beneficiary of lower rates) is Lennar (LEN), which like practically every name yesterday gapped significantly higher. But I’d be inclined to be a buyer in it on a pullback to that overnight gap area anytime in the next week or so. If we see a decline to that $84.26 to $81.62 zone, we’ll then sell a Dec. 16th $82.5/$77.5 put spread at whatever the then current bid/offer mid-price is.
LEN – Daily
Lastly, yesterday we were able to get into the VALE trade idea I put out earlier this week, looking for bullish entry if we saw the stock get down to the $13.75 to $13.50 zone, which it did yesterday with a low of $13.64. Thus, we were able to get long the Dec. 2nd $13.50/$15.50 call spread for about 64 cents.